Figure 1: Output in format A6 of the file BEJ5L0NP.PDF, see
BEJ5L0N1. PS / TXT / PDF / jpg
230201 1L2L0X0B_(I), http://farbe.li.tu-berlin.de/BEJI.HTM or http://color.li.tu-berlin.de/BEJI.HTM
For this main page with general information and special images
of the corresponding image page with 10 colour series, see
BEJI in English,
BGJI in German.
For the previous main page, see
BEII in English,
BGII in German.
For the next main page, see
BEKI in English,
BGKI in German.
For links to the chapter B
Colour Vision and Colorimetry (2020), see
Content list of chapter B:
BEA_I in English or
BGA_I in German.
Summary of chapter B:
BEA_S in English or
BGA_S in German.
Example image part of 26 parts BEAS to BEZS:
BEAS in English or
BGAS in German.
Chapter B: Colour Vision and Colorimetry (2020), Main part BEJI
1. Introduction and Goals
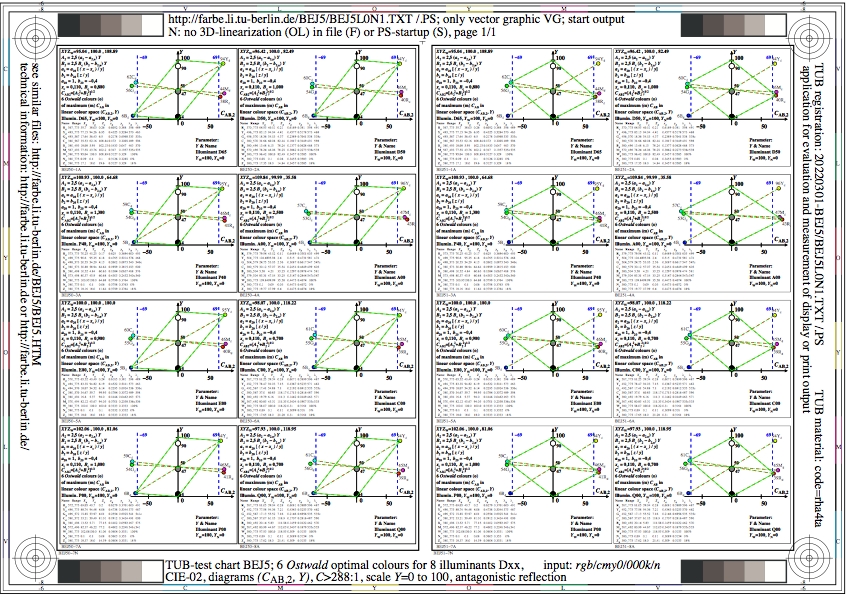
Figure 1: Output in format A6 of the file
BEJ5L0NP.PDF, see
BEJ5L0N1.
PS /
TXT /
PDF /
jpg
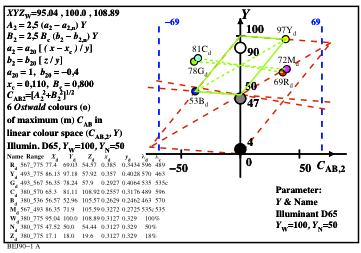
BEJ5:
6 Ostwald optimal colours
for 8 illuminants Dxx, CIE-02-degree observer, chromatic value
diagram (CAB2, Y), contrast C>=288:1.
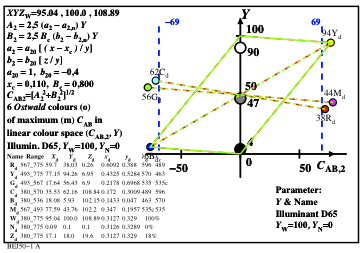
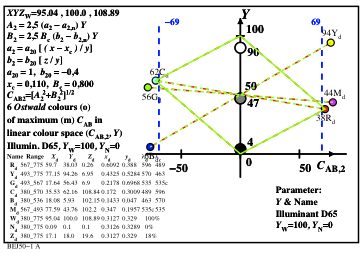
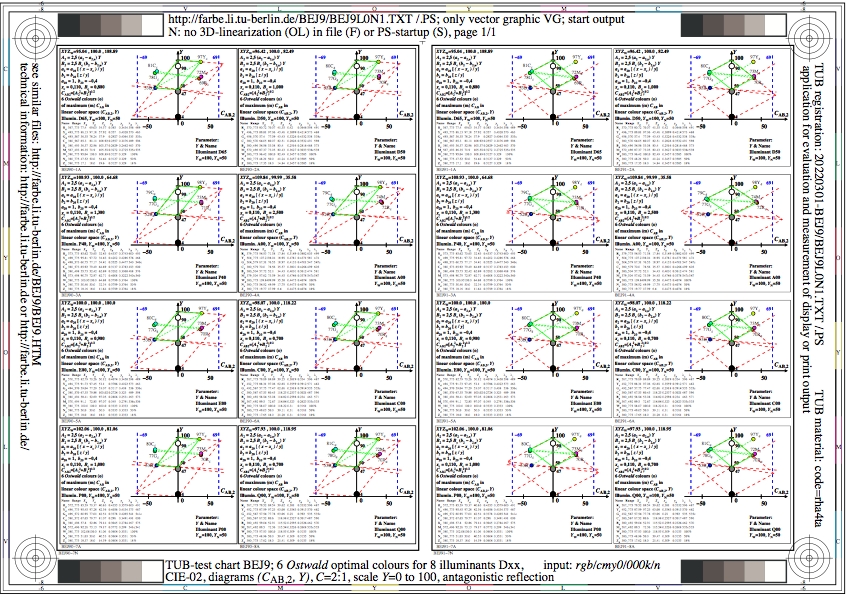
Figure 4: Output in format A6 of the file
BEJ9L0NP.PDF, see
BEJ9L0N1.
PS /
TXT /
PDF /
jpg
BEJ9:
6 Ostwald optimal colours
for 8 illuminants Dxx, CIE-02-degree observer, chromatic value
diagram (CAB,2, Y), contrast C=2:1.
-------
For the archive information (2000-2009) of the BAM server "www.ps.bam.de"
(2000-2018)
about colour test charts, colorimetric calculations,
standards, and publications, see
indexAE.html in English,
indexAG.html in German.
Back to the main page of this TUB web site (NOT archive), see
index.html in English,
indexDE.html in German.