230201 1L2L0X0B_(I), http://farbe.li.tu-berlin.de/BERI.HTM or
http://color.li.tu-berlin.de/BERI.HTM
For this main page with general information and special images
of the corresponding image page with 10 colour series, see
BERI in English,
BGRI in German.
For the previous main page, see
BEQI in English,
BGQI in German.
For the next main page, see
BESI in English,
BGSI in German.
For links to the chapter B
Colour Vision and ColorimetRL (2020), see
Content list of chapter B:
BEA_I in English or
BGA_I in German.
SummaRL of chapter B:
BEA_S in English or
BGA_S in German.
Example image part of 26 parts BEAS to BEZS:
BEAS in English or
BGAS in German.
Chapter B: Colour Vision and Colorimetry (2020),
Main part BERI
1. Introduction and goals
The Ostwald colours have the maximum chromatic values CAB2 of
all surface colours. The wavelength ranges of the Ostwald colours
are limited by two compensative wavelengths. They create therefore
a "colour half". The wavelength limits change by small values with the
illuminant.
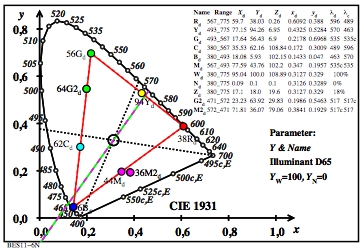
Figure 1: Ostwald-optimal colours in the CIE chromaticity diagram
(x, y) for the colour pairs R-C, Y-B, and G-M
For the download of this figure in the VG-PDF format, see
BES11-6N.PDF.
The colour pair G-M has the wavelength limits 493 nm and 567 nm. The colours
G and M are optimal colours, but no Ostwald-optimal colours.
However, the colour-half pair G2-M2 is an Ostwald-optimal colour. The
colours G2 and M2 have in Figure 1 the wavelength limits 471 nm and 572 nm.
The two corresponding colour halfs with these wavelength limits
are defined by a line in the colours green and magenta.
2. Just noticeable colour differences (JNDs) of Ostwald
colours
The Ostwald colours are produced by a spectral colour mixture with a
colour integrator. By masks only fixed ranges are mixed in Figure 2.
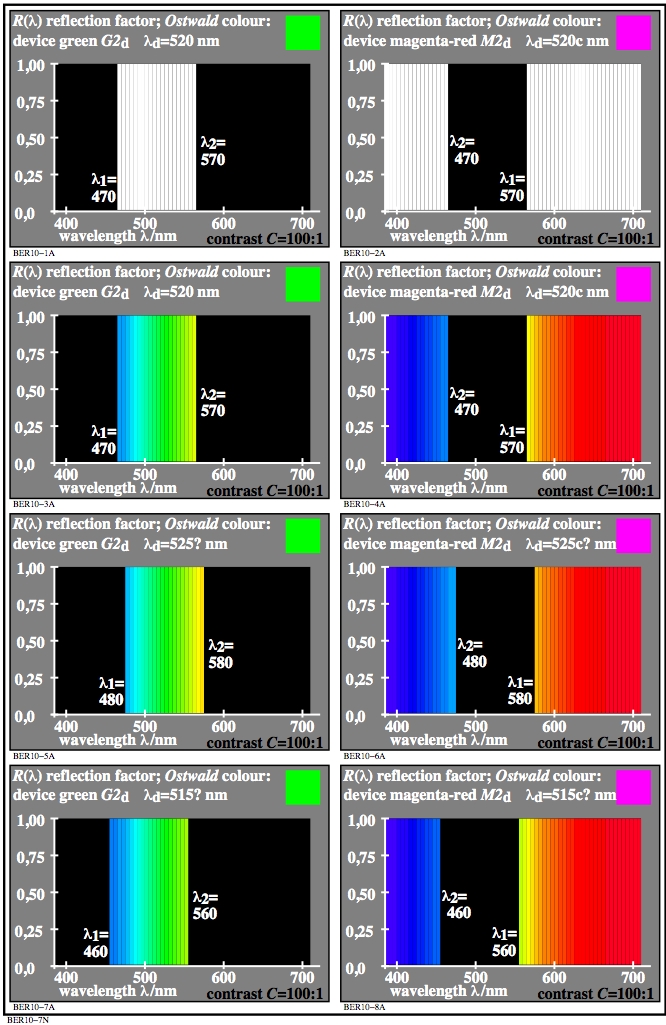
Figure 2: Spectral mixture of the Ostwald-optimal colours by
masks to a homogen colour with a spectral colour integrator
For the download of this figure in the VG-PDF format, see
BER10-7N.PDF.
A double-beam colour integrator allows to produce two equal
Ostwald-optimal colours in two half circular fields. One of the two
masks was shifted until a just noticeable difference (JND) was visible
with a probability of 50%.
The experiment was then repeated with the negative mask. Always complementary
optimal colours belong to the two masks.
The shift of the two masks was always approximately equal for the two
complementary optimal colours. This is shown by an equal shift
of the masks in the right or left direction. The shift for a JND is
approximately equal for the two colours G2 and M2.
3. Equal JNDs for all antagonistic (complementary) optimal colours
according to Holtsmark and Valberg
The experimental result is of special importance for colorimetry:
a. The experiment uses two adjacent colours in a white surround, and in a
dark room. The logarithmic mean of the tristimulues values of white
and black may define a mean grey viewing field with Yu.
b. According to CIE 230:2019 to a high degree the law of Weber-Fechner
is valid in the following form:
L* = k log[Rn] (k = 1 or 0,86, Rn=R/0,20 normalized
reflection) [1]
then it is valid for the derivation:
d(L*) = k d(Rn)/Rn [2]
For equal visual differences d(L*)=1 it is valid:
Rn / d(Rn) = k [3]
In colorimetry instead of the normalized reflection Rn the
normalized CIE tristimulues value
Yn = Y/Yu or the normalized luminance
Ln=L/Lu is used. In this case for the grey surround
Yu is the CIE tristimulues value and
Lu the luminance. The ration according to equation
[3] is independent of the normalization.
Usually it is valid for the tristimulues values of the grey surround:
log Yu = 0,5 (log[YN] + log [YW]) [4]
For surface colours in an ideal case it is valid YW=100 for white W, and
YN=4 for black N. The value YN=4 is approximately valid for all
mate black surface colours. Then the tristimulus value according
to equation [4] is:
Yu = 20 [5]
For example the value according to equation [5] is used in the colour
appearance models CIECAM02 and CIECAM16 (2021 under CIE-vote).
It is of special importance, that equation [1] is equivalent for different
constants k with the following form:
L* = c log [Rn^m] [6]
The variable L* ist called according to Schroedinger and Stiles
the line element for the variable difference dL*.
For just noticeabke differences (JNDs) on a grey surround it is valid
for
- adjacent colours: m=1 (or 0,86)
- separate colours: m=0,5 (or 0,43=0,86/2=1/2,4).
The value 2,4 is applied as gamma value in the information technology.
In the sRGB-colour space according to IEC 61966-2-1 the gamma value
approximates the CIELAB-lightness L*.
It is approximately valid L*CIELAB = L*IECsRGB with
L*CIELAB = 116 (Y/100)^(1/3) - 16 [7]
and
L*IECsRGB = 100 (Y/100)^(1/2,4) [8]
Summary:
For example for the description of colour differences
of adjacent and separate colours on a grey surround,
the line element of equation [1] or the Weber-Fechner ratio [2]
can be applied with different constants m.
The S-shaped signal function of the colour physiology is reached
by an antagonistic logarithmic function around the grey surround
(Ru=0,2 or Yu=20).
This function has the value 0 for the grey surround.
4. Hue circles and hue planes of Ostwald colours
for 8 CIE illuminants and 2 contrasts C>288:1 and 2:1
Instead of the normalized reflection Rn or the normalized tristimulus
value Yn for chromatic colours the linear chromatic values
CAB2 are used. For the calculation see the equations and tables
in the figures.
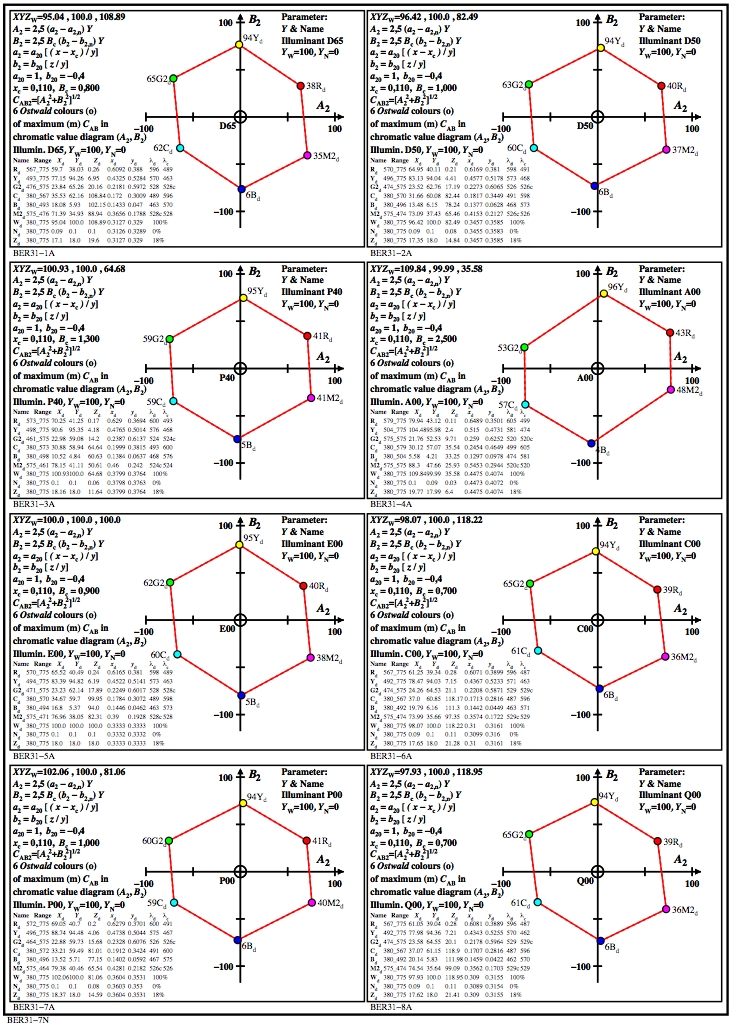
Figure 3: Ostwald-optimal colours in the chromatic value diagram
(A2, B2) for three colour pairs R-C, Y-B, and G-M.
For the download of this figure in the VG-PDF format, see
BER31-7N.PDF.
Parameters are the tristimulues value Y together with the colour name,
for example 94Yd or 6Bd for the color pair Y-B. The tristimulus values
are Y=94 for yellow Yd and Y=6 for blue Bd.
Therefore the tristimulues values differ by a factor 15.
The chromatic values CAB2 are equal within about 10% for
all colour pairs, and the 8 illuminants. The illuminants include
the CIE standard illuminants D65 and A. The equal chromatic value
CAB2 is a special advantage for many applications.
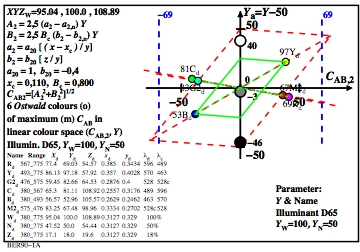
Figure 4: Ostwald-optimal colours in the hue plane Y-B
For the download of this figure in the VG-PDF format, see
BER90-1A.PDF.
The tristimulues values Y of yellow and blue are different
by a factor 15. The chromatic values CAB2 are approximately equal.
As ordinate serves the linear tristumulus-value difference
Y-50.
In later figures the ordinate is the perceived colour attribute L*,
compare equation [6] with the normalized values
Yn = Y/20.
L* = log [Yn^k]
For a grey surround the exponent k is often half for separate colours
compared to adjacent colours.
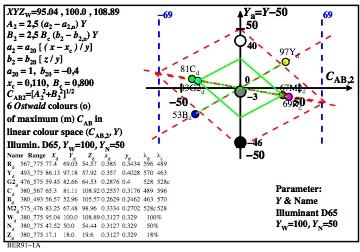
Figure 5: Ostwald-optimal colours in the hue plane
R-C.
For the download of this figure in the VG-PDF format, see
BER91-1A.PDF.
The tristimulues values Y of red and cyan are 81 and 69.
The chromatic values CAB2 are approximately equal. As ordinate the
linear tristimulues-value difference Y-50 is used.
The green curves in figure 4 and 5 are valid for the contrast C=2:1.
The black curves are valid for the theoretical scene contrast C>=288:1.
The visual contrast Cvis = Y / dY is often only
C=25:1 for adjacent colour fields with Y
near the surround.
5. Relation of the Holtsmark results to the colorimetric
line elements of Schroedinger und Stiles
According to Holtsmark and Valberg all complementary optimal
colours have approximately equal JNDs.
For complementary optimal colours the colour stimuli differences
deltaX, deltaY, and detaZ are equal for the production
of just noticeable differences (JNDs). This is also vald for
all linear transformations, for example the differences of
chromatic values deltaA2, deltaA3, and
for the tristimulues values deltaY.
Therefore the following colour-line element of E. Schroedinger
which has been described and interpreted by W.S Stiles
can be developed further:
ds^2 = 1/(lr R + lg G + lb B) [dR^2/R +
dG^2/G +
dB^2/B] [9]
In this equation the constants lr, lg, and lb are the luminous coefficients.
The discrimination in the brightness direction is the same for all
colours. There are no cross terms, for example between R and G.
Cross terms are not allowed to make small-step brightness
an additivity property.
The additivity property seems included in the sRGB-colour space
according to IEC 61966-2-1. The colour values rgb* are proportional
to the device (d) values RGBd. In brightness direction all three
colour values rgb* are scaled proportional to L*CIELAB
for the colour coding and transmittance.
The sRGB-colour values rgb* are therefore specified by a star (*).
The antagonistic logarithmic function arround mean grey produces
therefore equal contrasts (equal Weber-Fechner ratios)
near black and white and for all grey steps.
By this property the colour discrimination
of complementary optimal colours gets equal. The chomatic value
CAB2 is equal for all complementary optimal colours and
not only for the complementary Ostwald-optimal colours.
For example the discrimination in the brightness direction is determined
by the ratio dR/R. This ratio is equal for all grey colours
between black N and white W. In addition this ratio is also equal
for all colours of the row between black and the
Ostwald-optimal colours, and further until white.
If one looks at the CIE tristimulues-value differnces deltaY for
the just noticeable difference (JND), then the differences increase
continuousy between black and white.
If the lightness scaling is described by a quadratic row
of the equation
L* = 100 (Y/100)^(1/2)
then the 10 lightness steps have the regular values 1, 2, to 10.
The corresponding tristimulues values are
Y=1, 4, 9, ..., 81, 100.
Near black the tristimulus-value difference is deltaY=3,
and near white the difference is deltaY=19.
This calculation is valid for separate colour samples viewed on a white
surround. For adjacent colours it is valid according
to Weber-Fechner:
dY/Y = constant
Remarks: The Torger Holtsmark experiments have been done
in 1969/70 at the Institute for Colorimetry (Farbenmetrik)
at the Physical Institute of the University of Basel.
Under the leadership of Karl Miescher two researchers
Arne Valberg and Klaus Richter were responsible
for the construction and the running of the
spectral colour integrator. After publication of his PhD thesis
in 1969, see
_DISS_1969_7397_Richter.pdf
Klaus Richter was one of the observers of the
Holtsmark experiments.
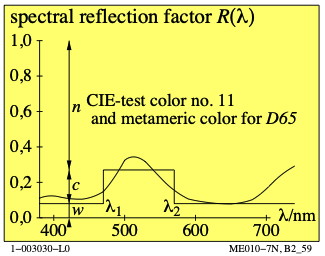
Figure 6: A special metameric colour for the CIE-test colour no. 11
according to CIE 13.3
For the download of this figure in the VG-PDF format, see
ME010-7N.PDF.
The special metameric colour is mixed from an Ostwald-optimal colour
and white and black. A paper of K. Richter (1965) describes the
calculations of many optimal colours and of special metameric colours
compared to surface colours for application with the
colour integrator.
The figure shows for a special green metameric colour the black (n),
the white (w) and the chromatic (c) value.
The chromatic value is defined by the Ostwald-optimal colour
of the same hue with the compensative wavelength limits
of the Ostwald-colour half.
Literature:
Holtsmark, T., Valberg. A. (1969), Colour discrimination and hue,
Nature 224, 366-367.
Richter, K. (1965), Programmierung farbmetrischer Berechnungen,
Die Farbe 14, 275-286.
Valberg. A., Holtsmark, T., Similarity between JND-curves for complementary
optimal colours (1972), in colour metrics, Institue for perception TNO,
Soesterberg, 58-68.
Stiles, W. S., (1972), The line element in colour theory: A historical
review, in colour metrics, Institute for perception TNO,
Soesterberg, 1-25.
Richter, K. (2006), Relation of Weber law and Stevens law at achromatic
threshold, see the URL (11 pages, 200 kB)
A/BAMAT.PDF.
-------
For the archive information (2000-2009) of the BAM server "www.ps.bam.de"
(2000-2018)
about colour test charts, colorimetric calculations,
standards, and publications, see
indexAE.html in English,
indexAG.html in German.
Back to the main page of this TUB web site (NOT archive), see
index.html in English,
indexDE.html in German.