230201 1L2L0X0B_(I), http://farbe.li.tu-berlin.de/BESI.HTM or
http://color.li.tu-berlin.de/BESI.HTM
For this main page with general information and special images
of the corresponding image page with 10 colour series, see
BESI in English,
BGSI in German.
For the previous main page, see
BERI in English,
BGRI in German.
For the next main page, see
BETI in English,
BGTI in German.
For links to the chapter B
Colour Vision and ColorimetRL (2020), see
Content list of chapter B:
BEA_I in English or
BGA_I in German.
SummaRL of chapter B:
BEA_S in English or
BGA_S in German.
Example image part of 26 parts BEAS to BEZS:
BEAS in English or
BGAS in German.
Chapter B: Colour Vision and Colorimetry (2020),
Main part BESI
1. Introduction and goals
The Ostwald colours have the maximum chromatic values CAB2 of
all surface colours. The wavelength ranges of the Ostwald colours
are limited by two compensatory wavelengths. They create therefore
a "colour half". The wavelength limits change by small values with the
illuminant.
Any neighboring surround changes the colour spacing and the colour appearance,
for example of a grey scale.
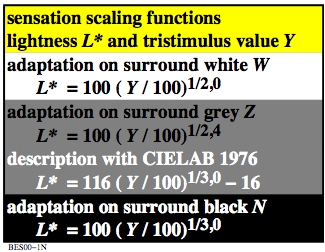
Figure 1: Scaling function on a white, grey and black surround
For the download of this figure in the VG-PDF format, see
BES00-1N.PDF.
According to IEC 61966-2-1 (sRGB-colour space) the grey scaling of the lightness
L* according to CIELAB on a mean grey surround is approximated by a potential
function with the exponent 1/2,4. Then in the figure the lightness functions
L* differ only by the three exponents 1/2=0,5, 1/2,4=0,42, and 1/3=0,33.
2. Viewing situation of adjacent and separate colours
The viewing situation, for example of separate and adjacent colours,
has an influence on the colour appearance and colour scaling.
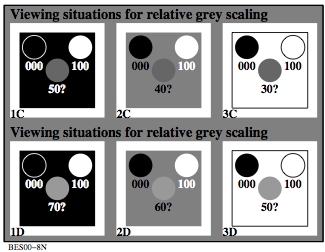
Figure 2: Relative colour scaling of grey test samples
in comparison to black and white
For the download of this figure in the VG-PDF format, see
BES00-8N.PDF.
The figure shows the estimated values of the lightness
in comparison to the lightness cero of black and 100 for white.
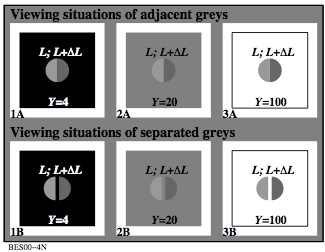
Figure 3: Just Noticeable Differences (JNDs) of adjacent
and separate grey samples
For the download of this figure in the VG-PDF format, see
BES00-4N.PDF.
The luminance differences delta_L for Just Noticeable Differences JNDs
increase with the distance of the samples.
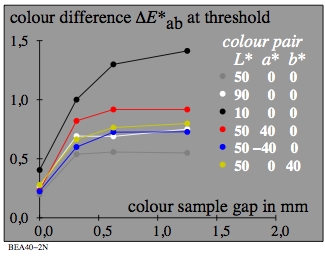
Figure 4: Just Noticeable Differences (JNDs) as function of the sample distance
in mm
For the download of this figure in the VG-PDF format, see
BEA40-2N.PDF.
The measured differences delta_L for
Just Noticeable Differences JNDs are by a factor three larger
for the separated samples. According to Kittelmann (2010) this is valid
for all colour samples which change in the lightness direction,
and with the CIELAB data in the figure.
3. Colour attributes Blackness N*, whiteness W*,
Chromaticness C*, and the antagonistic attributes
I*, T*, and A*
The visual system can order the colours by colour attributes.
For the determination and differentiation one needs defined criteria.
For the antagonistic pair blackness N* and Brilliantness I*
this is the criteria neither blackish nor luminous.
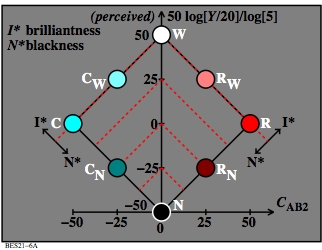
Figure 5: Colour attribute blackness N* and brilliantness
I*
For the download of this figure in the VG-PDF format, see
BES21-6A.PDF.
Dashed red lines show the equality of the colour attribute
blackness N* or of the antagonistic colour attribute brilliantness
I*.
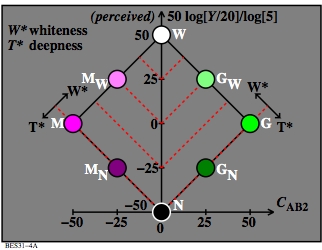
Figure 6: Colour attribute whiteness W* and deepness T*
For the download of this figure in the VG-PDF format, see
BES31-4A.PDF.
Dashed red lines show the equality of the colour attributes
whiteness W* or of the antagonistic colour attribute
deepness T*.
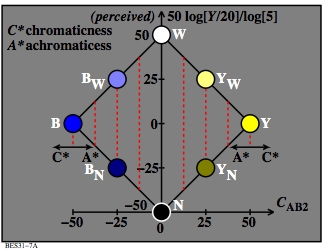
Figure 7: Colour attribute chromaticness C* and
achromaticness A*
For the download of this figure in the VG-PDF format, see
BES31-7A.PDF.
Dashed red lines show the equality of the colour attribute
chromaticness C* or of the antagonistic colour attribute
achromaticness A*.
4. Antagonistic optimal colours of a colour half
AN Optimal colour is usually defined by two jumps of the reflection curves.
With a special band width and with compensatory wavelength limits
surface colours are produced with the maximal chromatic values CAB2.
The are called Ostwald-optimal colours.
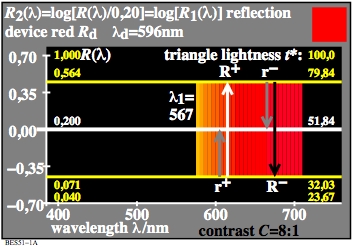
Figure 8: Spectral reflection of the Ostwald-optimal colour Red Rd
For the download of this figure in the VG-PDF format, see
BES51-1A.PDF.
The two spectral colours of the wavelength 567 nm and of the wavelength 720 nm
at the visual spectral end are compensatory or complementary.
With a appropriate ratio the two wavelength mix to the white W
of the CIE-standard illuminant D65 (daylight).
The arrows from down to top shall indicate, that one can mix colours
additive, if one starts with black.
The arrows from top to down shall indicate, that one can mix colours
subtractive, if one starts with white.
The importance of the arrows will be further described in Fig. 10 and 11.
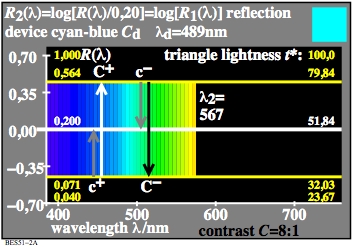
Figure 9: Spectral reflection of the Ostwald-optimal colour Cyan Cd
For the download of this figure in the VG-PDF format, see
BES51-2A.PDF.
The additive mixture of the colours Cyan Cd and Red Rd produces white.
The additive mixture produces the total spectrum of white W.
The two colours Cd and Rd are mixed by spectral colours of different ranges.
Their appearance is shown on the right top in a square.
On nearly all displays white is mixed by the device colours
Red Rd and Cyan Cd. Cyan Cd is a mixture of Green Gd and Blue Bd.
White W is therefore mixed by three colours Rd, Gd, and Bd.
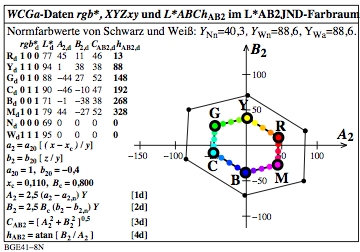
Bild 10: LABJND-chromatic values of the display WideColourGamut (WCGa)
of the EBU 2020
For the download of this figure in the VG-PDF format, see
BGE41-8N.PDF.
In the colour space LABJND the radial chromatic values CAB2
of antagonistic colours are equal, for example of
Cd and Rd, which mix to white.
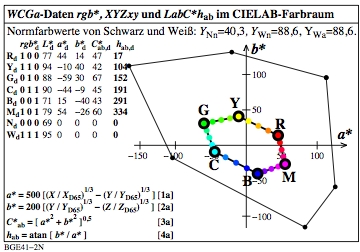
Bild 11: CIELAB-chroma data of the display WideColourGamut (WCGa) of the EBU 2020
For the download of this figure in the VG-PDF format, see
BGE41-2N.PDF.
For example the data CIELAB-chroma C*ab are for antagonistic colours
not equal. Therefore CIELAB may be less appropriate for the
description of display colours.
The CIELAB-chroma increases for larger chroma of yellow and green in comparison
to the visual differences, see Richter (1980), Cube Root Colour Spaces and
Chromatic Adaptation, CR&A. This property is also visible in Fig. 11.
Therefore the colour space LABJND may be more appropriate to describe the
colour appearance and the colour differences compared to CIELAB.
5. Colour vectors of the antagonistic colour vision model and relation with
linear colour values, and linear and nonlinear colour attributes
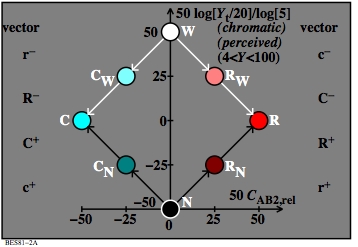
Figure 12: Colour mixture of Red and Cyan with start
by either black N or white W
For the download of this figure in the VG-PDF format, see
BES80-2A.PDF.
The blackish vectors (arrows) from down to top shall indicate,
that for the start from black one can mix
the dark red colour RN with r+ and
and the lighter most chromatic colour Red R with R+.
Similar one can subtract from the whole spectrum white W the colour Red R
and produces the colour Cyan C.
The whitish vectors (arrows) from top to down shall indicate,
that for the start from white one can mix
the dark light colour CW with r- and
the darker most chromatic colour Cyan C with R-.
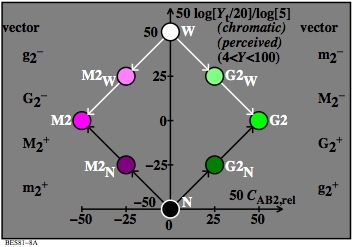
Figure 13: Colour mixture of Green G2 and Magenata M2 with start
by either black N or white W
For the download of this figure in the VG-PDF format, see
BES80-8A.PDF.
The blackish vectors (arrows) from down to top shall indicate,
that for the start from black N one can mix
the dark green colour G2N with g2+ and
and the lighter most chromatic colour Green G2 with G2+.
Similar one can subtract from the whole spectrum white W the colour Green G2
and produce the colour Magenta M2.
The whitish vectors (arrows) from top to down shall indicate,
that for the start from white one can mix
the light colour M2W with g2- and
and the darker most chromatic colour Magenta M2 with G2-.
The vectors with a "+" or "-" correspond to physiological
signals in the retina. There are four antagonistic signal processes
W-N, R-C, Y-B, and G-M. Often only three signal processes
W-N, Y-B, and R-G are described. Three signals R-G
are probably created as the mean of R-C and M-G
in a higher signal step.
-------
For the archive information (2000-2009) of the BAM server "www.ps.bam.de"
(2000-2018)
about colour test charts, colorimetric calculations,
standards, and publications, see
indexAE.html in English,
indexAG.html in German.
Back to the main page of this TUB web site (NOT archive), see
index.html in English,
indexDE.html in German.