Figure CEO0L0N1.jpg: Output in format A6 of the file CEO0L0NP.PDF, see
CEO0L0N1. PS / TXT / PDF / jpg
240215 1L2L0X0C_S2710.KTS/YEOLCIN.KTS, http://farbe.li.tu-berlin.de/CEOS.HTM or http://color.li.tu-berlin.de/CEOS.HTM
For links to the
Section 2, Chapter C
Colour Spaces, Colour Differences, and Line Elements (2021),
see
For this image page with 10 colour series, see
CEOS in English,
CGOS in German.
For the previous image page, see
CENS in English,
CGNS in German.
For the next image page, see
CEPS in English,
CGPS in German.
For the first image page of the previous chapter B, see
BEAS in English,
BGAS in German.
For the first image page of the next chapter D, see
DEAS in English,
DGAS in German.
Content list of chapter C:
CEA_I in English or
CGA_I in German.
Summary of chapter C:
CEA_S in English or
CGA_S in German.
For the large image page of chapter C with 260 colour series, see
ce2s in English or
cg2s in German.
Section 2, Chapter C
Colour Spaces, Colour Differences, and Line Elements (2021),
Image part CEOS
The following ten pages CEO0 to CEO9 of this chapter
show the content with links to the single figures
in up to six formats.
Figure CEO0L0N1.jpg: Output in format A6 of the file
CEO0L0NP.PDF, see
CEO0L0N1.
PS /
TXT /
PDF /
jpg
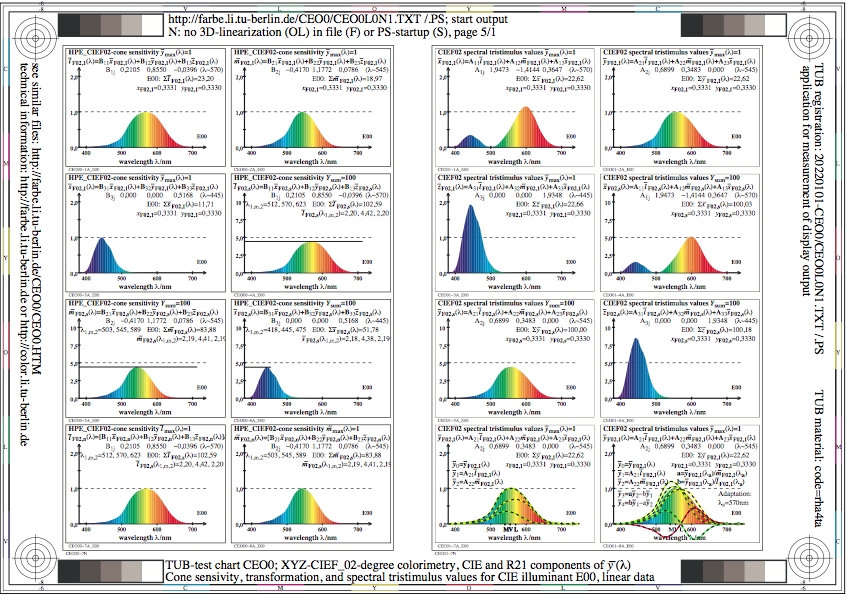
CEO0: TUB-Test chart CEO0; CIE F02-degree colorimetry
LMS-CIE-Cone sensitivity, hue translation, and spectral
CIE/R21-tristimulus-value translation CIE E00; linear data

Figure CEO1L0N1.jpg: Output in format A6 of the file
CEO1L0NP.PDF, see
CEO1L0N1.
PS /
TXT /
PDF /
jpg
CEO1: TUB-Test chart CEO1; CIE F10-degree colorimetry
LMS-CIE-Cone sensitivity, hue translation, and spectral
CIE/R21-tristimulus value translation CIE E00; linear data
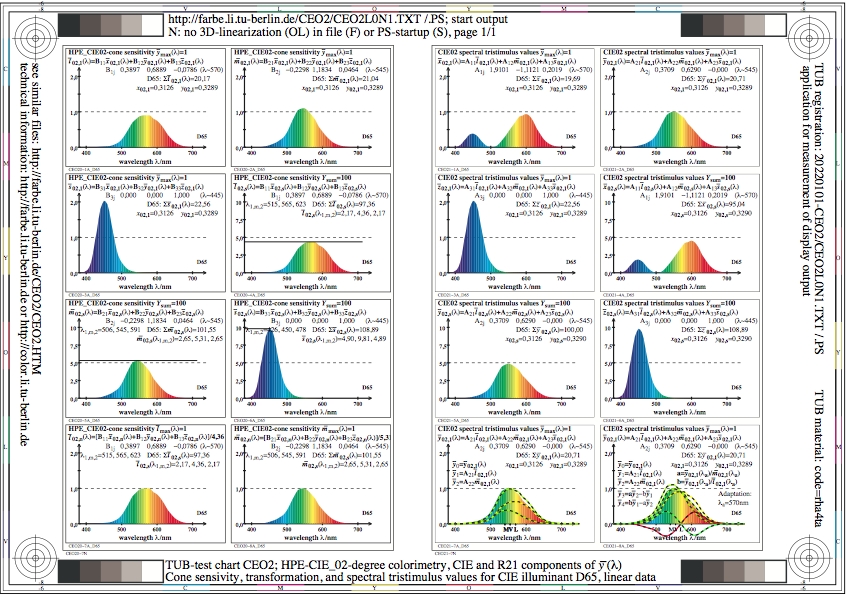
Figure CEO2L0N1.jpg: Output in format A6 of the file
CEO2L0NP.PDF, see
CEO2L0N1.
PS /
TXT /
PDF /
jpg
CEO2: TUB-Test chart CEO2; CIE 02-degree colorimetry
HPE-CIE-Cone sensitivity, hue translation, and spectral
tristimulus values for 8 illuminants Dxx; linear data

Figure CEO3L0N1.jpg: Output in format A6 of the file
CEO3L0NP.PDF, see
CEO3L0N1.
PS /
TXT /
PDF /
jpg
CEO3: TUB-Test chart CEO3; CIE 10-degree colorimetry
HPE-CIE-Cone sensitivity, hue translation, and spectral
tristimulus values for 8 illuminants Dxx; linear data
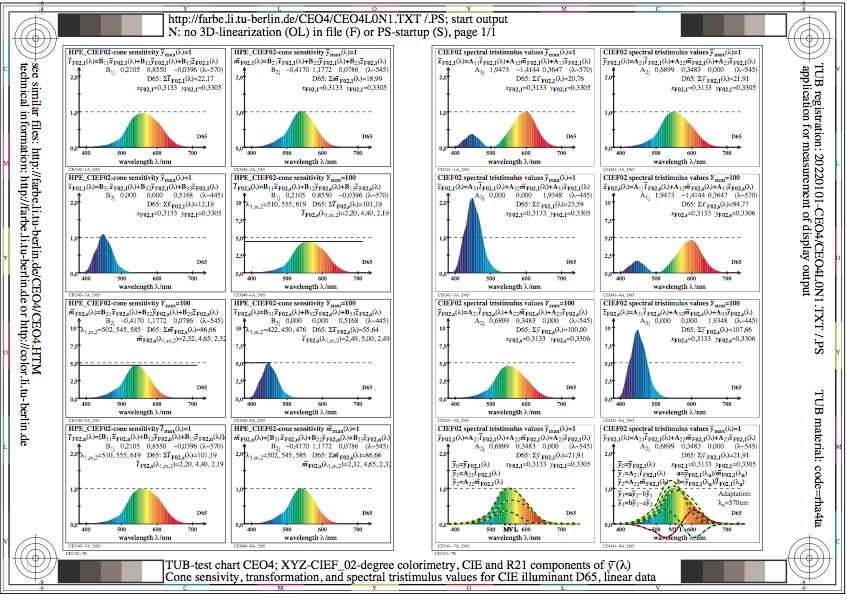
Figure CEO4L0N1.jpg: Output in format A6 of the file
CEO4L0NP.PDF, see
CEO4L0N1.
PS /
TXT /
PDF /
jpg
CEO4: TUB-Test chart CEO4; CIE F02-degree colorimetry
LMS-CIE-Cone sensitivity, hue translation, and spectral
tristimulus values for 8 illuminants Dxx; linear data

Figure CEO5L0N1.jpg: Output in format A6 of the file
CEO5L0NP.PDF, see
CEO5L0N1.
PS /
TXT /
PDF /
jpg
CEO5: TUB-Test chart CEO5; CIE F10-degree colorimetry
LMS-CIE-Cone sensitivity, hue translation, and spectral
tristimulus values for 8 illuminants Dxx; linear data

Figure CEO6L0N1.jpg: Output in format A6 of the file
CEO6L0NP.PDF, see
CEO6L0N1.
PS /
TXT /
PDF /
jpg
CEO6: TUB-Test chart CEO6; CIE 02-degree colorimetry
HPE-CIE-Cone sensitivity, hue translation, and spectral
tristimulus values for 8 illuminants Pxx; linear data
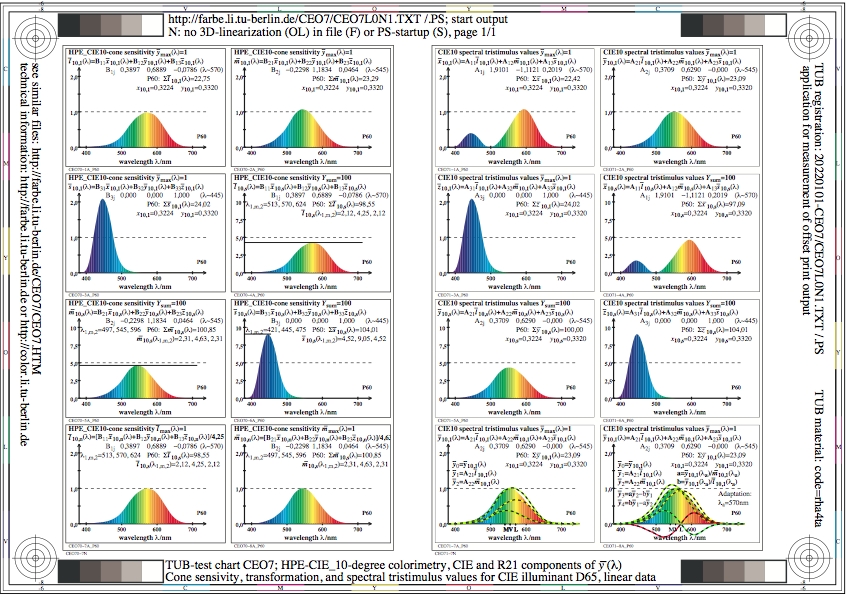
Figure CEO7L0N1.jpg: Output in format A6 of the file
CEO7L0NP.PDF, see
CEO7L0N1.
PS /
TXT /
PDF /
jpg
CEO7: TUB-Test chart CEO7; CIE 10-degree colorimetry
HPE-CIE-Cone sensitivity, hue translation, and spectral
tristimulus values for 8 illuminants Pxx; linear data
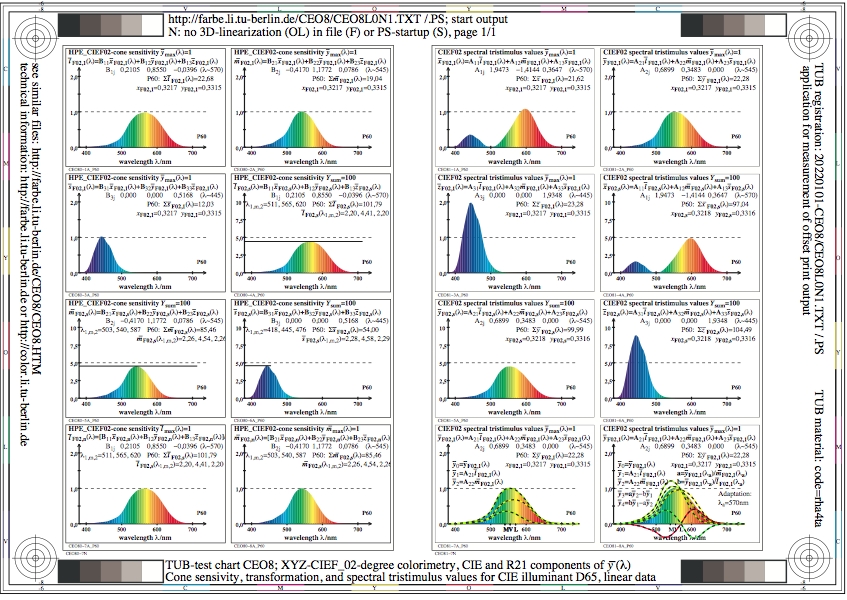
Figure CEO8L0N1.jpg: Output in format A6 of the file
CEO8L0NP.PDF, see
CEO8L0N1.
PS /
TXT /
PDF /
jpg
CEO8: TUB-Test chart CEO8; CIE F02-degree colorimetry
LMS-CIE-Cone sensitivity, hue translation, and spectral
tristimulus values for 8 illuminants Pxx; linear data
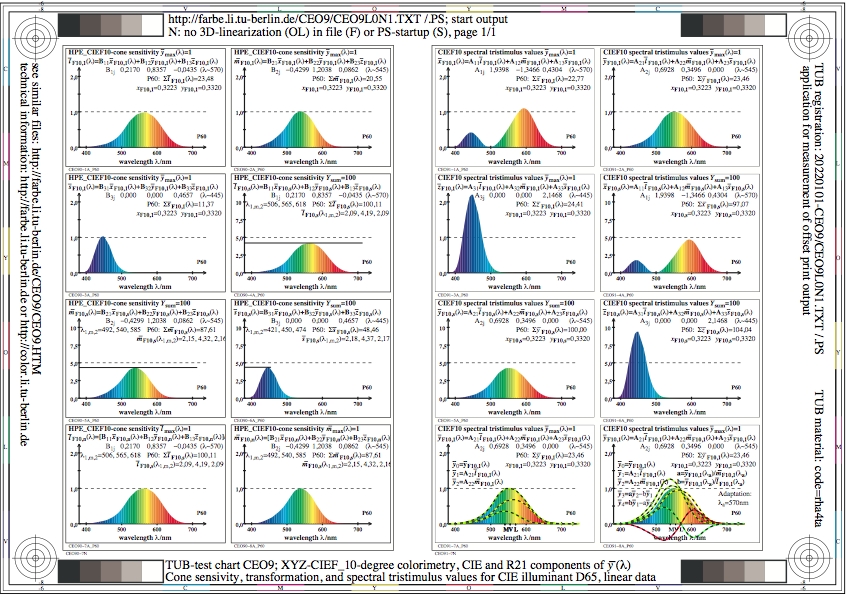
Figure CEO9L0N1.jpg: Output in format A6 of the file
CEO9L0NP.PDF, see
CEO9L0N1.
PS /
TXT /
PDF /
jpg
CEO9: TUB-Test chart CEO9; CIE F10-degree colorimetry
LMS-CIE-Cone sensitivity, hue translation, and spectral
tristimulus values for 8 illuminants Pxx; linear data
-------
For the archive information (2000-2009) of the BAM server "www.ps.bam.de"
(2000-2018)
about colour test charts, colorimetric calculations,
standards, and publications, see
indexAE.html in English,
indexAG.html in German.
Back to the main page of this TUB web site (NOT archive), see
index.html in English,
indexDE.html in German.