
Figure DEV0L0N1.jpg: Output in format A6 of the file DEV0L0NP.PDF, see
DEV0L0N1. PS / TXT / PDF / jpg
240215 1L2L0X0D_S2710.KTS/YEVLDIN.KTS, http://farbe.li.tu-berlin.de/DEVS.HTM or http://color.li.tu-berlin.de/DEVS.HTM
For links to the
Section 2, Chapter D
Colour Appearance, Elementary Colours, and Metrics (2022),
see
For this image page with 10 colour series, see
DEVS in English,
DGVS in German.
For the previous image page, see
DEUS in English,
DGUS in German.
For the next image page, see
DEWS in English,
DGWS in German.
For the first image page of the previous chapter C, see
CEAS in English,
CGAS in German.
For the first image page of the next chapter E, see
eeas in English,
egas in German.
Content list of chapter D:
DEA_I in English or
DGA_I in German.
Summary of chapter D:
DEA_S in English or
DGA_S in German.
For the large image page of chapter D with 260 colour series, see
de2s in English or
dg2s in German.
Section 2, Chapter D
Colour Appearance, Elementary Colours, and Metrics (2022),
Image part DEVS
The following ten pages DEV0 to DEV9 of this chapter
show the content with links to the single figures
in up to six formats.
Figure DEV0L0N1.jpg: Output in format A6 of the file
DEV0L0NP.PDF, see
DEV0L0N1.
PS /
TXT /
PDF /
jpg
DEV0: TUB-test chart DEV0; Chromatic adaptation TUBLAB2 model
Ostwald optimal colours for 8 illuminants:
P60 (6000K), P55, P50, P45, P40, P35, P30, P25 (2500K)
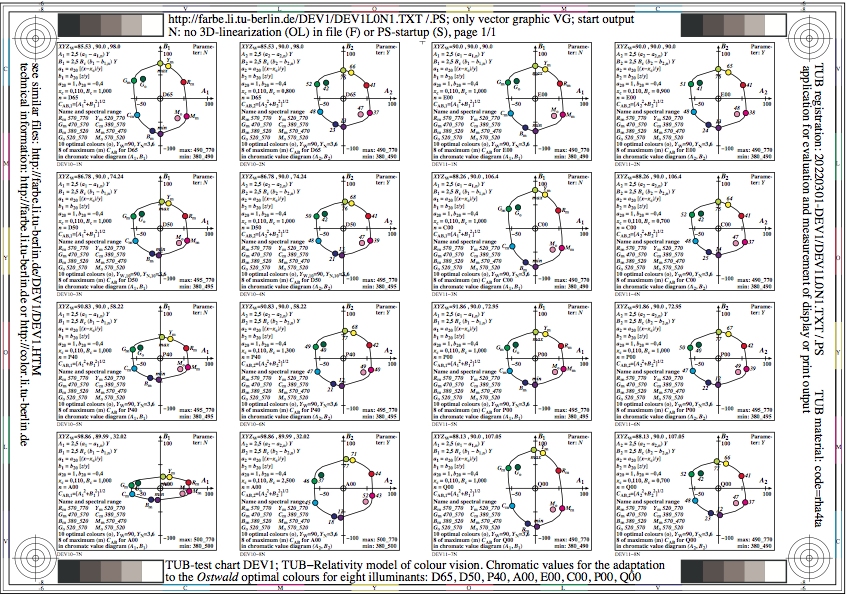
Figure DEV1L0N1.jpg: Output in format A6 of the file
DEV1L0NP.PDF, see
DEV1L0N1.
PS /
TXT /
PDF /
jpg
DEV1: TUB-test chart DEV1; Chromatic adaptation, TUBLAB2 model
Ostwald optimal colours for 8 illuminants:
D65 (6500K), D50, P40 (4000K), A00, E00, C00, P00, Q00
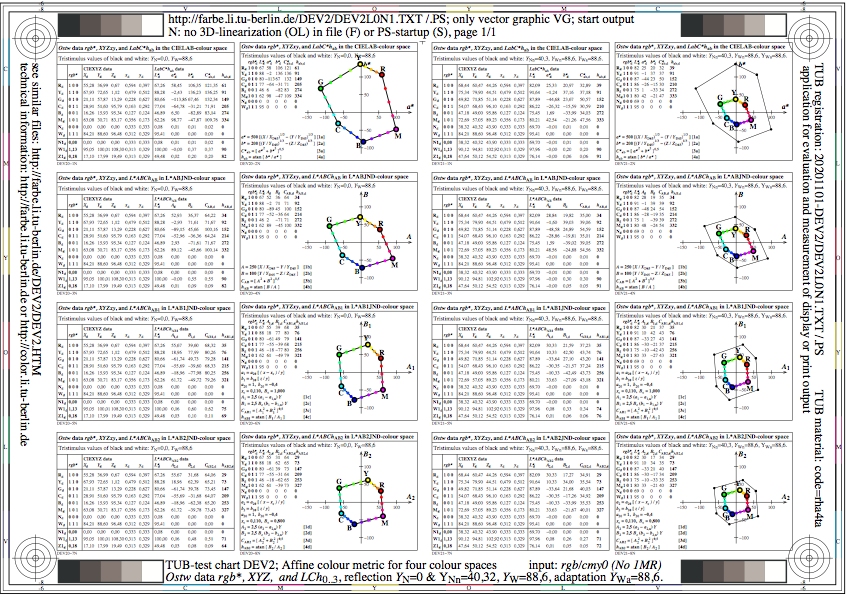
Figure DEV2L0N1.jpg: Output in format A6 of the file
DEV2L0NP.PDF, see
DEV2L0N1.
PS /
TXT /
PDF /
jpg
DEV2: TUB-test chart DEV2; Ostwald-display reflections
rgb* input and L*ABCh output in device hue planes
Reflections YN=0 and YNn=40,3, adaptation YWa=88,6
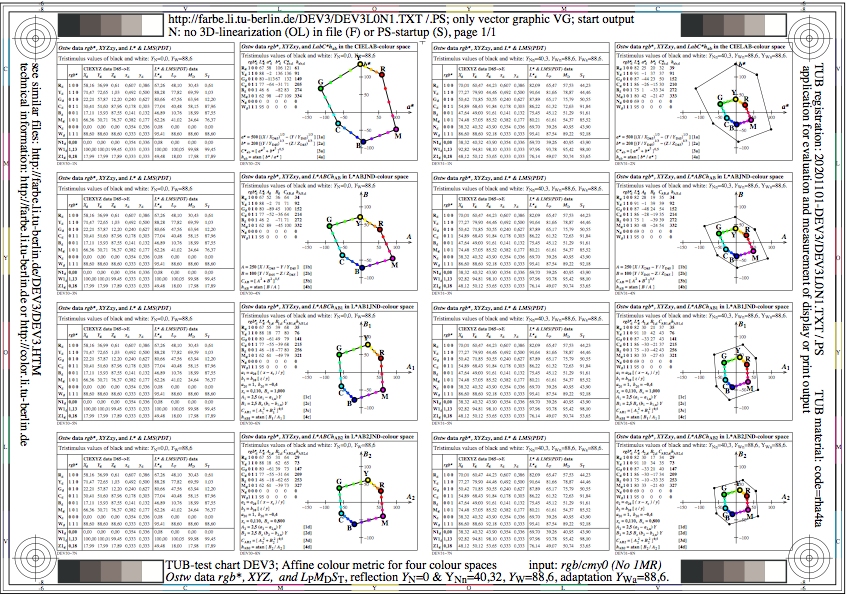
Figure DEV3L0N1.jpg: Output in format A6 of the file
DEV3L0NP.PDF, see
DEV3L0N1.
PS /
TXT /
PDF /
jpg
DEV3: TUB-test chart DEV3; Ostwald-display reflections
rgb* input and LMS(PDT) output in device hue planes
Reflections YN=0 and YNn=40,3, adaptation YWa=88,6
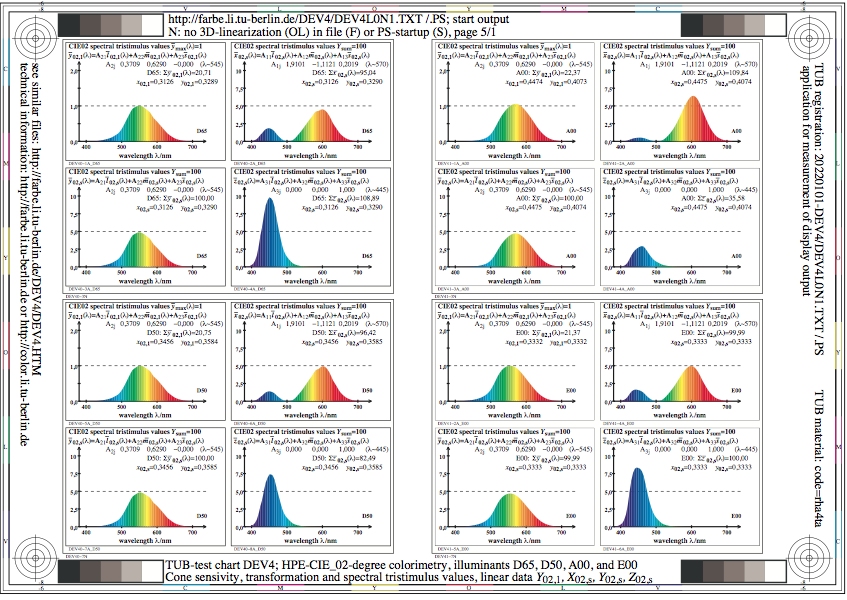
Figure DEV4L0N1.jpg: Output in format A6 of the file
DEV4L0NP.PDF, see
DEV4L0N1.
PS /
TXT /
PDF /
jpg
DEV4: TUB-test chart DEV4; HPE_CIE_02-degree colorimetry
four illuminants D65, D50, A00, and E00, Y02,1, (XYZ)02,s
cone sensitivities, transfer and spectral values

Figure DEV5L0N1.jpg: Output in format A6 of the file
DEV5L0NP.PDF, see
DEV5L0N1.
PS /
TXT /
PDF /
jpg
DEV5: TUB-test chart DEV5; HPE_CIE_02-degree colorimetry
four illuminants D65, D50, A00, and E00, Y02,1, LMS(PDT)02,s
cone sensitivities, transfer and spectral values

Figure DEV6L0N1.jpg: Output in format A6 of the file
DEV6L0NP.PDF, see
DEV6L0N1.
PS /
TXT /
PDF /
jpg
DEV6: TUB-test chart DEV6; Chromatic adaptation: TUBLAB2 model
Ostwald optimal, threshold dhA2B2=6, 8 illuminants:
P60 (6000K), P55, P50, P45, P40, P35, P30, P25 (2500K)

Figure DEV7L0N1.jpg: Output in format A6 of the file
DEV7L0NP.PDF, see
DEV7L0N1.
PS /
TXT /
PDF /
jpg
DEV7: TUB-test chart DEV7; Chromatic adaptation: TUBLAB2 model
Ostwald colours, threshold dhA2B2=6, 8 illuminants:
D65 (6500K), D50, P40 (4000K), A00, E00, C00, P00, Q00
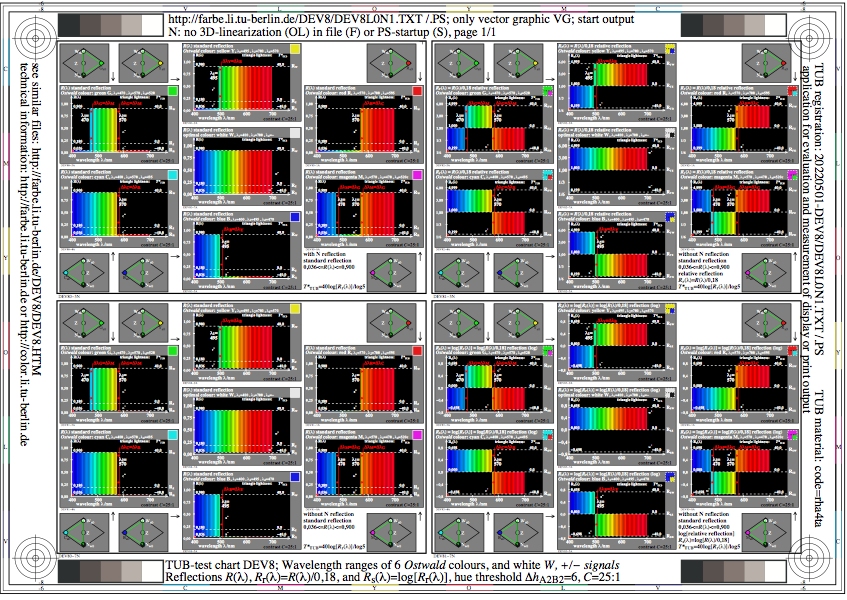
Figure DEV8L0N1.jpg: Output in format A6 of the file
DEV8L0NP.PDF, see
DEV8L0N1.
PS /
TXT /
PDF /
jpg
DEV8: TUB-test chart DEV8; Wavelength ranges of 6
Ostwald colours and W, contrast C=25:1, +-signals
Reflections R, Rr=R/0,18, Rs=log(Rr), hue threshold dhA2B2=6
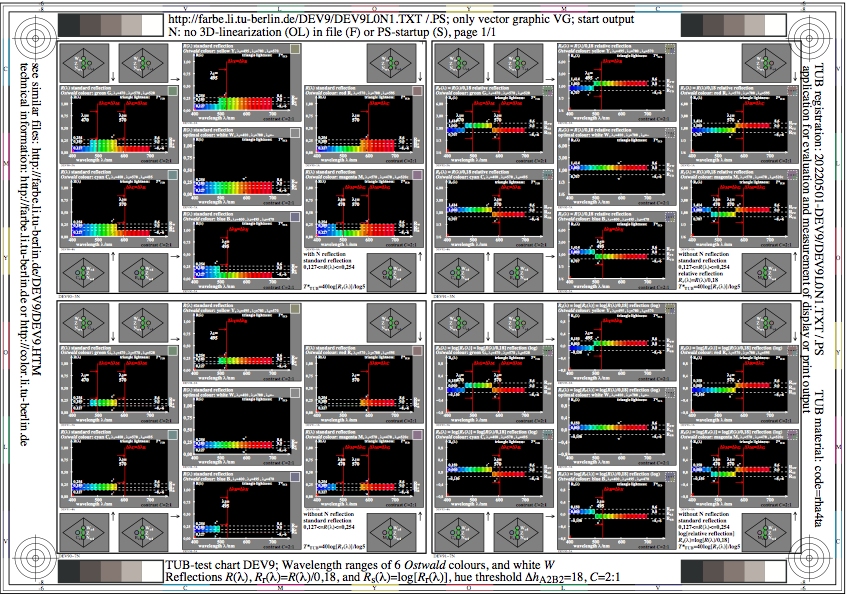
Figure DEV9L0N1.jpg: Output in format A6 of the file
DEV9L0NP.PDF, see
DEV9L0N1.
PS /
TXT /
PDF /
jpg
DEV9: TUB-test chart DEV9; Wavelength ranges of 6
Ostwald colours and W, contrast C=2:1, +-signals
Reflections R, Rr=R/0,18, Rs=log(Rr), hue threshold dhA2B2=18
-------
For the archive information (2000-2009) of the BAM server "www.ps.bam.de"
(2000-2018)
about colour test charts, colorimetric calculations,
standards, and publications, see
indexAE.html in English,
indexAG.html in German.
Back to the main page of this TUB web site (NOT archive), see
index.html in English,
indexDE.html in German.