Figure AEQ0L0N1.jpg: Output in format A6 of the file AEQ0L0NP.PDF, see
AEQ0L0N1. PS / TXT / PDF / jpg
240215 1L2L0X0A_S2710.KTS/YEQLAIN.KTS, http://farbe.li.tu-berlin.de/AEQS.HTM or http://color.li.tu-berlin.de/AEQS.HTM
For links to the
Section 2, Chapter A
Colour Image Technology and Colour Management (2019),
see
For this image page with 10 colour series, see
AEQS in English,
AGQS in German.
For the previous image page, see
AEPS in English,
AGPS in German.
For the next image page, see
AERS in English,
AGRS in German.
No previous chapter of chapter A
.
For the first image page of the next chapter B, see
BEAS in English,
BGAS in German.
Content list of chapter A:
AEA_I in English or
AGA_I in German.
Summary of chapter A:
AEA_S in English or
AGA_S in German.
For the large image page of chapter A with 260 colour series, see
ae2s in English or
ag2s in German.
Section 2, Chapter A
Colour Image Technology and Colour Management (2019),
Image part AEQS
The following ten pages AEQ0 to AEQ9 of this chapter
show the content with links to the single figures
in up to six formats.
Figure AEQ0L0N1.jpg: Output in format A6 of the file
AEQ0L0NP.PDF, see
AEQ0L0N1.
PS /
TXT /
PDF /
jpg
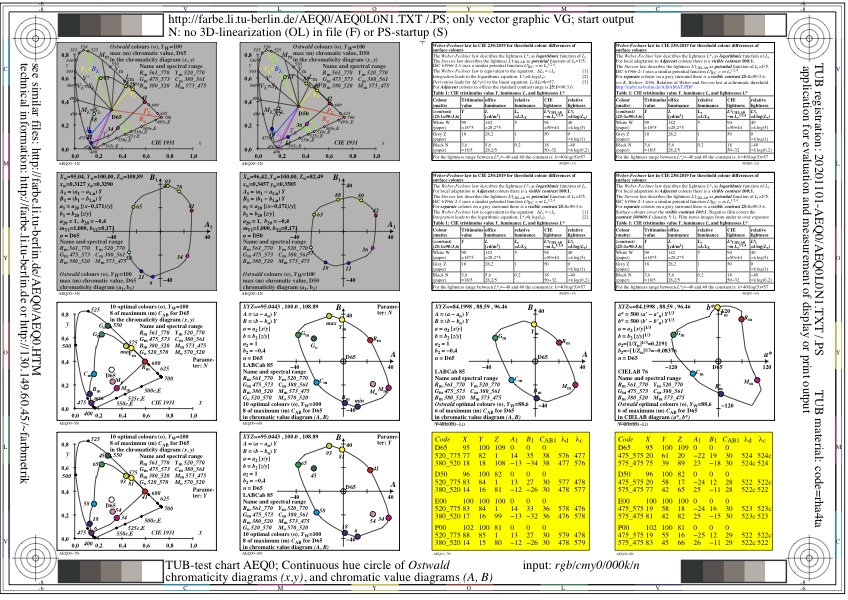
AEQ0: TUB-Test chart AEQ0; Ostwald-optimal colours
Continuous hue circle with elementary colours
Chromaticity (x,y) and chromatic value (A, B)

Figure AEQ1L0N1.jpg: Output in format A6 of the file
AEQ1L0NP.PDF, see
AEQ1L0N1.
PS /
TXT /
PDF /
jpg
AEQ1: TUB-test chart AEQ1; Colour vision
Physiological signals in colour vision
as function of luminance and chromaticity
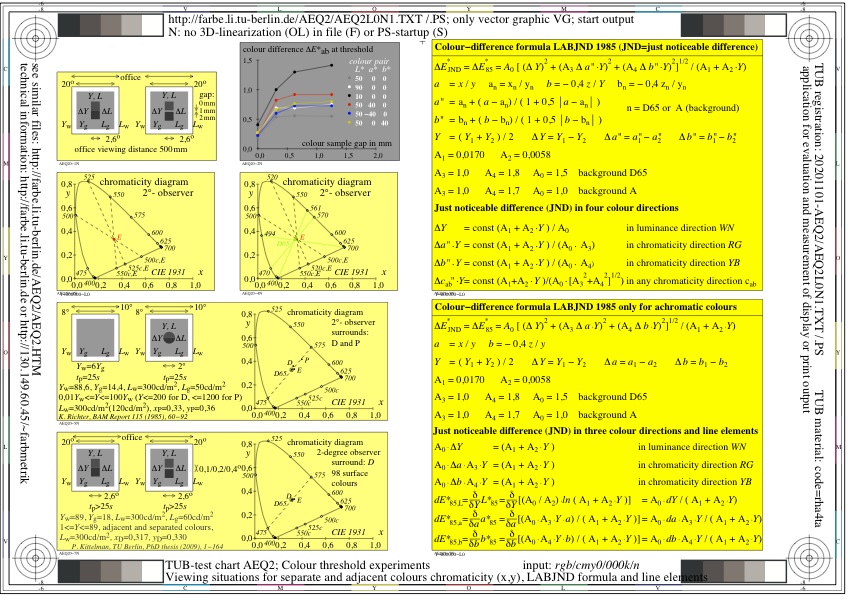
Figure AEQ2L0N1.jpg: Output in format A6 of the file
AEQ2L0NP.PDF, see
AEQ2L0N1.
PS /
TXT /
PDF /
jpg
AEQ2: TUB-Test chart AEQ2; Colour threshold experiments
viewing situations for separate and adjacent colours
chromaticity (x,y), LABJND formula and line elements
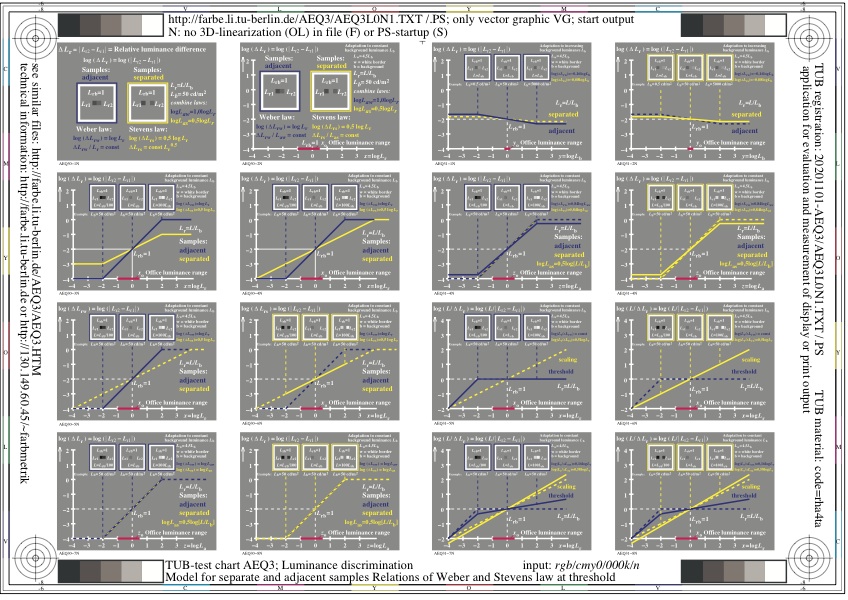
Figure AEQ3L0N1.jpg: Output in format A6 of the file
AEQ3L0NP.PDF, see
AEQ3L0N1.
PS /
TXT /
PDF /
jpg
AEQ3: TUB-Test chart AEQ3; Luminance discrimination
Model for separate and adjacent samples
Relations between Weber and Stevens law at threshold
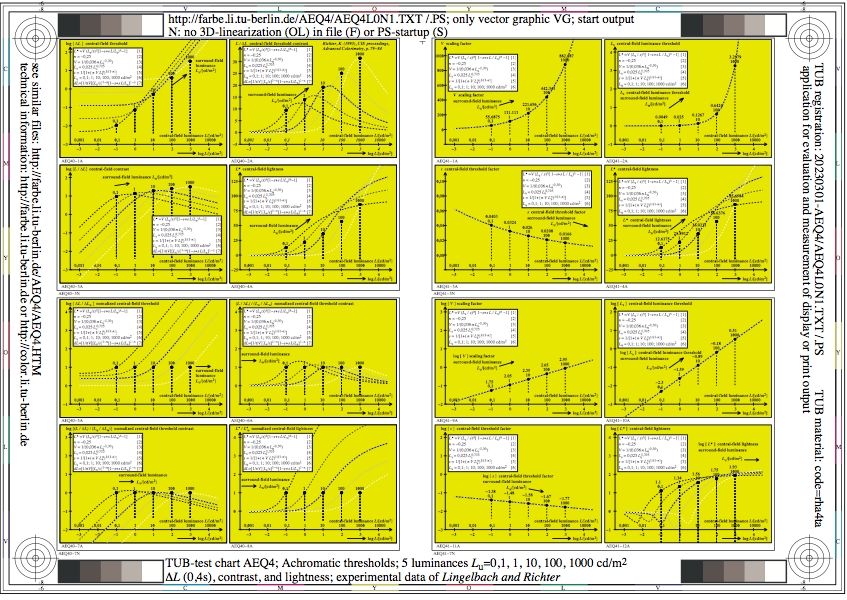
Figure AEQ4L0N1.jpg: Output in format A6 of the file
AEQ4L0NP.PDF, see
AEQ4L0N1.
PS /
TXT /
PDF /
jpg
AEQ4: TUB-test chart AEQ4; Achromatic thresholds for 5 Lu,
thresholds delta_L (0,4s), contrast and lightness;
experimental data of Lingelbach and Richter
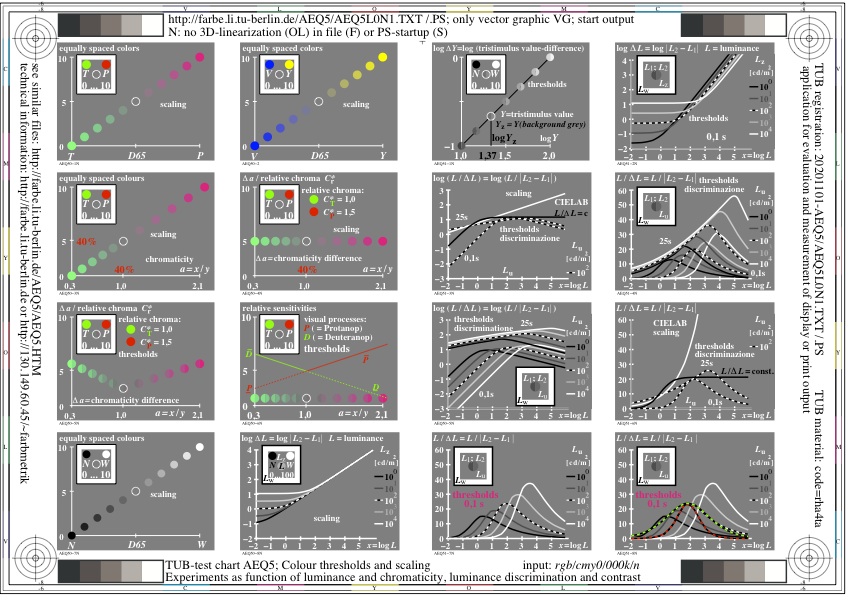
Figure AEQ5L0N1.jpg: Output in format A6 of the file
AEQ5L0NP.PDF, see
AEQ5L0N1.
PS /
TXT /
PDF /
jpg
AEQ5: TUB-test chart AEQ5; Colour thresholds and scaling
Experiments as function of luminance and chromaticity
Luminance discrimination and luminace contrasts
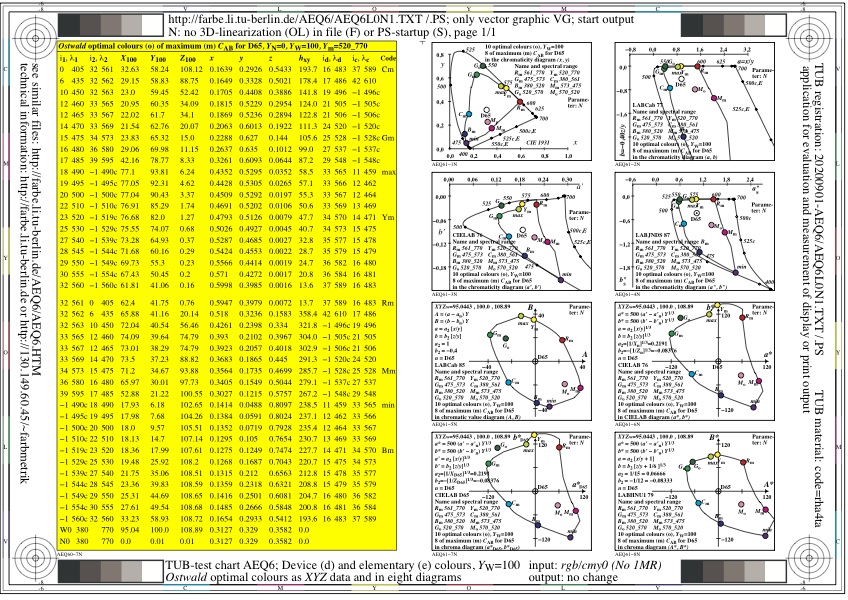
Figure AEQ6L0N1.jpg: Output in format A6 of the file
AEQ6L0NP.PDF, see
AEQ6L0N1.
PS /
TXT /
PDF /
jpg
AEQ6: TUB-test chart AEQ6; Device (d) and elementary (e) colours
Ostwald-optimal colours as XYZ data, and in chromaticity,
chroma, and chromatic value diagrams, YWa=100
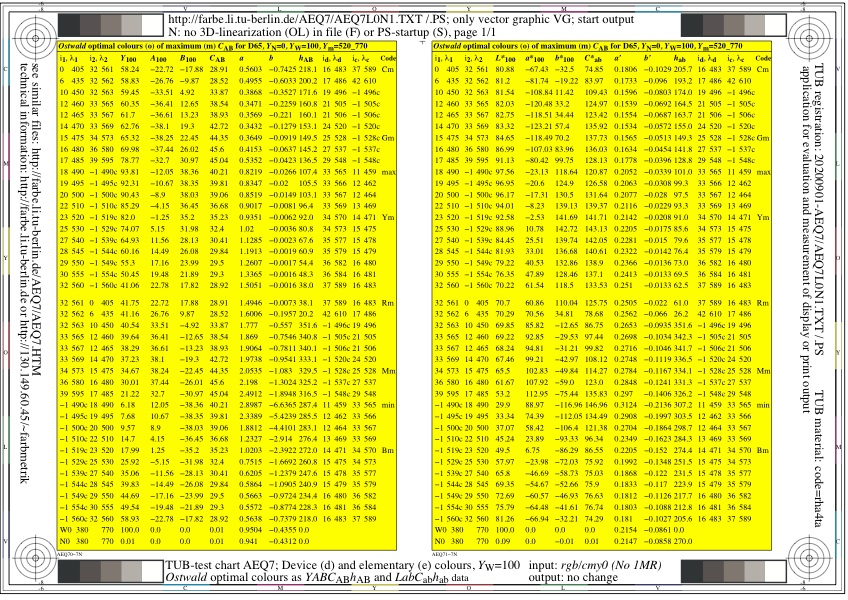
Figure AEQ7L0N1.jpg: Output in format A6 of the file
AEQ7L0NP.PDF, see
AEQ7L0N1.
PS /
TXT /
PDF /
jpg
AEQ7: TUB-test chart AEQ7; Device (d) and elementary (e) colours
Ostwald-optimal colours as YABCh(AB) data and as
LabCh*(ab) data with wavelength limits, YWa=100

Figure AEQ8L0N1.jpg: Output in format A6 of the file
AEQ8L0NP.PDF, see
AEQ8L0N1.
PS /
TXT /
PDF /
jpg
AEQ8: TUB-test chart AEQ8; Device (d) and elementary (e) colours
Ostwald-optimal colours as XYZ data, and in chromaticity,
chroma, and chromatic value diagrams, YWa=88,6

Figure AEQ9L0N1.jpg: Output in format A6 of the file
AEQ9L0NP.PDF, see
AEQ9L0N1.
PS /
TXT /
PDF /
jpg
AEQ9: TUB-test chart AEQ9; Device (d) and elementary (e) colours
Ostwald-optimal colours as YABCh(AB) data and as
LabCh*(ab) data with wavelength limits, YWa=88,6
-------
For the archive information (2000-2009) of the BAM server "www.ps.bam.de"
(2000-2018)
about colour test charts, colorimetric calculations,
standards, and publications, see
indexAE.html in English,
indexAG.html in German.
Back to the main page of this TUB web site (NOT archive), see
index.html in English,
indexDE.html in German.