Figure eea0l0n1.jpg: Output in format A6 of the file eea0l0np.pdf, see
eea0l0n1. ps / txt / pdf / jpg
241201 1L2L0X0E_K2710.KTS/YEalEIN.KTS, http://farbe.li.tu-berlin.de/eeas.htm or http://color.li.tu-berlin.de/eeas.htm
For links to the
Section 2, Chapter E
Colour Metrics, Differences, and Appearance (2023),
see
For this image page with 10 colour series, see
eeas in English,
egas in German.
For the previous image page, see
eezs in English,
egzs in German.
For the next image page, see
eebs in English,
egbs in German.
For the first image page of the previous chapter D, see
DEAS in English,
DGAS in German.
For the first image page of the next chapter F, see
feas in English,
fgas in German.
Content list of chapter E:
eea_i in English or
ega_i in German.
Summary of chapter E:
eea_s in English or
ega_s in German.
For the large image page of chapter E with 260 colour series, see
ee2s in English or
eg2s in German.
Section 2, Chapter E
Colour Metrics, Differences, and Appearance (2023),
Image part eeas
The following ten pages eea0 to eea9 of this chapter
show the content with links to the single figures
in up to six formats.
Figure eea0l0n1.jpg: Output in format A6 of the file
eea0l0np.pdf, see
eea0l0n1.
ps /
txt /
pdf /
jpg
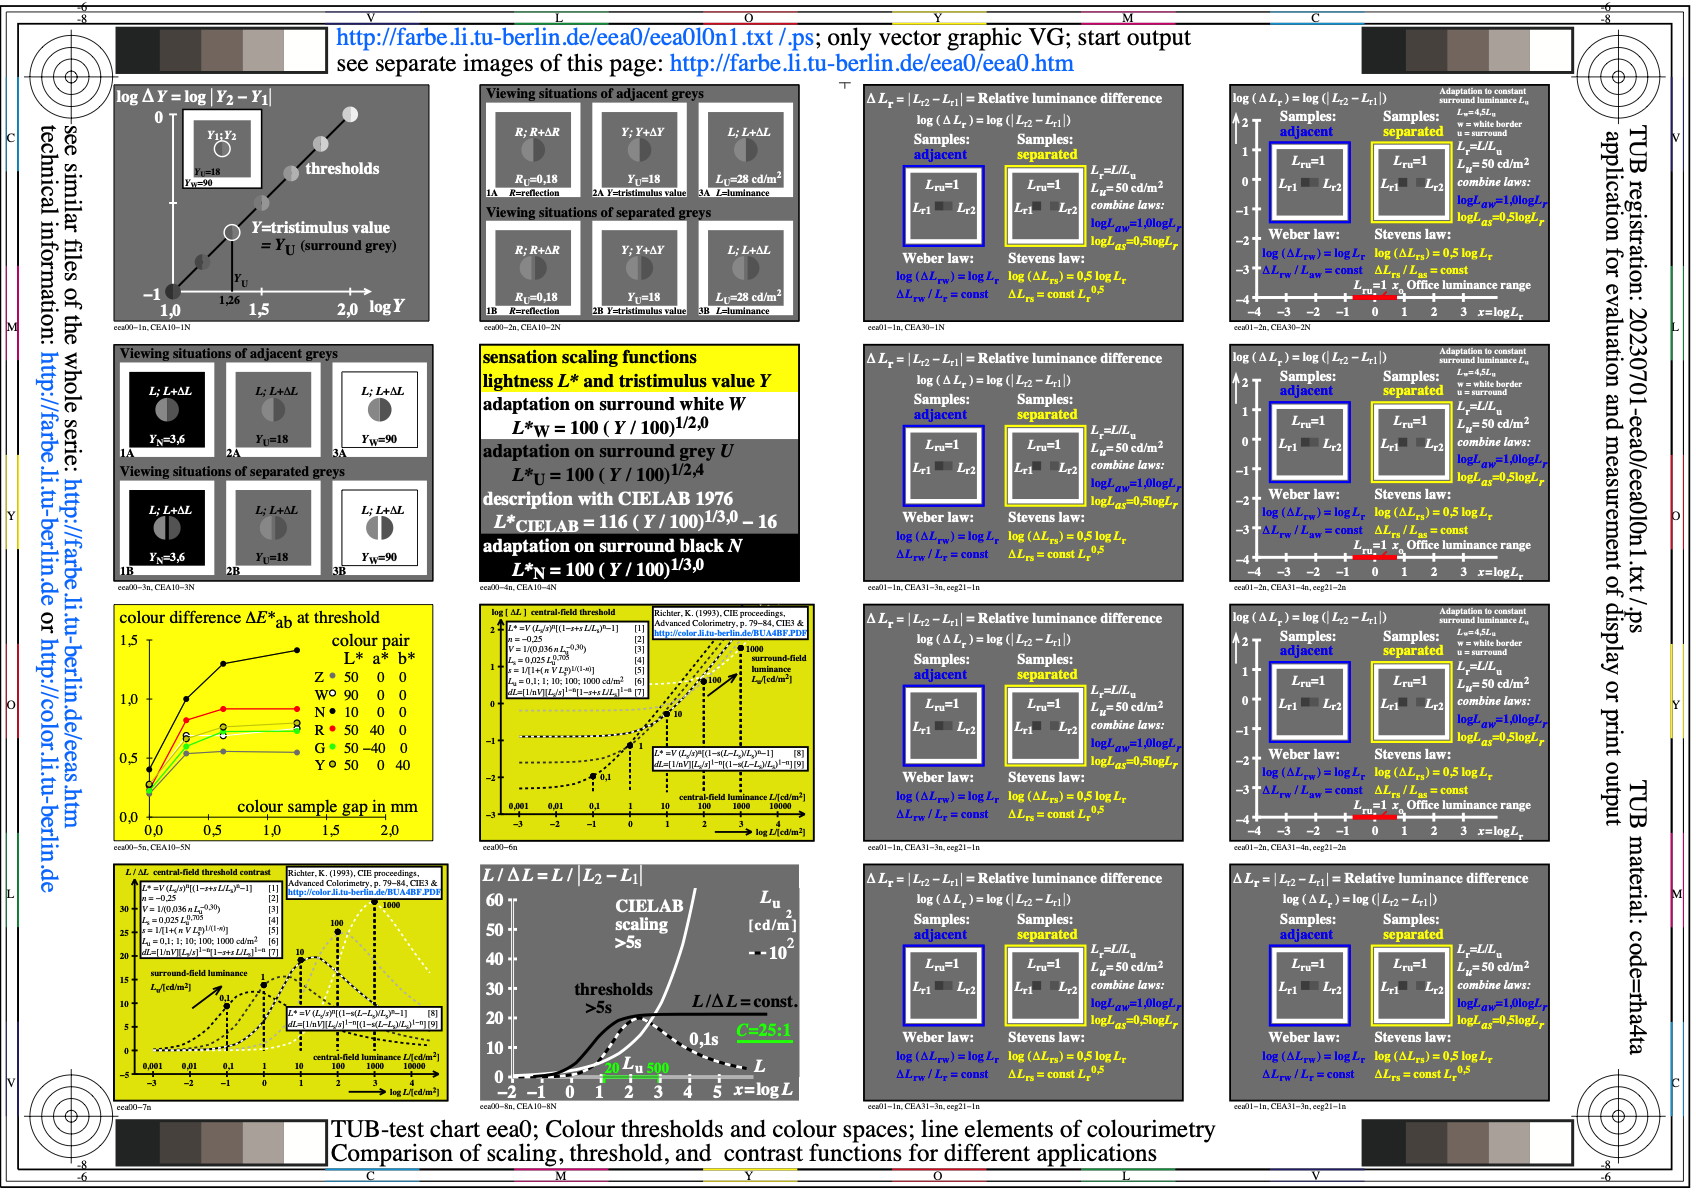
eea0: TUB-test chart eea0; Line elements of higher colorimetry
CIELAB, LABJND, TUBJND, CIEDE200, see CIE 230:2019
Relative lightness L*/L*u as bais for the grey scaling
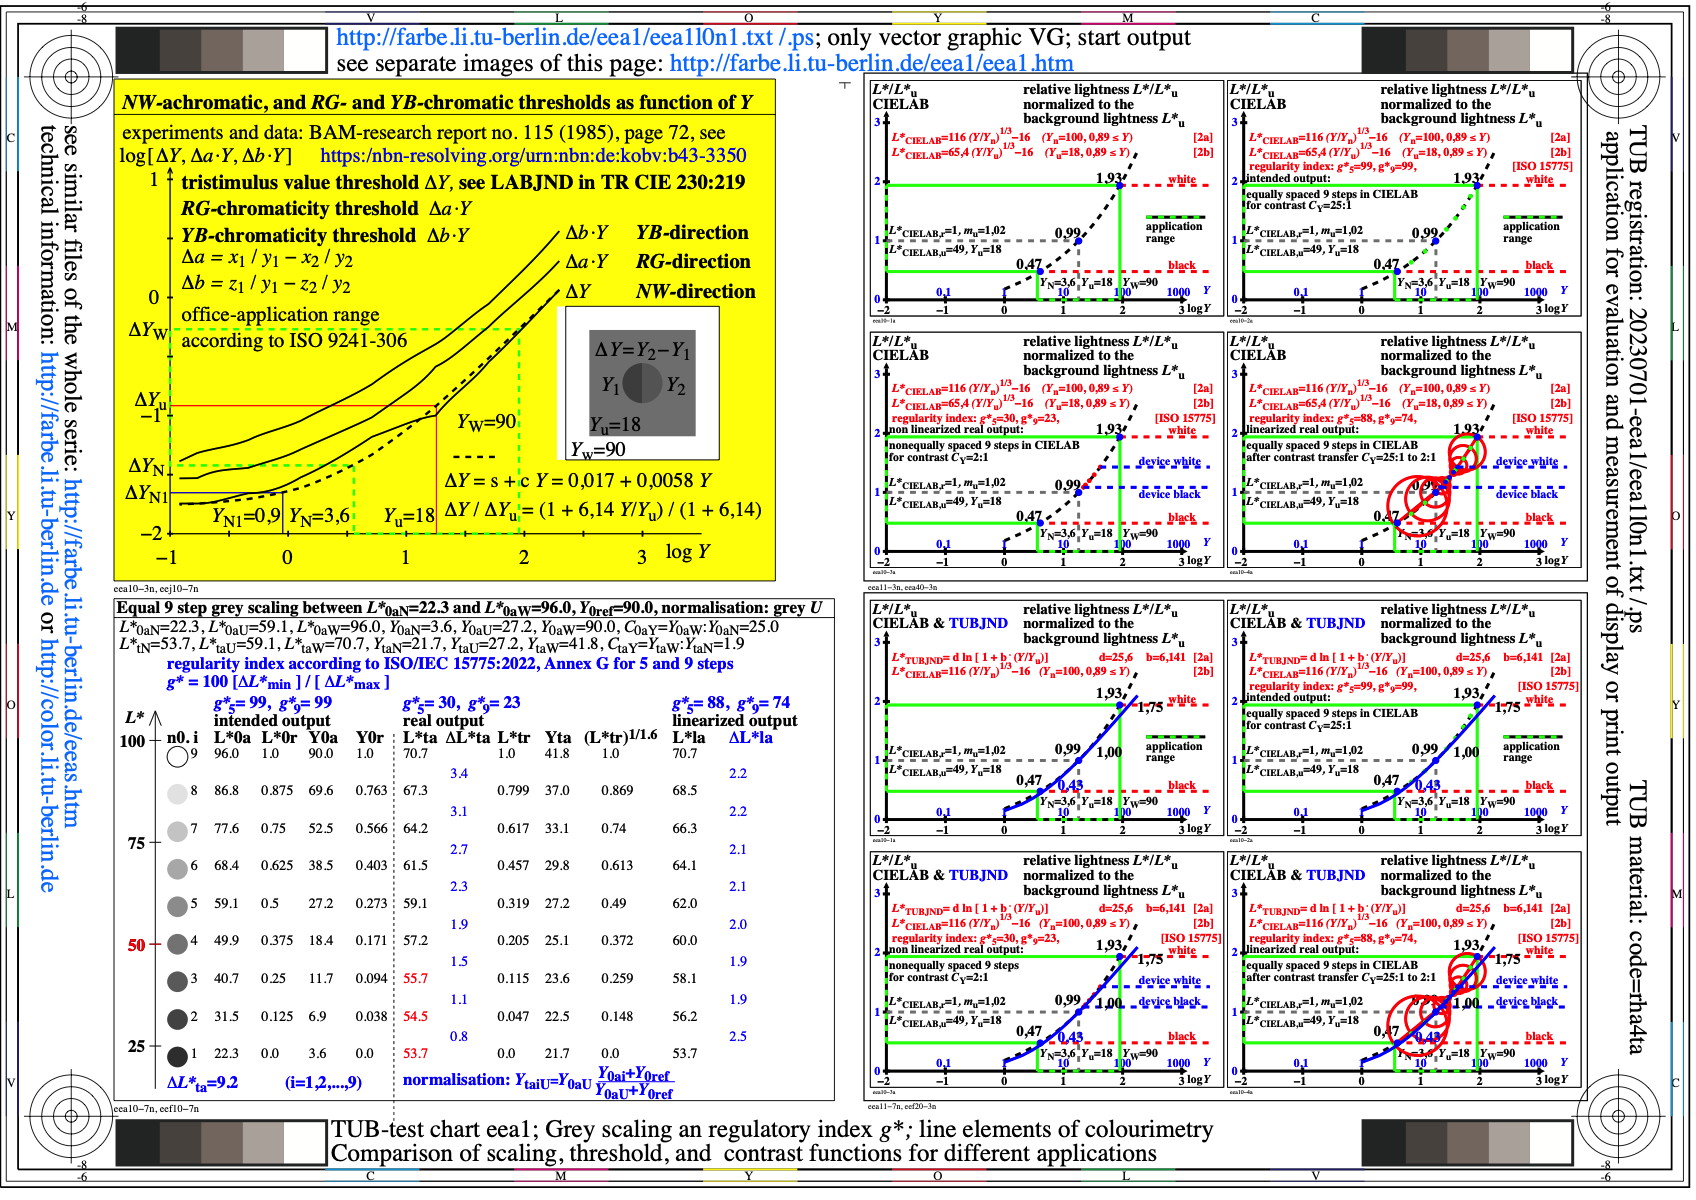
Figure eea1l0n1.jpg: Output in format A6 of the file
eea1l0np.pdf, see
eea1l0n1.
ps /
txt /
pdf /
jpg
eea1: TUB-test chart eea1; Line elements of higher colorimetry
CIELAB, LABJND, TUBJND, CIEDE2000 and others
Regularity index according to ISO/IEC 15775 for the grey scaling
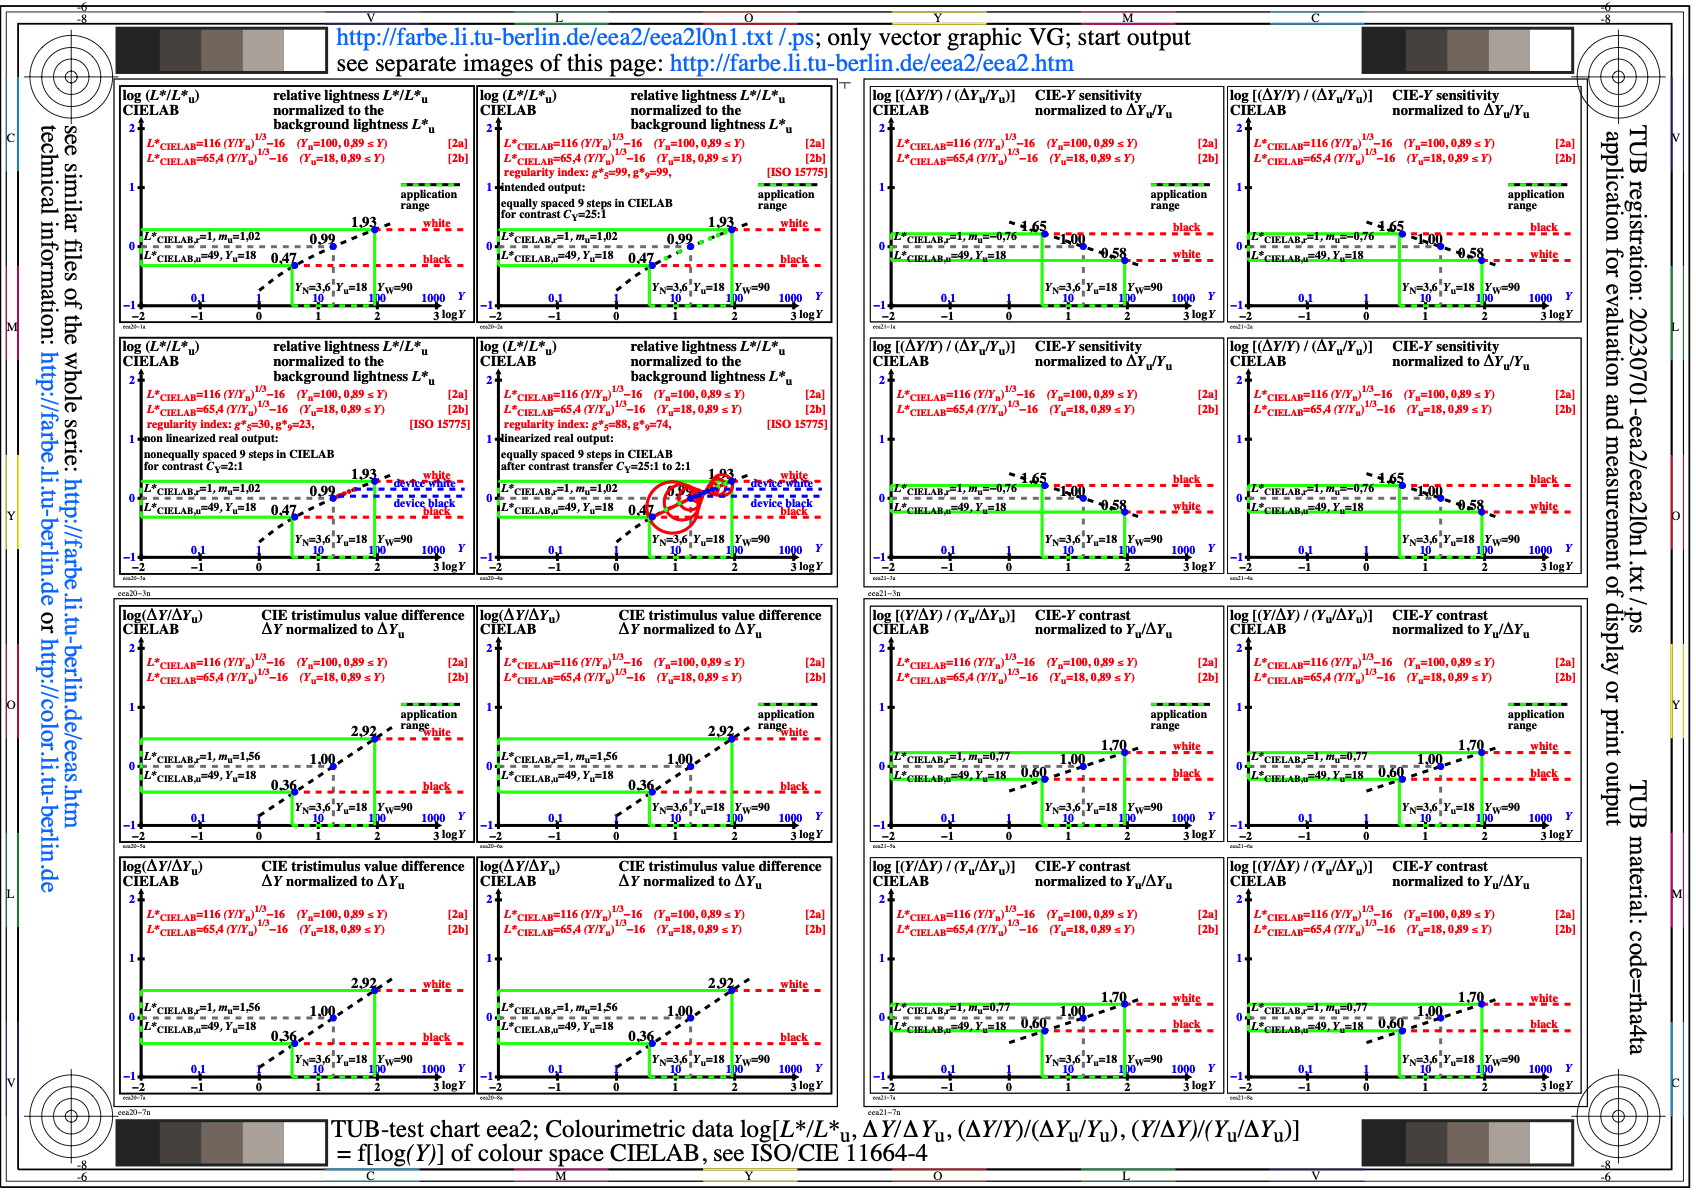
Figure eea2l0n1.jpg: Output in format A6 of the file
eea2l0np.pdf, see
eea2l0n1.
ps /
txt /
pdf /
jpg
eea2: TUB-test chart eea2; Colourimetric data
log[L*/L*u, dY/dYu, (dY/Y)/(dYu/Yu), (Y/dY)/(Yu/dYu)]
= f[log(Y)] of the colour spaces CIELAB & TUBJND, see CIE 230
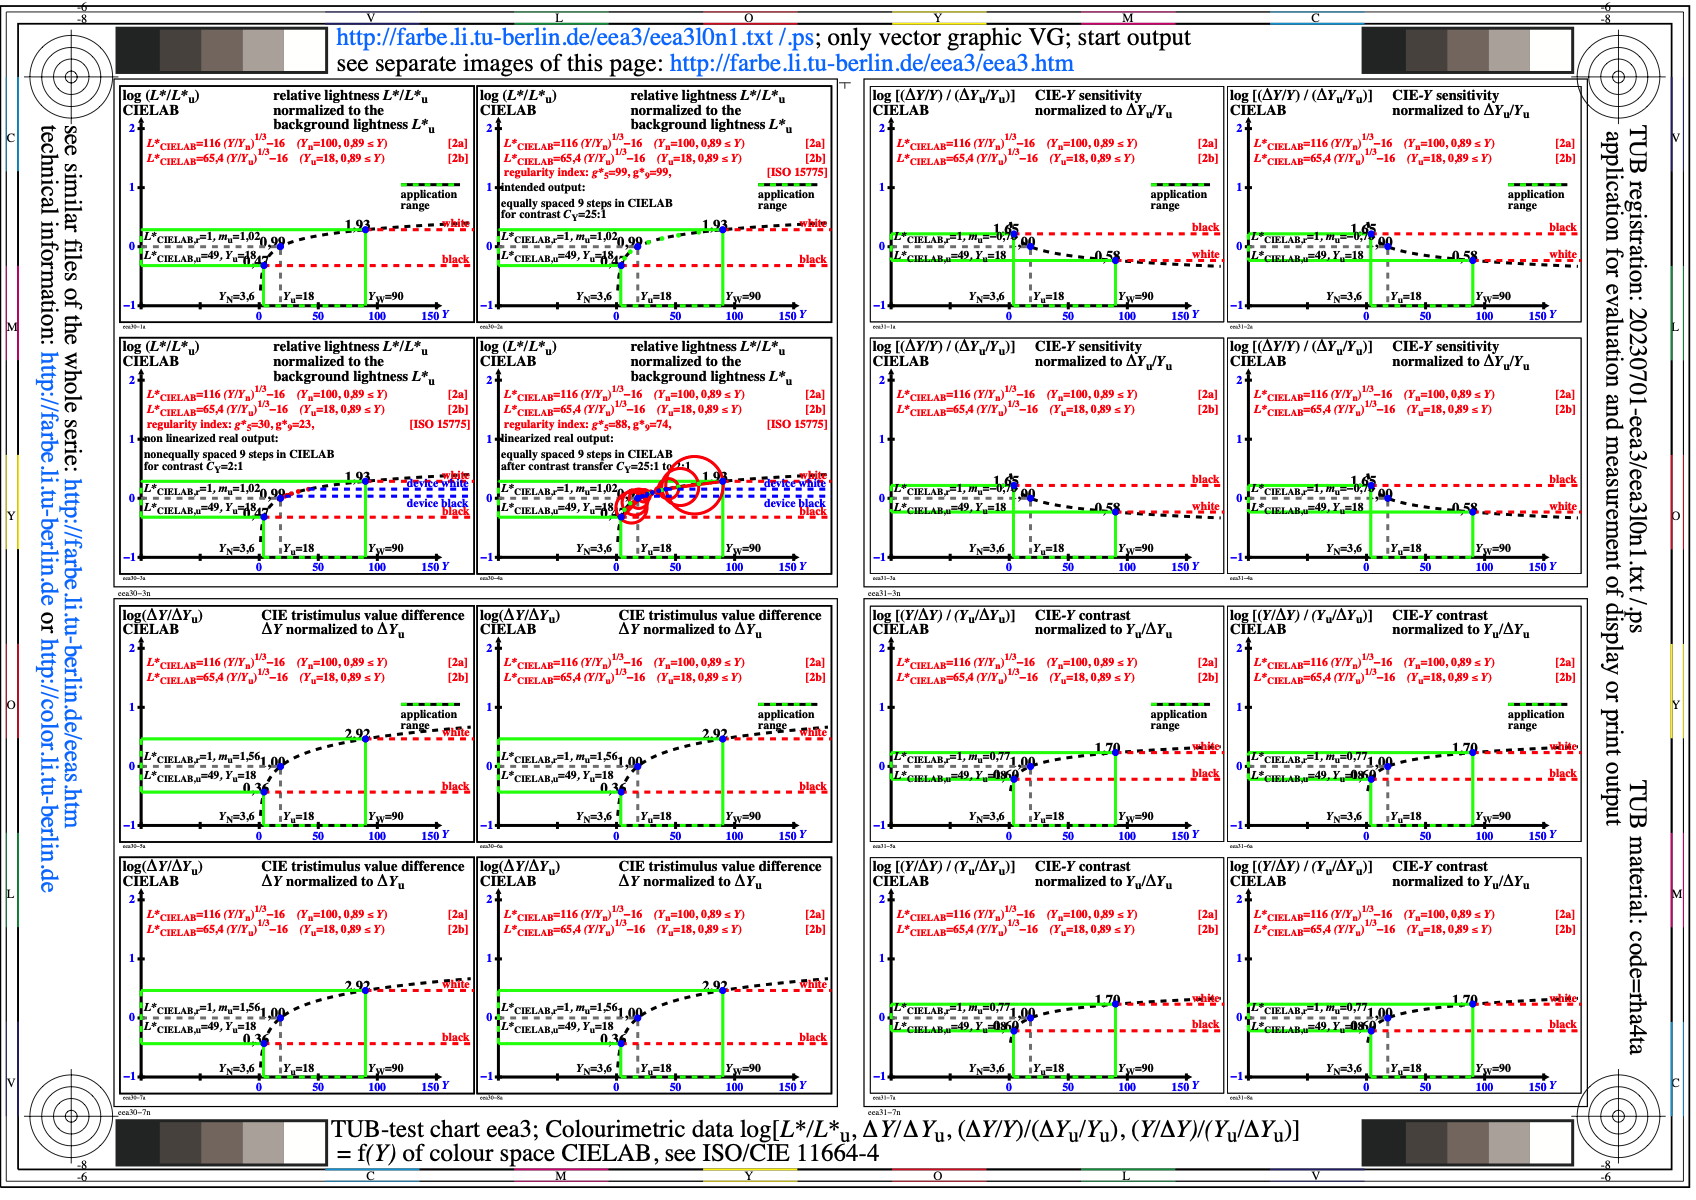
Figure eea3l0n1.jpg: Output in format A6 of the file
eea3l0np.pdf, see
eea3l0n1.
ps /
txt /
pdf /
jpg
eea3: TUB-test chart eea3; Colourimetric data
log[L*/L*u, dY/dYu, (dY/Y)/(dYu/Yu), (Y/dY)/(Yu/dYu)]
= f(Y) of the colour spaces CIELAB & TUBJND, see CIE 230
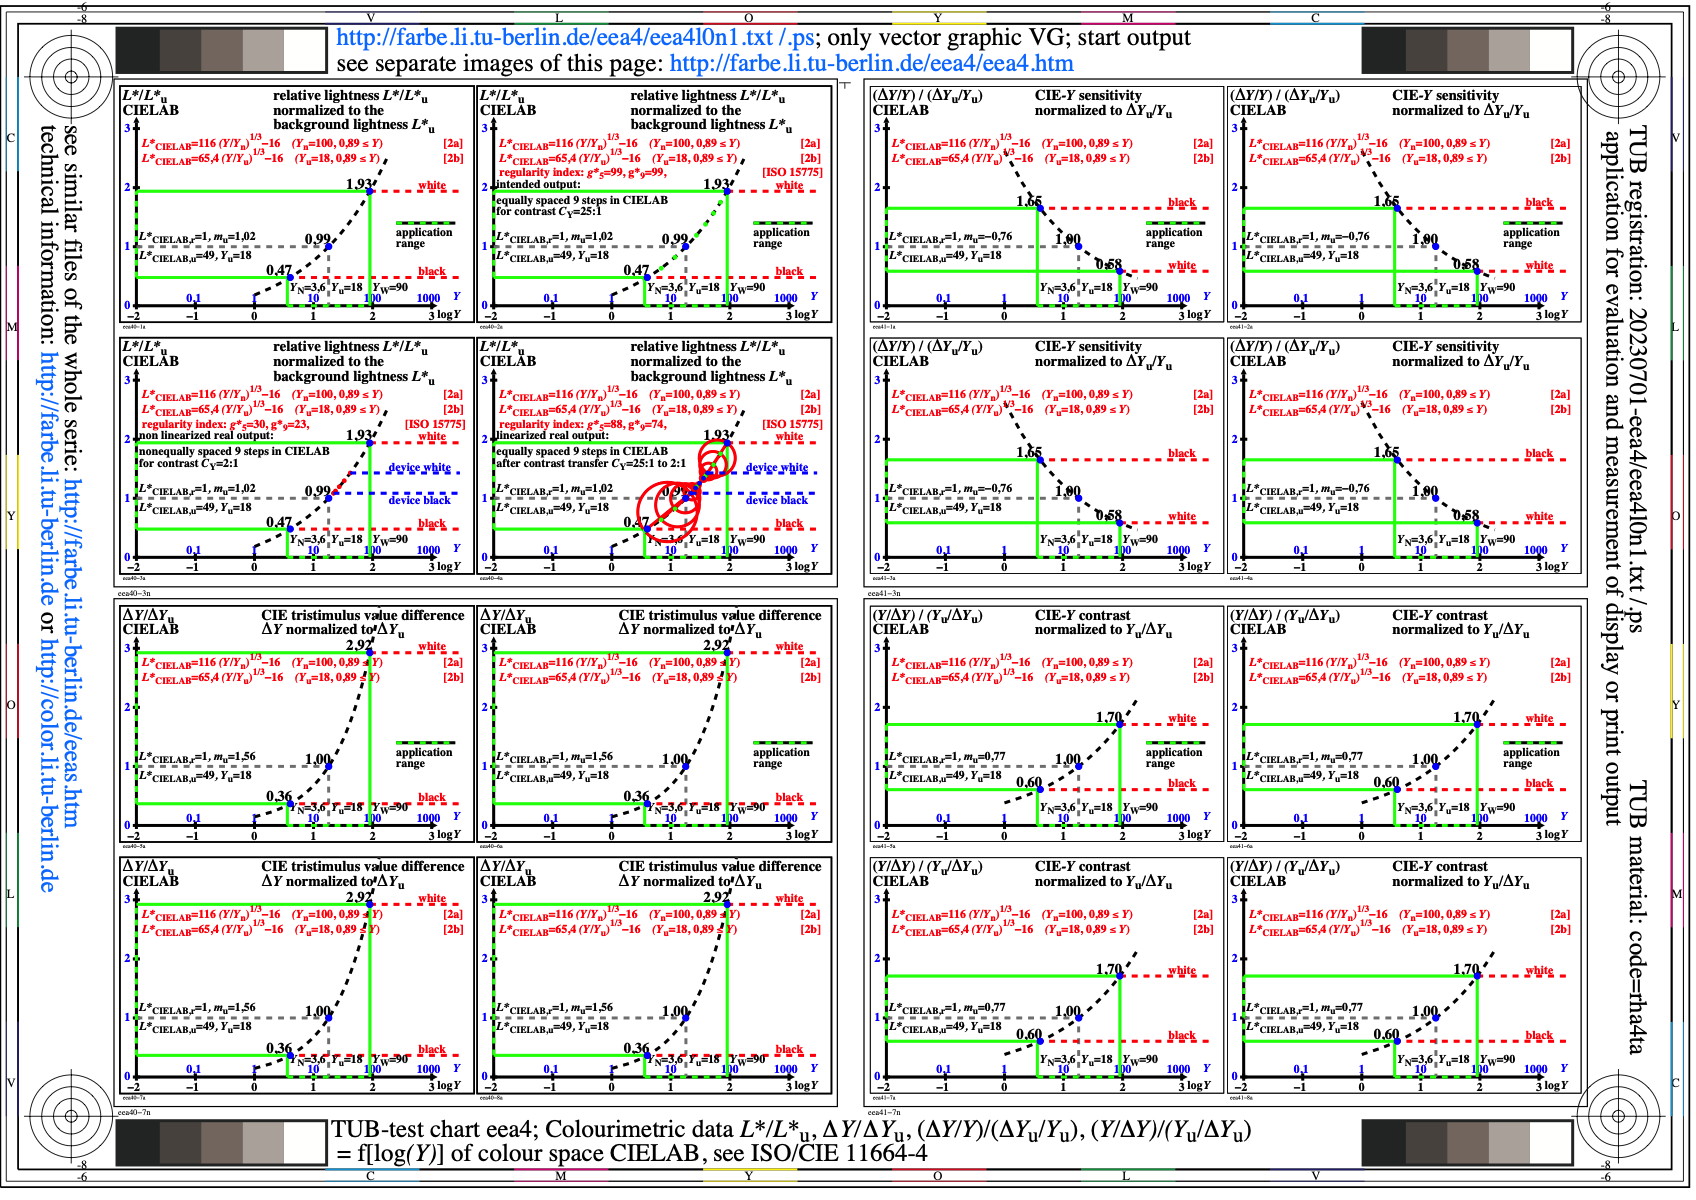
Figure eea4l0n1.jpg: Output in format A6 of the file
eea4l0np.pdf, see
eea4l0n1.
ps /
txt /
pdf /
jpg
eea4: TUB-test chart eea4; Colourimetric data
L*/L*u, dY/dYu, (dY/Y)/(dYu/Yu), (Y/dY)/(Yu/dYu)
= f[log(Y)] of the colour spaces CIELAB & TUBJND, see CIE 230
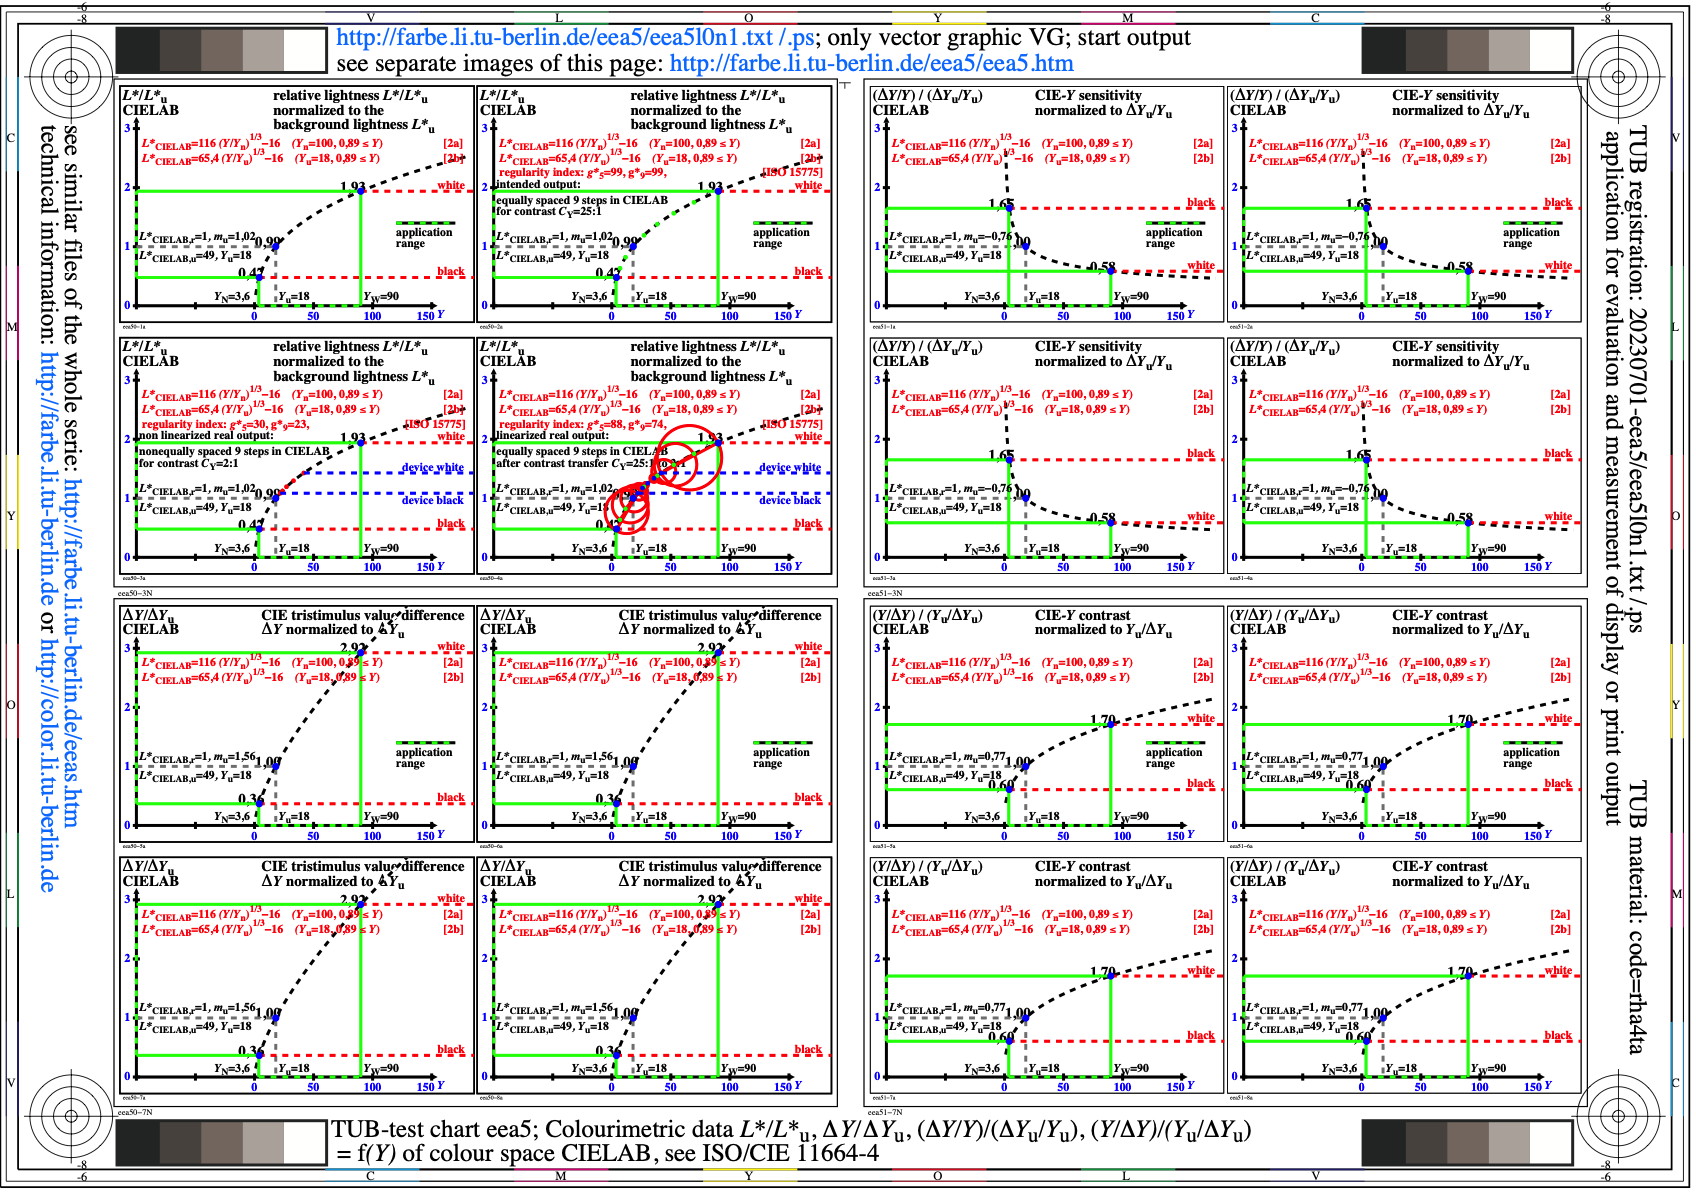
Figure eea5l0n1.jpg: Output in format A6 of the file
eea5l0np.pdf, see
eea5l0n1.
ps /
txt /
pdf /
jpg
eea5: TUB-test chart eea5; Colourimetric data
L*/L*u, dY/dYu, (dY/Y)/(dYu/Yu), (Y/dY)/(Yu/dYu)
= f(Y) of the colour spaces CIELAB & TUBJND, see CIE 230
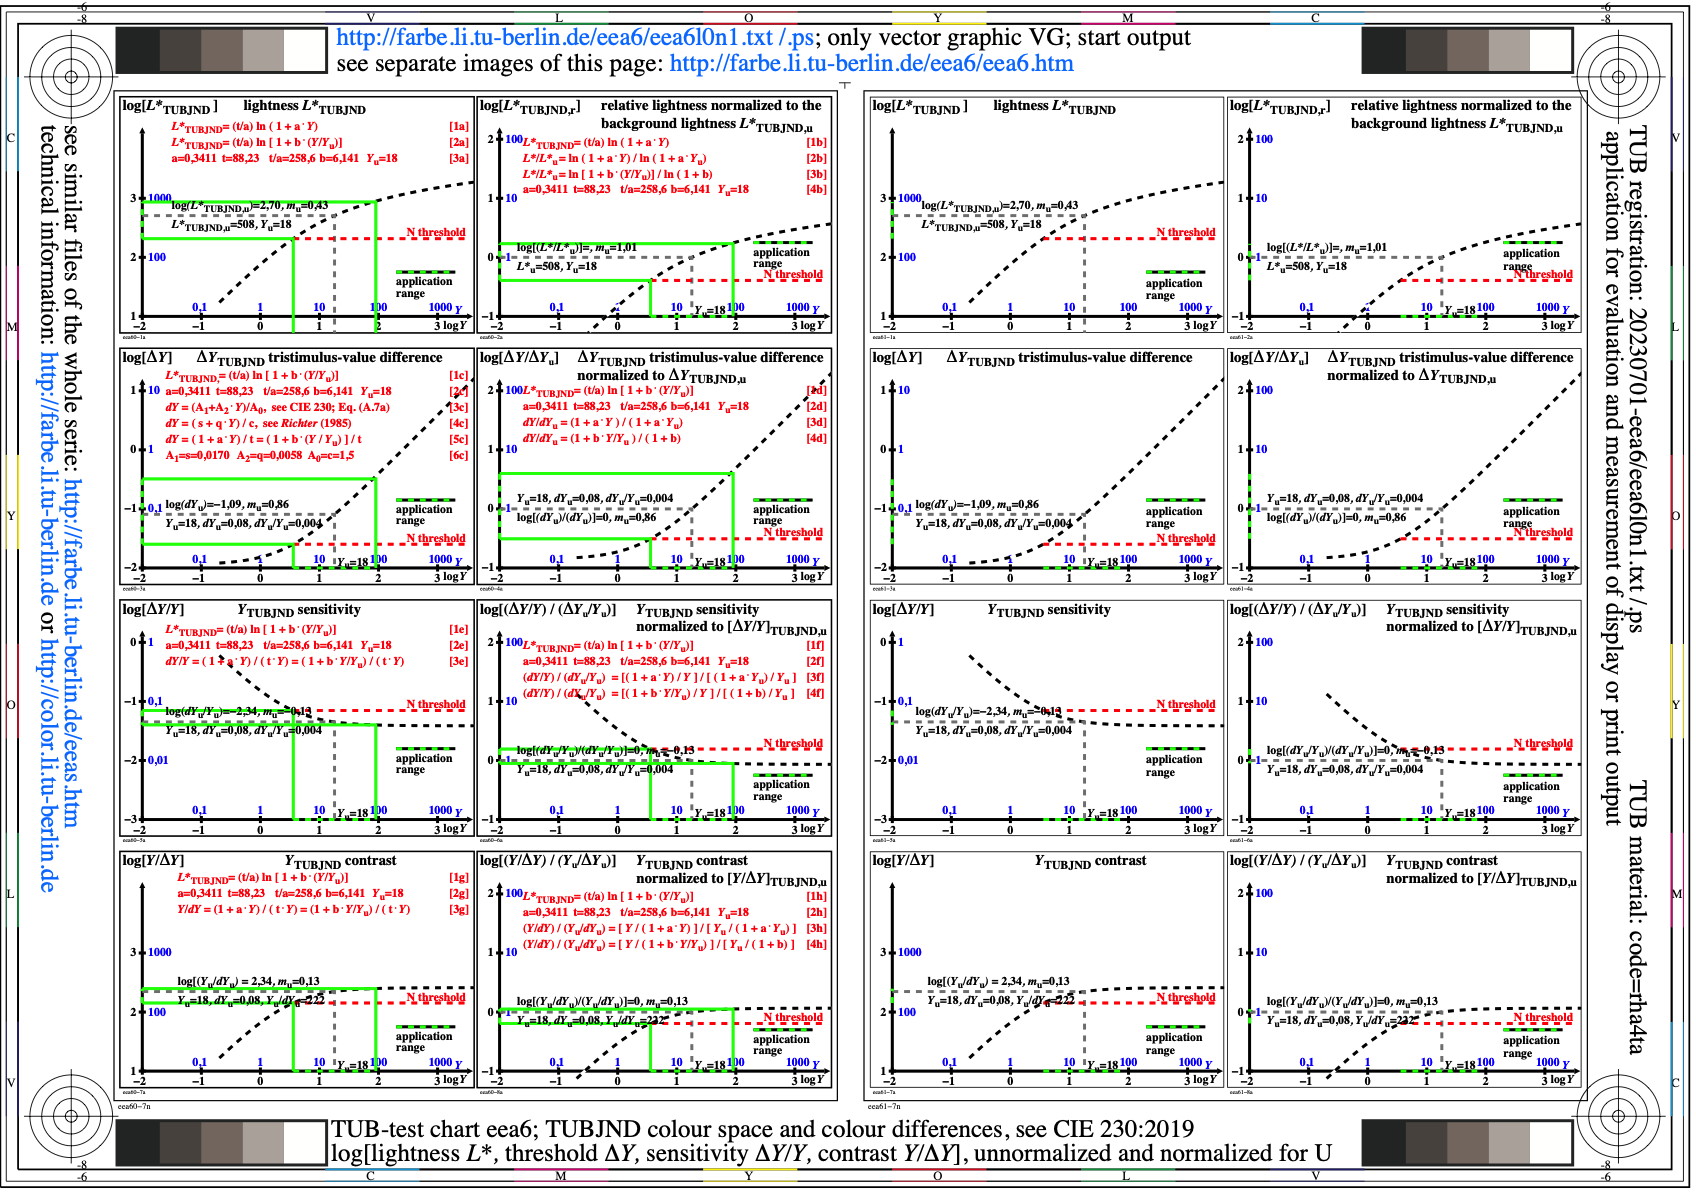
Figure eea6l0n1.jpg: Output in format A6 of the file
eea6l0np.pdf, see
eea6l0n1.
ps /
txt /
pdf /
jpg
eea6: TUB-test chart eea6; TUBJND-colour space & differences
log[lightness L*, threshold delta Y, sensitivity
(delta Y)/Y & contrast Y/(delta Y)]=f[log(Y)]

Figure eea7l0n1.jpg: Output in format A6 of the file
eea7l0np.pdf, see
eea7l0n1.
ps /
txt /
pdf /
jpg
eea7: TUB-test chart eea7; CIELAB-colour space & differences
log[lightness L*, threshold delta Y, sensitivity
(delta Y)/Y & contrast Y/(delta Y)]=f[log(Y)]
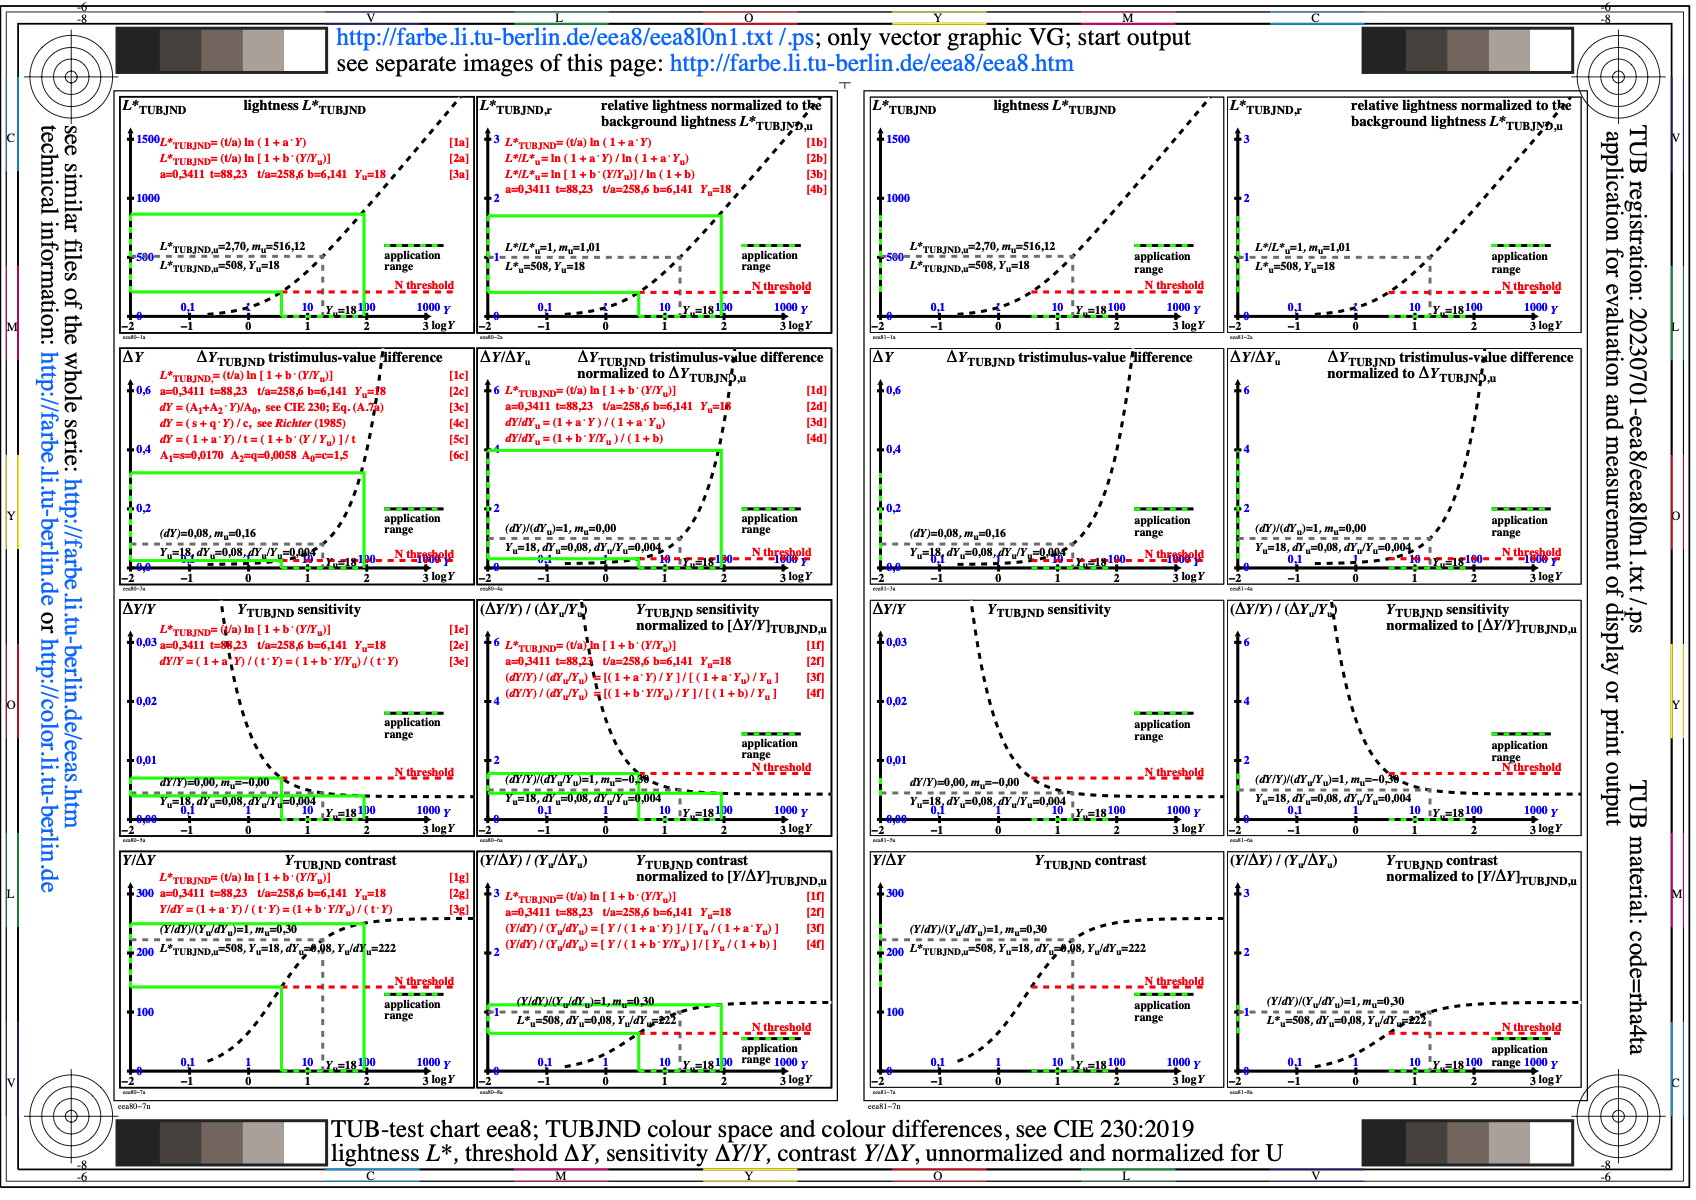
Figure eea8l0n1.jpg: Output in format A6 of the file
eea8l0np.pdf, see
eea8l0n1.
ps /
txt /
pdf /
jpg
eea8: TUB-test chart eea8; TUBJND-colour space & differences
lightness L*, threshold delta Y, sensitivity
(delta Y)/Y & contrast Y/(delta Y)=f[log(Y)]
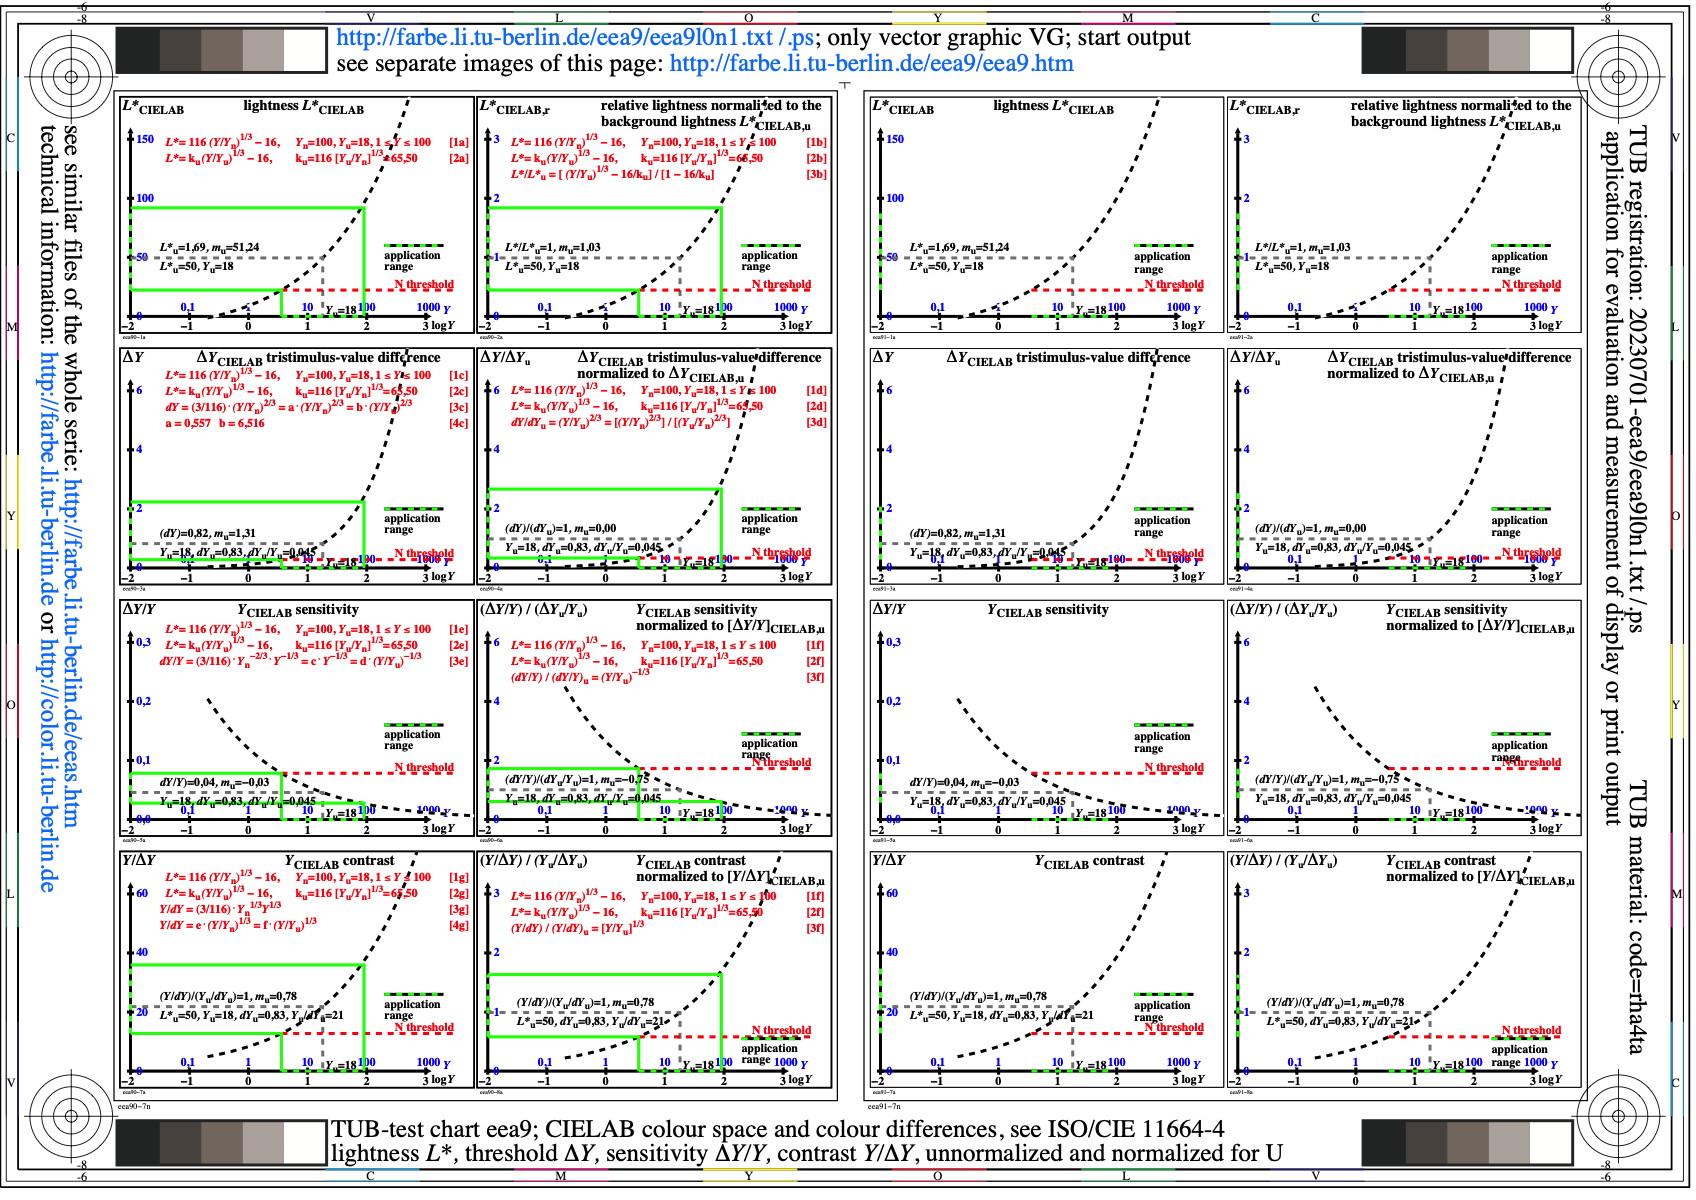
Figure eea9l0n1.jpg: Output in format A6 of the file
eea9l0np.pdf, see
eea9l0n1.
ps /
txt /
pdf /
jpg
eea9: TUB-test chart eea9; CIELAB-colour space & differences
lightness L*, threshold delta Y, sensitivity
(delta Y)/Y & contrast Y/(delta Y)=f[log(Y)]
-------
For the archive information (2000-2009) of the BAM server "www.ps.bam.de"
(2000-2018)
about colour test charts, colorimetric calculations,
standards, and publications, see
indexAE.html in English,
indexAG.html in German.
Back to the main page of this TUB web site (NOT archive), see
index.html in English,
indexDE.html in German.