Figure fea0l0n1.jpg: Output in format A6 of the file fea0l0np.pdf, see
fea0l0n1. ps / txt / pdf / jpg
240215 1L2L0X0F_K2710.KTS/YEalFIN.KTS http://farbe.li.tu-berlin.de/feas.htm or http://color.li.tu-berlin.de/feas.htm
For links to the
Section 2, Chapter F
Colour Metrics for chromatic and luminance adaptation (2024),
see
For this image page with 10 colour series, see
feas in English,
fgas in German.
For the previous image page, see
fezs in English,
fgzs in German.
For the next image page, see
febs in English,
fgbs in German.
For the first image page of the previous chapter E, see
eeas in English,
egas in German.
For the first image page of the next chapter G (under work), see
geas in English,
ggas in German.
Content list of chapter F:
fea_i in English or
fga_i in German.
Summary of chapter F:
fea_s in English or
fga_s in German.
For the large image page of chapter F with 260 colour series, see
fe2s in English or
fg2s in German.
Section 2, Chapter F
Colour metrics for chromatic and luminance adaptation (2024),
Image part feas
The following ten pages fea0 to fea9 of this chapter
show the content with links to the single figures
in up to six formats.
Figure fea0l0n1.jpg: Output in format A6 of the file
fea0l0np.pdf, see
fea0l0n1.
ps /
txt /
pdf /
jpg
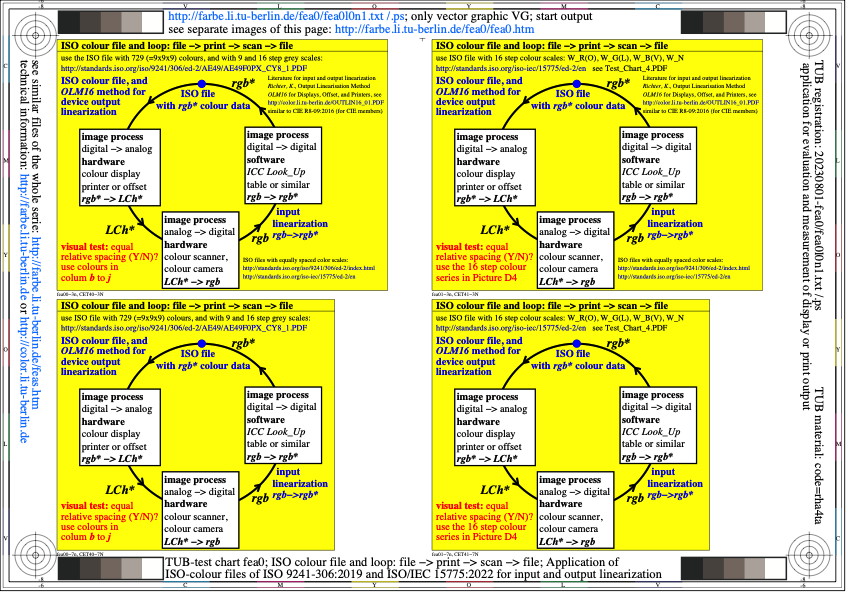
fea0: TUB-test chart fea0; ISO-colour file and colour loop:
ISO file -> print -> scan -> ISO file; application of
ISO 9241-306 & ISO/IEC 15775: input and output linearization
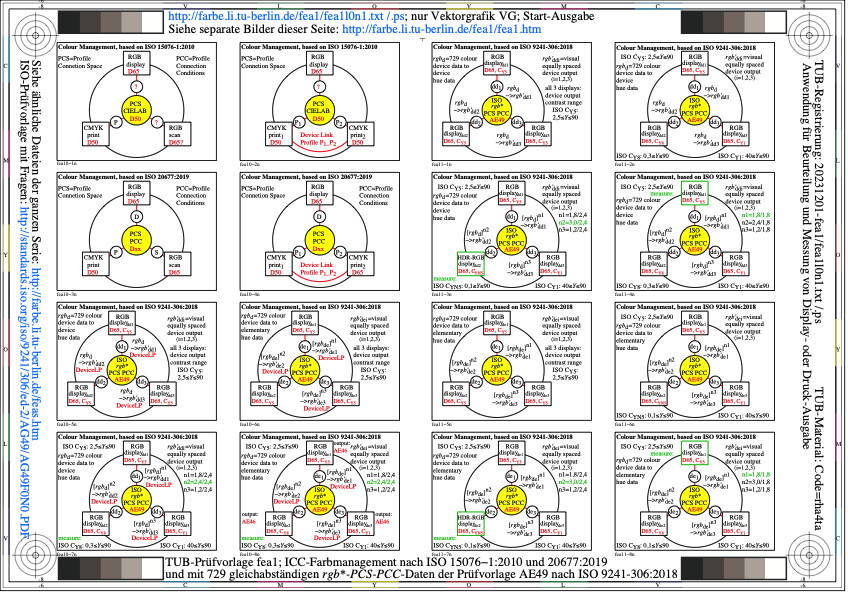
Figure fea1l0n1.jpg: Output in format A6 of the file
fea1l0np.pdf, see
fea1l0n1.
ps /
txt /
pdf /
jpg
fea1: TUB-test chart fea1; Colour management according to ISO 15076-1
:2010, ISO 20677:2018, and with 729(=9x9=9) equally spaced
rgb*-PCS-PCC data according to ISO 9241-306:2018
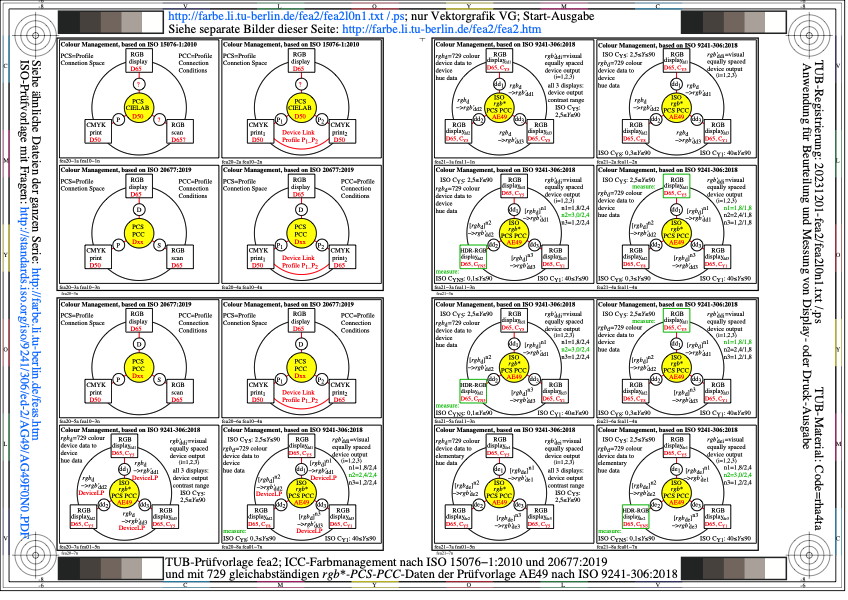
Figure fea2l0n1.jpg: Output in format A6 of the file
fea2l0np.pdf, see
fea2l0n1.
ps /
txt /
pdf /
jpg
fea2: TUB-test chart fea2; Colour management according to ISO 15076-1
:2010, ISO 20677:2018, and with 729(=9x9=9) equally spaced
rgb*-PCS-PCC data according to ISO 9241-306:2018
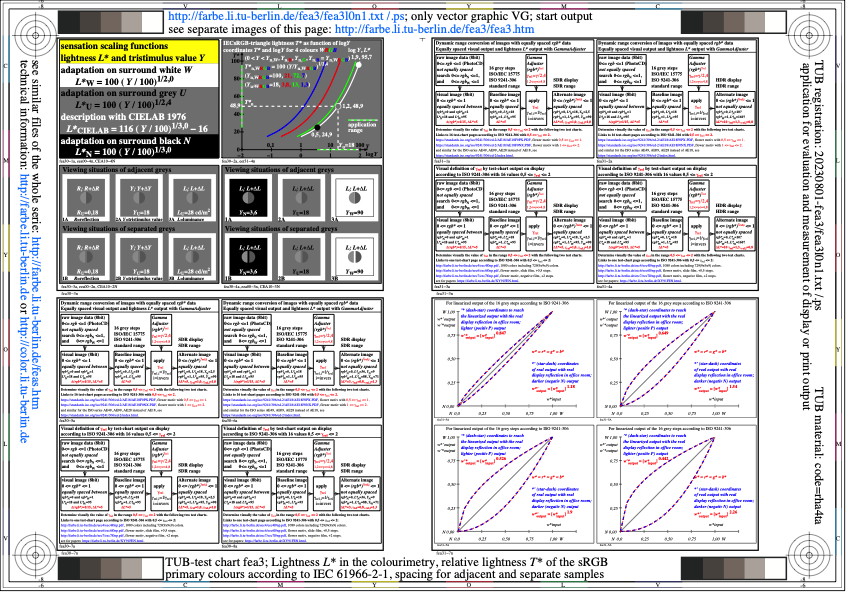
Figure fea3l0n1.jpg: Output in format A6 of the file
fea3l0np.pdf, see
fea3l0n1.
ps /
txt /
pdf /
jpg
fea3: TUB-test chart fea3; Lightness L* in colourimetry
Relative lightness T* of the sRGB primary colours
Spacing for adjacent and separate colours
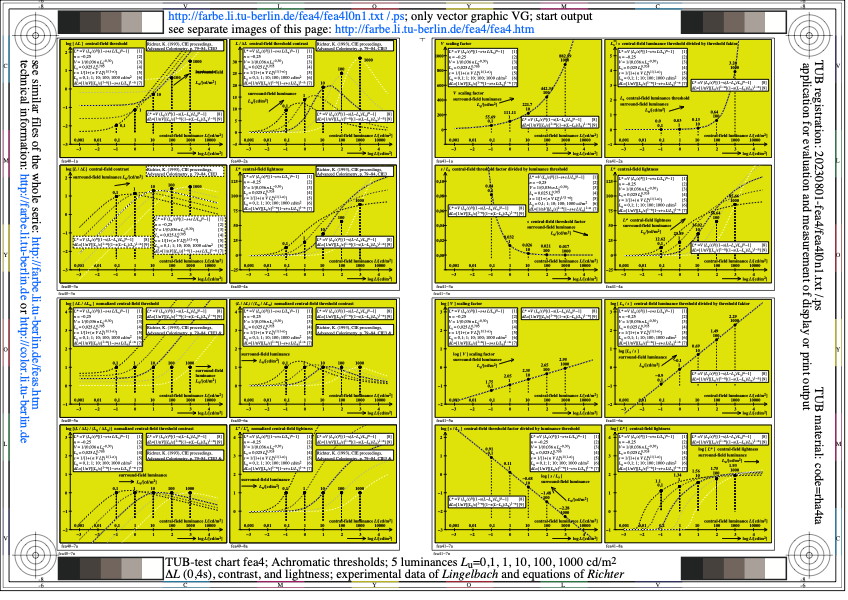
Figure fea4l0n1.jpg: Output in format A6 of the file
fea4l0np.pdf, see
fea4l0n1.
ps /
txt /
pdf /
jpg
fea4: TUB-test chart fea4; Achromatic thresholds, 5 Lu on Y
thresholds delta_L (0,4s), contrast and lightness; experi-
mental data of Lingelbach and Richter without adaptation
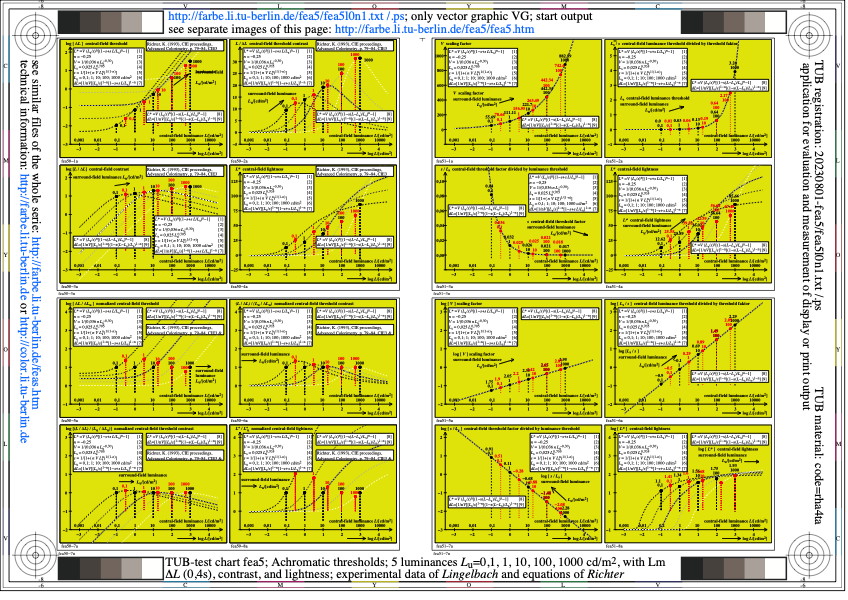
Figure fea5l0n1.jpg: Output in format A6 of the file
fea5l0np.pdf, see
fea5l0n1.
ps /
txt /
pdf /
jpg
fea5: TUB-test chart fea5; Achromatic thresholds, 5 Lu & Lm on Y
thresholds delta_L (0,4s), contrast and lightness; experi-
mental data of Lingelbach and Richter with adaptation
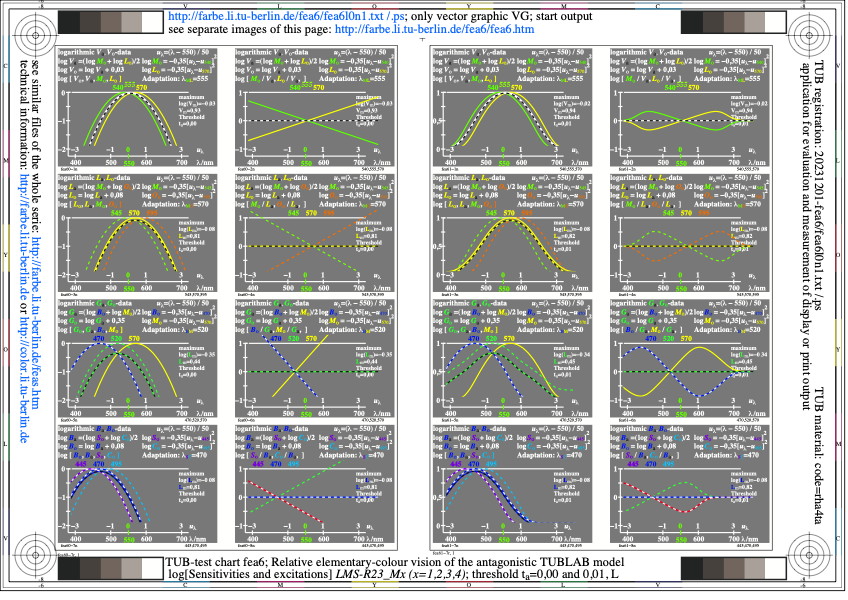
Figure fea6l0n1.jpg: Output in format A6 of the file
fea6l0np.pdf, see
fea6l0n1.
ps /
txt /
pdf /
jpg
fea6: TUB-test chart fea6; Relative elementary colour vision
of the antagonistic TUBLAB model, threshold ts=0,00&0,01
log[sensitivity and responses], O/L & M/L
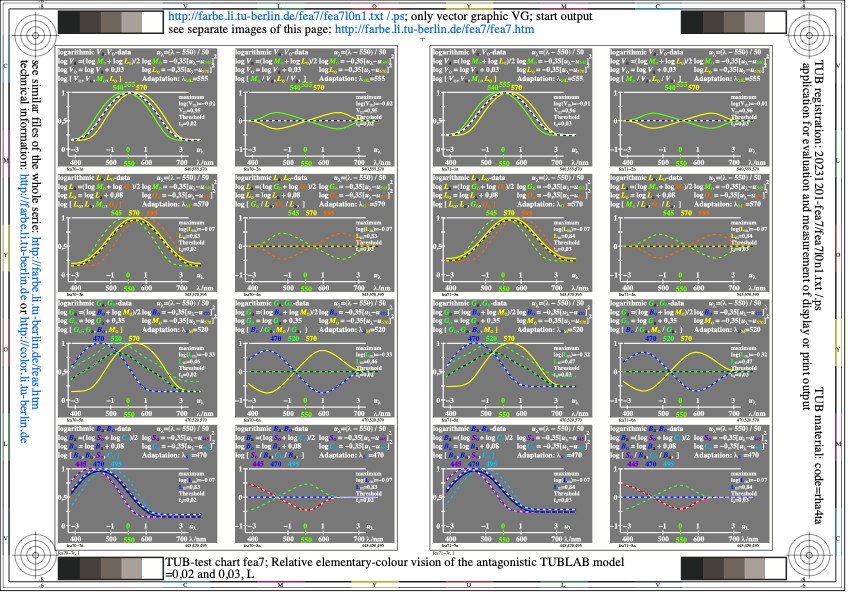
Figure fea7l0n1.jpg: Output in format A6 of the file
fea7l0np.pdf, see
fea7l0n1.
ps /
txt /
pdf /
jpg
fea7: TUB-test chart fea7; Relative elementary colour vision
of the antagonistic TUBLAB model, threshold ts=0,02&0,03
log[sensitivity and responses], O/L & M/L

Figure fea8l0n1.jpg: Output in format A6 of the file
fea8l0np.pdf, see
fea8l0n1.
ps /
txt /
pdf /
jpg
fea8: TUB-test chart fea8; Relative elementary colour vision
of the antagonistic TUBLAB model, threshold ts=0,00&0,01
log[sensitivity and responses], O/V & M/V
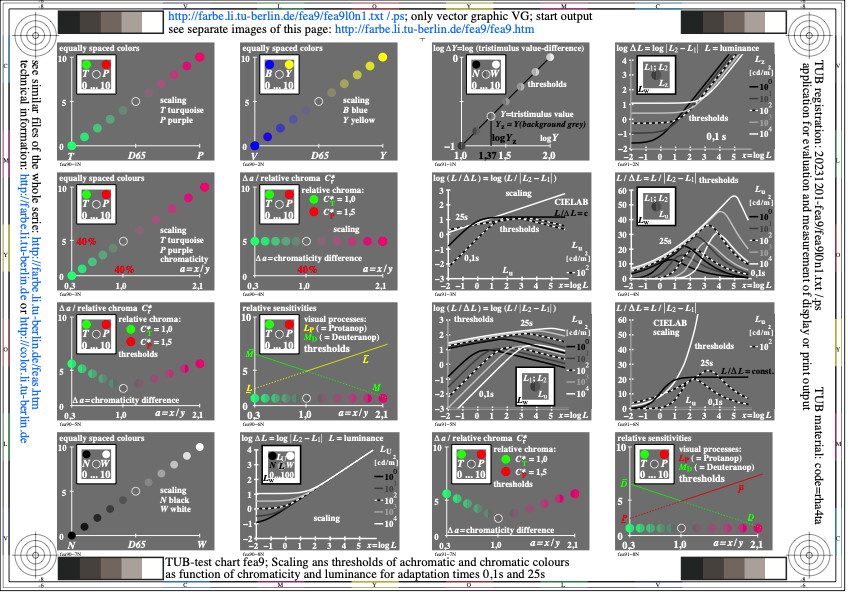
Figure fea9l0n1.jpg: Output in format A6 of the file
fea9l0np.pdf, see
fea9l0n1.
ps /
txt /
pdf /
jpg
fea9: TUB-test chart fea9; Scaling and thresholds of achromatic
and chromatic colours as function of chromaticity
and luminance for adaptation times 0,1s and 25s
-------
For the archive information (2000-2009) of the BAM server "www.ps.bam.de"
(2000-2018)
about colour test charts, colorimetric calculations,
standards, and publications, see
indexAE.html in English,
indexAG.html in German.
Back to the main page of this TUB web site (NOT archive), see
index.html in English,
indexDE.html in German.