Image fea0l0n1.jpg: Output in format A6 of the file fea0l0np.pdf, see
fea0l0n1. PS / TXT / PDF / jpg
Section 2, Chapter F:
Colour Metrics for chromatic and luminance adaptation (2024)
This image page with 260 image series:
fe2s in English,
fg2s in German.
Previous image page:
ee2s in English,
eg2s in German.
Next image page, see
ge2s in English,
gg2s in German.
Introduction, content list and summary:
feai,
fea_i,
fea_s in English or
fgai,
fga_i,
fga_s in German.
Section 2: Colourimetry, Colour Vision and Applications for Colour
Image Technology (2019-2024), Image part fe2s
under development
Chapter F: Colour Metrics for chromatic and Luminance Adapdaton (2024)
The following 260 image series between fea0 and fez9
show the content with links to the single figures
in up to six formats.
Image fea0l0n1.jpg: Output in format A6 of the file
fea0l0np.pdf, see
fea0l0n1.
PS /
TXT /
PDF /
jpg
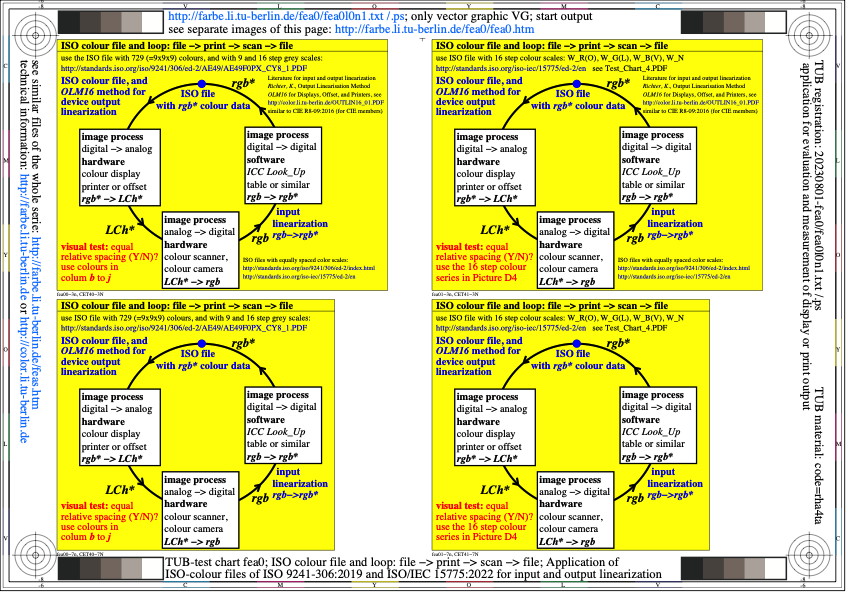
fea0: TUB-test chart fea0; ISO-colour file and colour loop:
ISO file -> print -> scan -> ISO file; application of
ISO 9241-306 & ISO/IEC 15775: input and output linearization
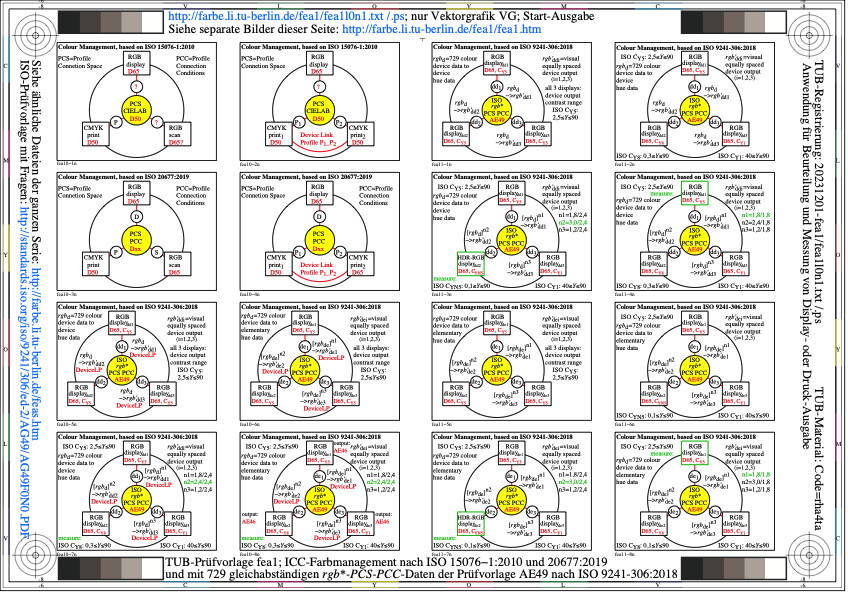
Image fea1l0n1.jpg: Output in format A6 of the file
fea1l0np.pdf, see
fea1l0n1.
PS /
TXT /
PDF /
jpg
fea1: TUB-test chart fea1; Colour management according to ISO 15076-1
:2010, ISO 20677:2018, and with 729(=9x9=9) equally spaced
rgb*-PCS-PCC data according to ISO 9241-306:2018
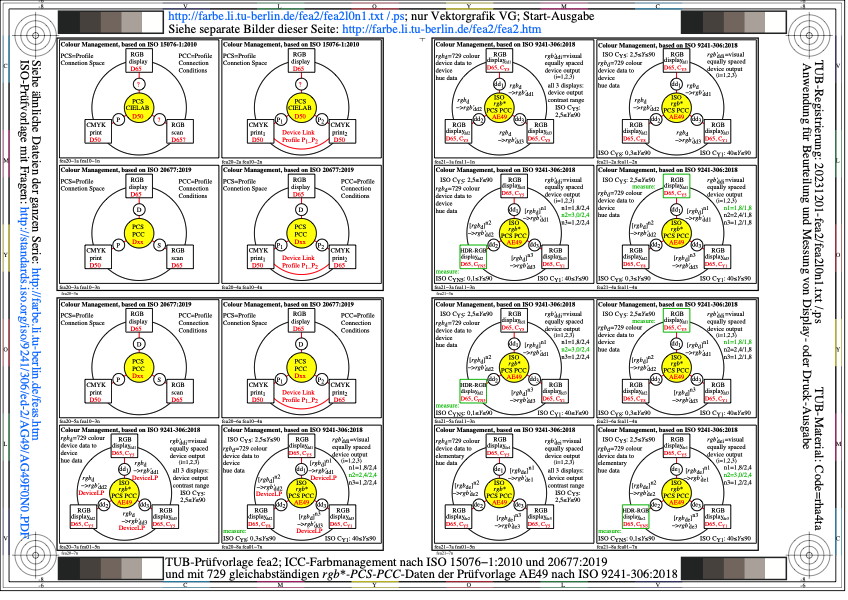
Image fea2l0n1.jpg: Output in format A6 of the file
fea2l0np.pdf, see
fea2l0n1.
PS /
TXT /
PDF /
jpg
fea2: TUB-test chart fea2; Colour management according to ISO 15076-1
:2010, ISO 20677:2018, and with 729(=9x9=9) equally spaced
rgb*-PCS-PCC data according to ISO 9241-306:2018
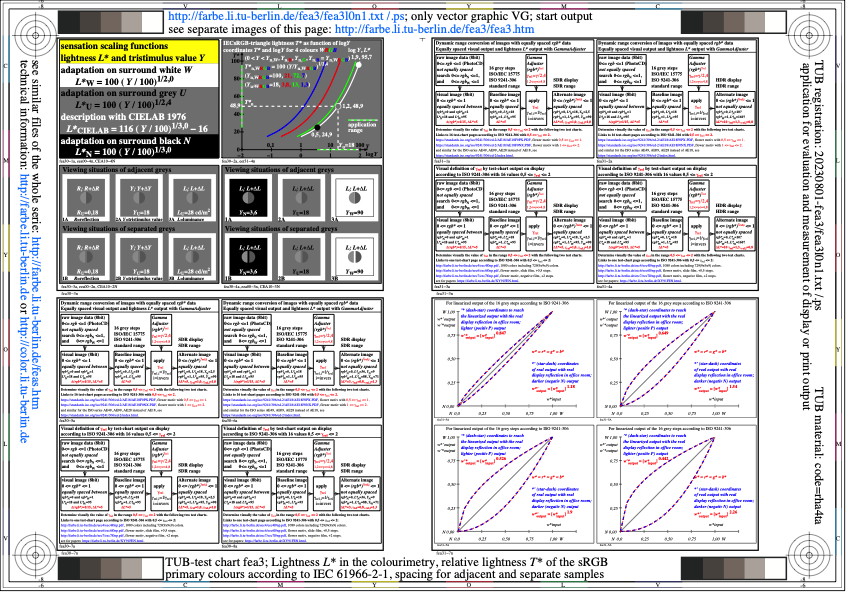
Image fea3l0n1.jpg: Output in format A6 of the file
fea3l0np.pdf, see
fea3l0n1.
PS /
TXT /
PDF /
jpg
fea3: TUB-test chart fea3; Lightness L* in colourimetry
Relative lightness T* of the sRGB primary colours
Spacing for adjacent and separate colours
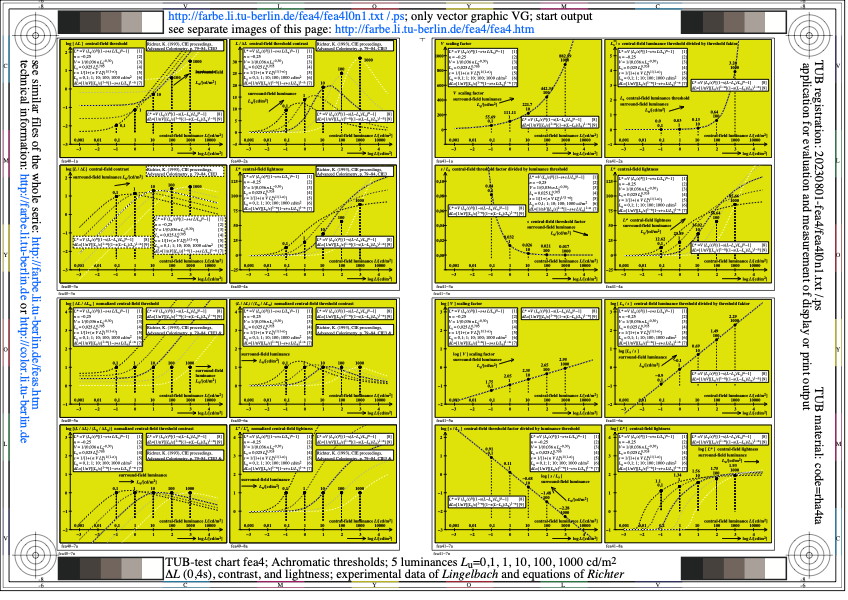
Image fea4l0n1.jpg: Output in format A6 of the file
fea4l0np.pdf, see
fea4l0n1.
PS /
TXT /
PDF /
jpg
fea4: TUB-test chart fea4; Achromatic thresholds, 5 Lu on Y
thresholds delta_L (0,4s), contrast and lightness; experi-
mental data of Lingelbach and Richter without adaptation
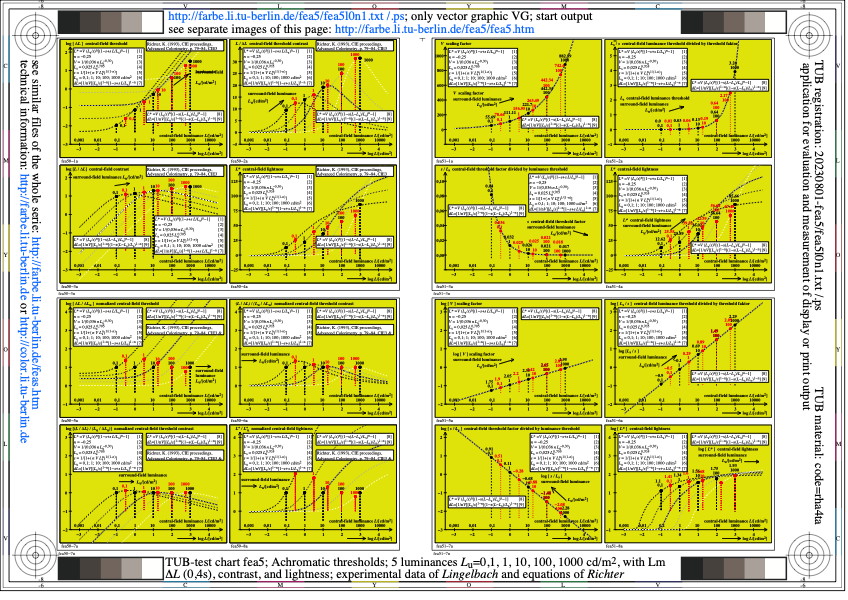
Image fea5l0n1.jpg: Output in format A6 of the file
fea5l0np.pdf, see
fea5l0n1.
PS /
TXT /
PDF /
jpg
fea5: TUB-test chart fea5; Achromatic thresholds, 5 Lu & Lm on Y
thresholds delta_L (0,4s), contrast and lightness; experi-
mental data of Lingelbach and Richter with adaptation
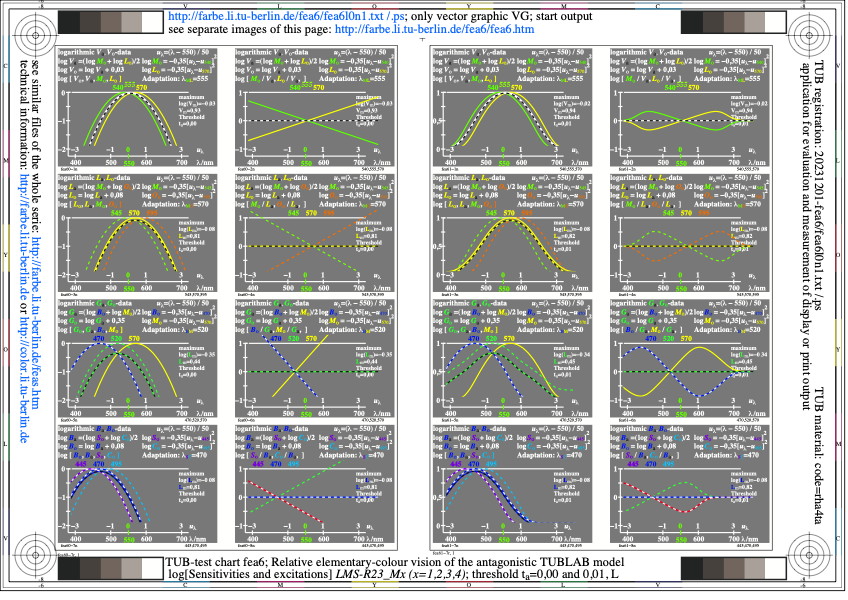
Image fea6l0n1.jpg: Output in format A6 of the file
fea6l0np.pdf, see
fea6l0n1.
PS /
TXT /
PDF /
jpg
fea6: TUB-test chart fea6; Relative elementary colour vision
of the antagonistic TUBLAB model, threshold ts=0,00&0,01
log[sensitivity and responses], O/L & M/L
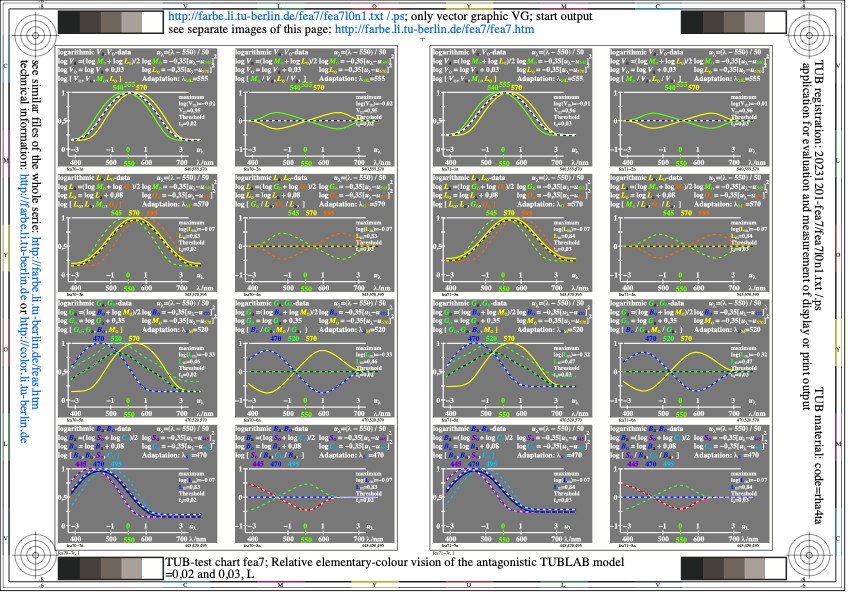
Image fea7l0n1.jpg: Output in format A6 of the file
fea7l0np.pdf, see
fea7l0n1.
PS /
TXT /
PDF /
jpg
fea7: TUB-test chart fea7; Relative elementary colour vision
of the antagonistic TUBLAB model, threshold ts=0,02&0,03
log[sensitivity and responses], O/L & M/L

Image fea8l0n1.jpg: Output in format A6 of the file
fea8l0np.pdf, see
fea8l0n1.
PS /
TXT /
PDF /
jpg
fea8: TUB-test chart fea8; Relative elementary colour vision
of the antagonistic TUBLAB model, threshold ts=0,00&0,01
log[sensitivity and responses], O/V & M/V
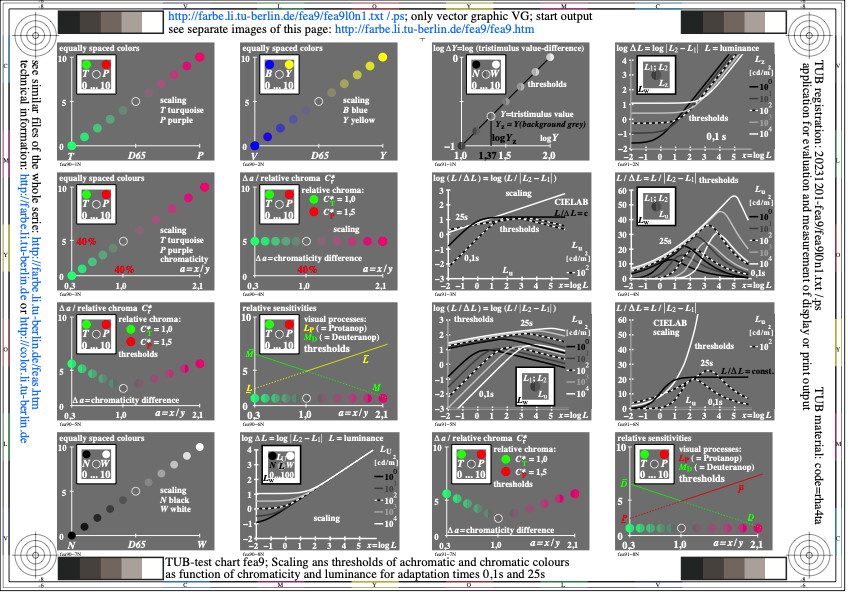
Image fea9l0n1.jpg: Output in format A6 of the file
fea9l0np.pdf, see
fea9l0n1.
PS /
TXT /
PDF /
jpg
fea9: TUB-test chart fea9; Relative elementary colour vision
of the antagonistic TUBLAB model, threshold ts=0,02&0,03
log[sensitivity and responses], O/V & M/V
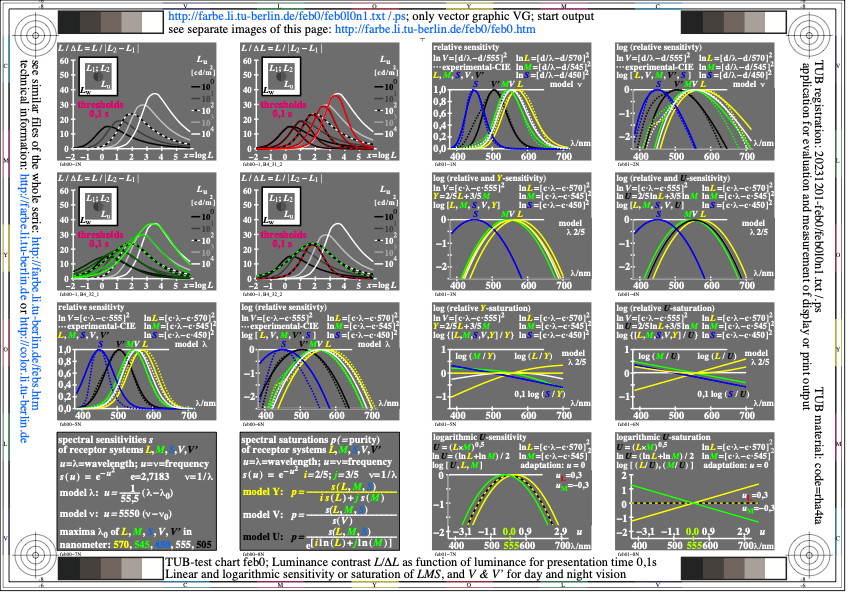
Image feb0l0n1.jpg: Output in format A6 of the file
feb0l0np.pdf, see
feb0l0n1.
PS /
TXT /
PDF /
jpg
feb0: TUB-test chart feb0; Under development
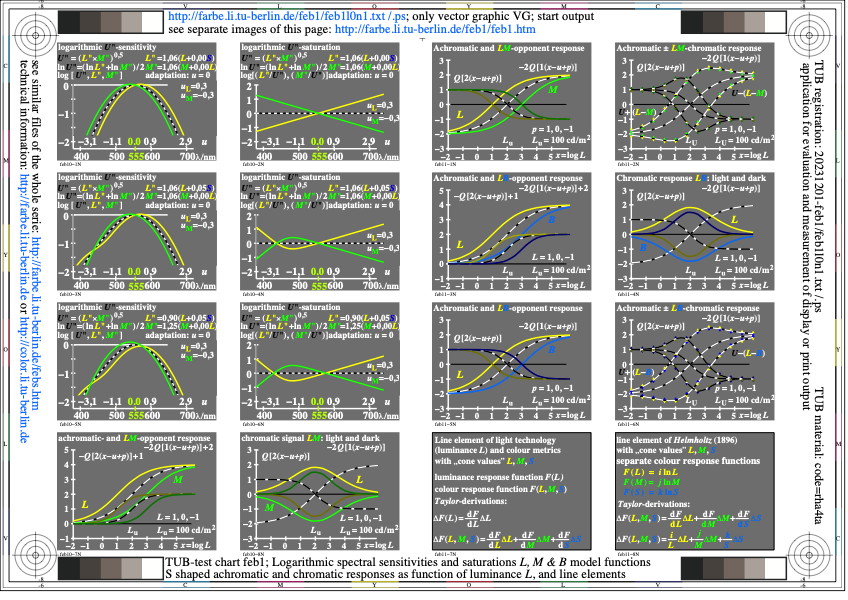
Image feb1l0n1.jpg: Output in format A6 of the file
feb1l0np.pdf, see
feb1l0n1.
PS /
TXT /
PDF /
jpg
feb1: TUB-test chart feb1; Under development
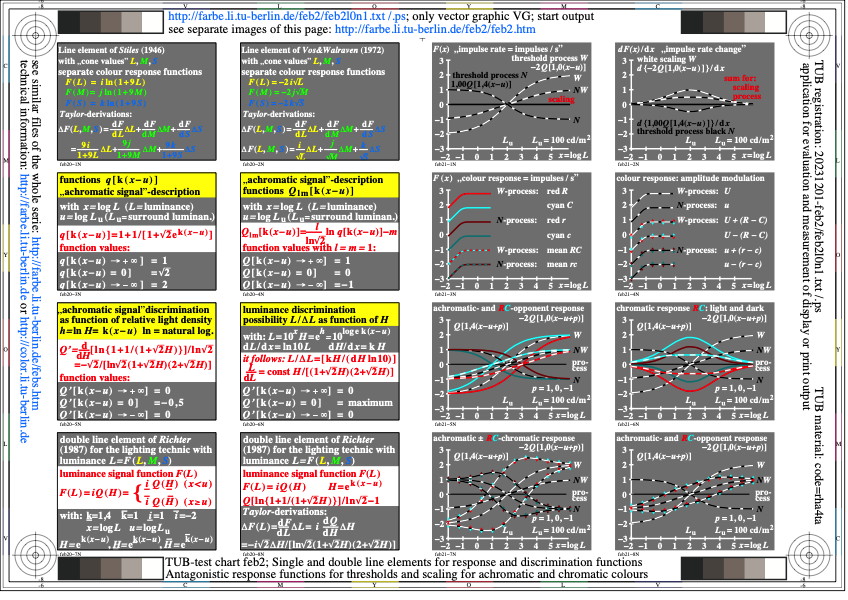
Image feb2l0n1.jpg: Output in format A6 of the file
feb2l0np.pdf, see
feb2l0n1.
PS /
TXT /
PDF /
jpg
feb2: TUB-test chart feb2; Under development
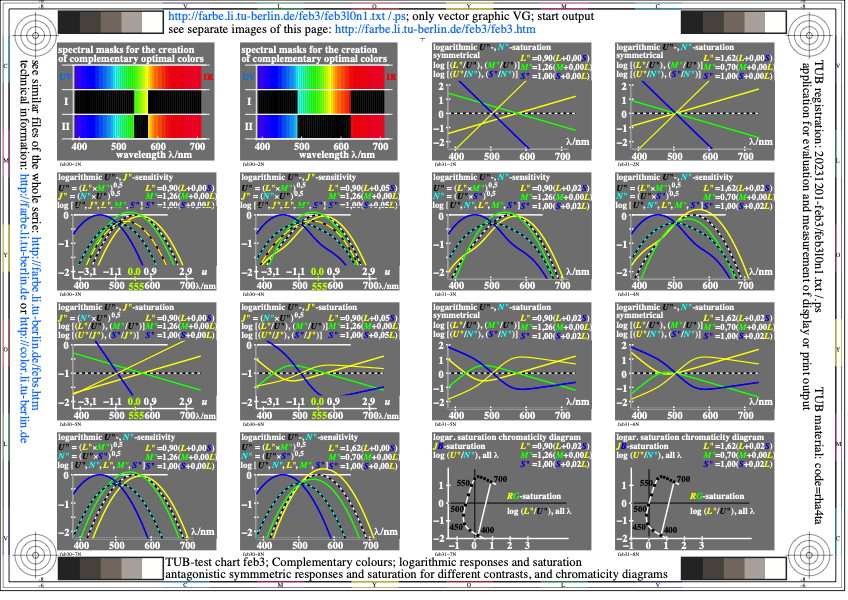
Image feb3l0n1.jpg: Output in format A6 of the file
feb3l0np.pdf, see
feb3l0n1.
PS /
TXT /
PDF /
jpg
feb3: TUB-test chart feb3; Under development
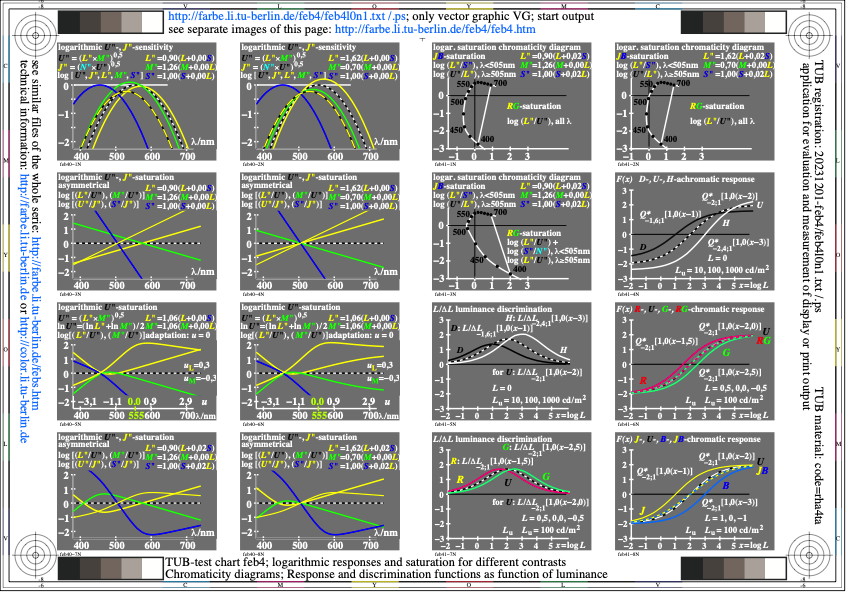
Image feb4l0n1.jpg: Output in format A6 of the file
feb4l0np.pdf, see
feb4l0n1.
PS /
TXT /
PDF /
jpg
feb4: TUB-test chart feb4; Under development
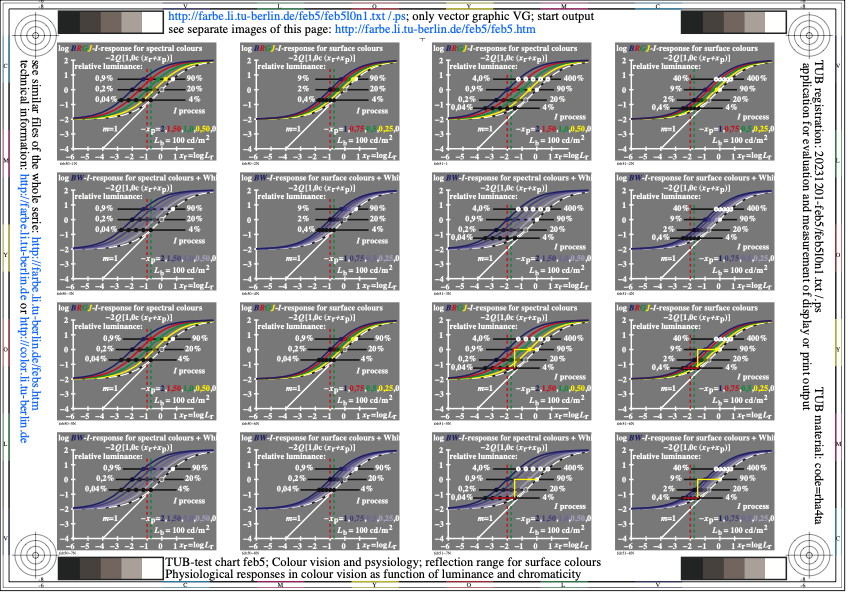
Image feb5l0n1.jpg: Output in format A6 of the file
feb5l0np.pdf, see
feb5l0n1.
PS /
TXT /
PDF /
jpg
feb5: TUB-test chart feb5; Under development
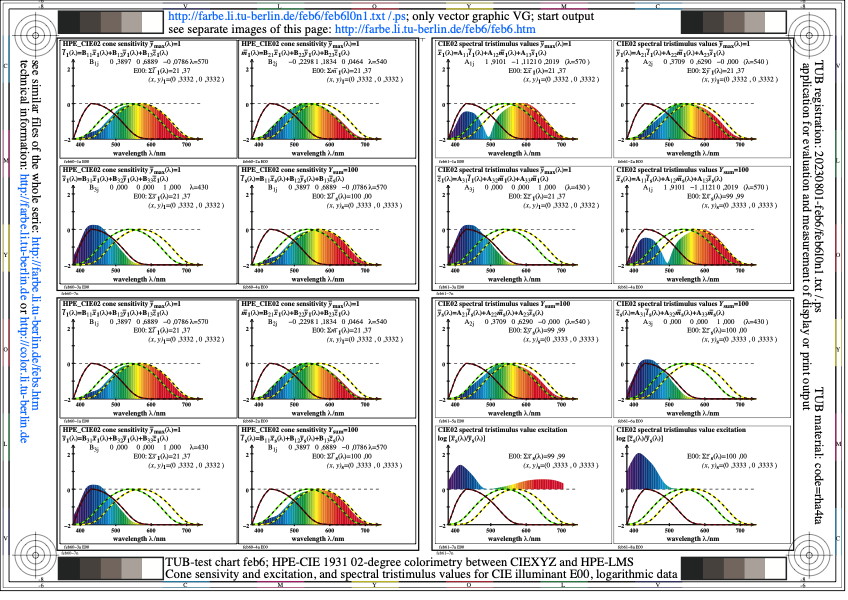
Image feb6l0n1.jpg: Output in format A6 of the file
feb6l0np.pdf, see
feb6l0n1.
PS /
TXT /
PDF /
jpg
feb6: TUB-test chart feb6; Under development
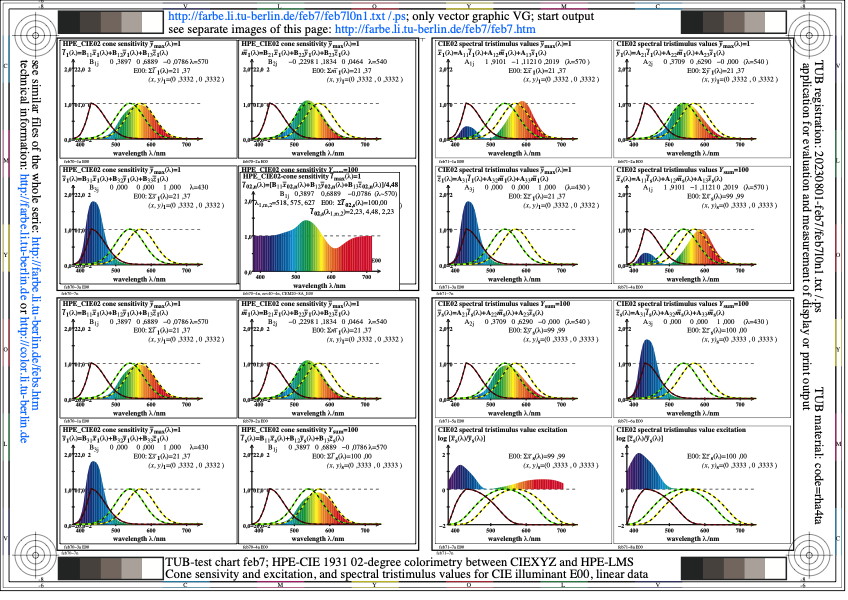
Image feb7l0n1.jpg: Output in format A6 of the file
feb7l0np.pdf, see
feb7l0n1.
PS /
TXT /
PDF /
jpg
feb7: TUB-test chart feb7; Under development
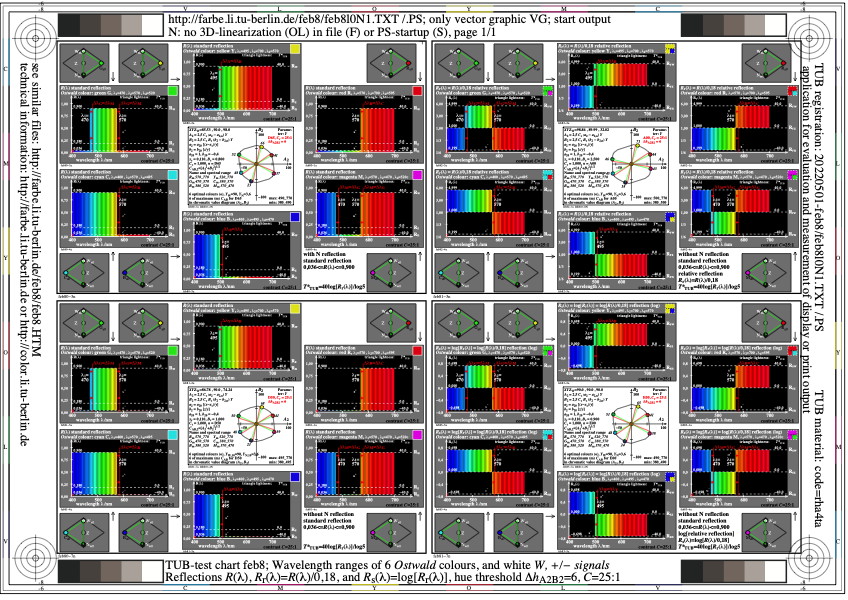
Image feb8l0n1.jpg: Output in format A6 of the file
feb8l0np.pdf, see
feb8l0n1.
PS /
TXT /
PDF /
jpg
feb8: TUB-test chart feb8; Under development
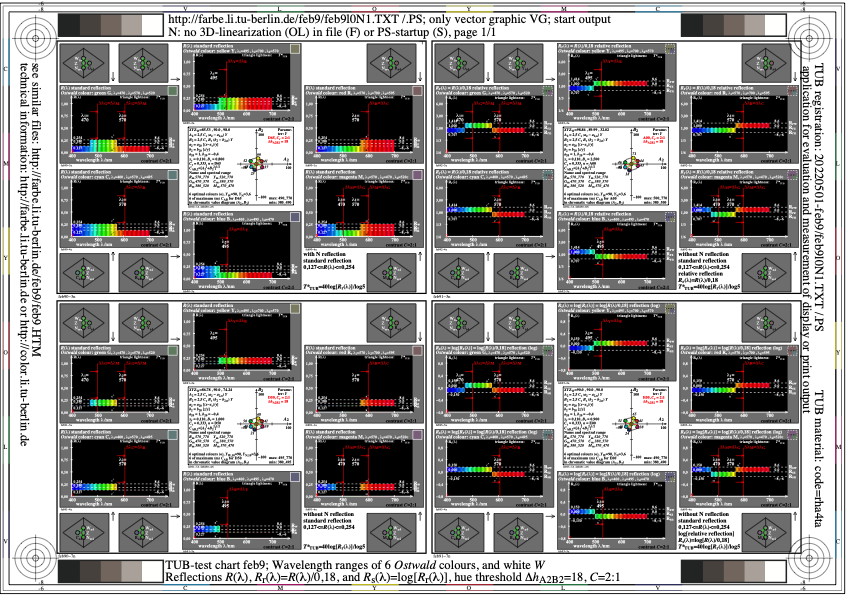
Image feb9l0n1.jpg: Output in format A6 of the file
feb9l0np.pdf, see
feb9l0n1.
PS /
TXT /
PDF /
jpg
feb9: TUB-test chart feb9; Under development

Image fec0l0n1.jpg: Output in format A6 of the file
fec0l0np.pdf, see
fec0l0n1.
PS /
TXT /
PDF /
jpg
fec0: TUB-test chart fec0; Ostwald-optimal colours
4 illuminants D65, D50, P40, A, hue plane YB, 0< Y <100
4 contrasts C >288:1, 25:1, 16:1, 9:1
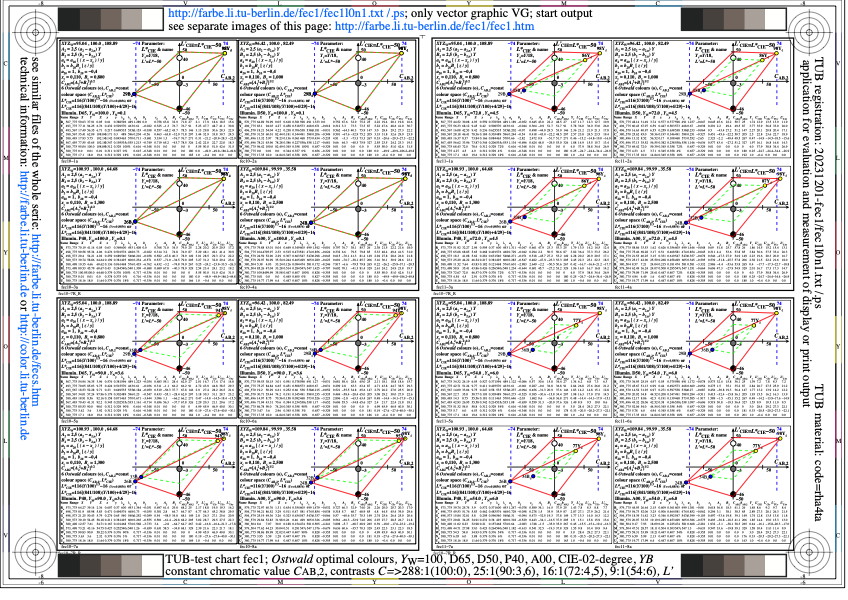
Image fec1l0n1.jpg: Output in format A6 of the file
fec1l0np.pdf, see
fec1l0n1.
PS /
TXT /
PDF /
jpg
fec1: TUB-test chart fec1; Ostwald-optimal colours
4 illuminants D65, D50, P40, A, hue plane YB, -50< L*CIE <50
4 contrasts C >288:1, 25:1, 16:1, 9:1

Image fec2l0n1.jpg: Output in format A6 of the file
fec2l0np.pdf, see
fec2l0n1.
PS /
TXT /
PDF /
jpg
fec2: TUB-test chart fec2; Ostwald-optimal colours
4 illuminants D65, D50, P40, A, hue plane YB, -50< L*CIr <50
4 contrasts C >288:1, 25:1, 16:1, 9:1

Image fec3l0n1.jpg: Output in format A6 of the file
fec3l0np.pdf, see
fec3l0n1.
PS /
TXT /
PDF /
jpg
fec3: TUB-test chart fec3; Ostwald-optimal colours
4 illuminants D65, D50, P40, A, hue plane YB, -50< L*TUr <50
4 contrasts C >288:1, 25:1, 16:1, 9:1

Image fec4l0n1.jpg: Output in format A6 of the file
fec4l0np.pdf, see
fec4l0n1.
PS /
TXT /
PDF /
jpg
fec4: TUB-test chart fec4; Ostwald-optimal colours
4 illuminants D65, D50, P40, A, hue plane YB, -50< L*TAr <50
4 contrasts C >288:1, 25:1, 16:1, 9:1

Image fec5l0n1.jpg: Output in format A6 of the file
fec5l0np.pdf, see
fec5l0n1.
PS /
TXT /
PDF /
jpg
fec5: TUB-test chart fec5; Ostwald-optimal colours
4 illuminants D65, D50, P40, A, hue plane YB, 0< Y <100
4 contrasts C >288:1, 25:1, 16:1, 9:1
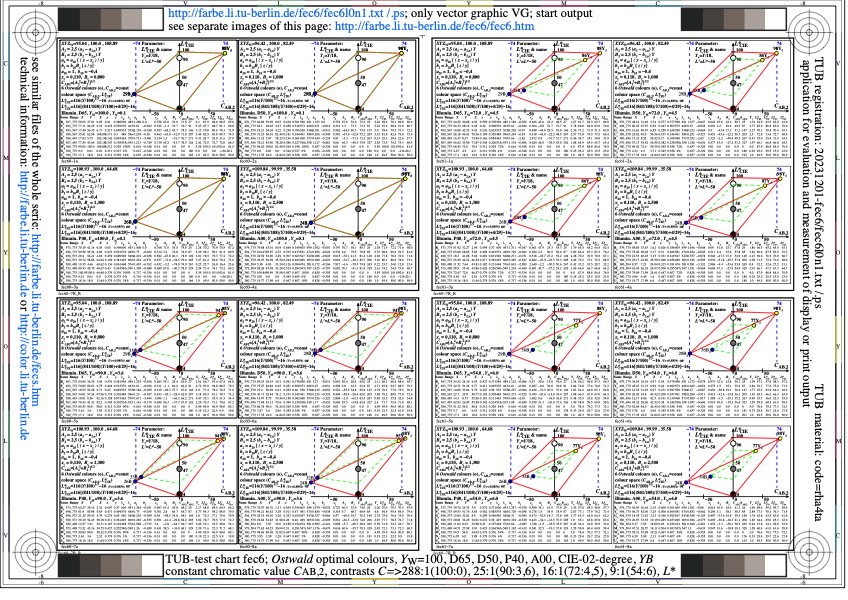
Image fec6l0n1.jpg: Output in format A6 of the file
fec6l0np.pdf, see
fec6l0n1.
PS /
TXT /
PDF /
jpg
fec6: TUB-test chart fec6; Ostwald-optimal colours
4 illuminants D65, D50, P40, A, hue plane YB, 0< L*CIE <100
4 contrasts C >288:1, 25:1, 16:1, 9:1

Image fec7l0n1.jpg: Output in format A6 of the file
fec7l0np.pdf, see
fec7l0n1.
PS /
TXT /
PDF /
jpg
fec7: TUB-test chart fec7; Ostwald-optimal colours
4 illuminants D65, D50, P40, A, hue plane YB, 0< L*CIr <100
4 contrasts C >288:1, 25:1, 16:1, 9:1

Image fec8l0n1.jpg: Output in format A6 of the file
fec8l0np.pdf, see
fec8l0n1.
PS /
TXT /
PDF /
jpg
fec8: TUB-test chart fec8; Ostwald-optimal colours
4 illuminants D65, D50, P40, A, hue plane YB, 0< L*TUr <100
4 contrasts C >288:1, 25:1, 16:1, 9:1

Image fec9l0n1.jpg: Output in format A6 of the file
fec9l0np.pdf, see
fec9l0n1.
PS /
TXT /
PDF /
jpg
fec9: TUB-test chart fec9; Ostwald-optimal colours
4 illuminants D65, D50, P40, A, hue plane YB, 0< L*TAr <100
4 contrasts C >288:1, 25:1, 16:1, 9:1

Image fed0l0n1.jpg: Output in format A6 of the file
fed0l0np.pdf, see
fed0l0n1.
PS /
TXT /
PDF /
jpg
fed0: TUB-test chart fed0; Ostwald-optimal colours
4 illuminants D65, D50, P40, A, hue plane YB, 0< Y <100
4 contrasts C >288:1, 25:1, 16:1, 9:1

Image fed1l0n1.jpg: Output in format A6 of the file
fed1l0np.pdf, see
fed1l0n1.
PS /
TXT /
PDF /
jpg
fed1: TUB-test chart fed1; Ostwald-optimal colours
4 illuminants D65, D50, P40, A, hue plane YB, -50< L*CIE <50
4 contrasts C >288:1, 25:1, 16:1, 9:1

Image fed2l0n1.jpg: Output in format A6 of the file
fed2l0np.pdf, see
fed2l0n1.
PS /
TXT /
PDF /
jpg
fed2: TUB-test chart fed2; Ostwald-optimal colours
4 illuminants D65, D50, P40, A, hue plane YB, -50< L*CIr <50
4 contrasts C >288:1, 25:1, 16:1, 9:1

Image fed3l0n1.jpg: Output in format A6 of the file
fed3l0np.pdf, see
fed3l0n1.
PS /
TXT /
PDF /
jpg
fed3: TUB-test chart fed3; Ostwald-optimal colours
4 illuminants D65, D50, P40, A, hue plane YB, -50< L*TUr <50
4 contrasts C >288:1, 25:1, 16:1, 9:1

Image fed4l0n1.jpg: Output in format A6 of the file
fed4l0np.pdf, see
fed4l0n1.
PS /
TXT /
PDF /
jpg
fed4: TUB-test chart fed4; Ostwald-optimal colours
4 illuminants D65, D50, P40, A, hue plane YB, -50< L*TAr <50
4 contrasts C >288:1, 25:1, 16:1, 9:1

Image fed5l0n1.jpg: Output in format A6 of the file
fed5l0np.pdf, see
fed5l0n1.
PS /
TXT /
PDF /
jpg
fed5: TUB-test chart fed5; Ostwald-optimal colours
4 illuminants D65, D50, P40, A, hue plane YB, 0< Y <100
4 contrasts C >288:1, 25:1, 16:1, 9:1

Image fed6l0n1.jpg: Output in format A6 of the file
fed6l0np.pdf, see
fed6l0n1.
PS /
TXT /
PDF /
jpg
fed6: TUB-test chart fed6; Ostwald-optimal colours
4 illuminants D65, D50, P40, A, hue plane YB, 0< L*CIE <100
4 contrasts C >288:1, 25:1, 16:1, 9:1

Image fed7l0n1.jpg: Output in format A6 of the file
fed7l0np.pdf, see
fed7l0n1.
PS /
TXT /
PDF /
jpg
fed7: TUB-test chart fed7; Ostwald-optimal colours
4 illuminants D65, D50, P40, A, hue plane YB, 0< L*CIr <100
4 contrasts C >288:1, 25:1, 16:1, 9:1

Image fed8l0n1.jpg: Output in format A6 of the file
fed8l0np.pdf, see
fed8l0n1.
PS /
TXT /
PDF /
jpg
fed8: TUB-test chart fed8; Ostwald-optimal colours
4 illuminants D65, D50, P40, A, hue plane YB, 0< L*TUr <100
4 contrasts C >288:1, 25:1, 16:1, 9:1

Image fed9l0n1.jpg: Output in format A6 of the file
fed9l0np.pdf, see
fed9l0n1.
PS /
TXT /
PDF /
jpg
fed9: TUB-test chart fed9; Ostwald-optimal colours
4 illuminants D65, D50, P40, A, hue plane YB, 0< L*TAr <100
4 contrasts C >288:1, 25:1, 16:1, 9:1
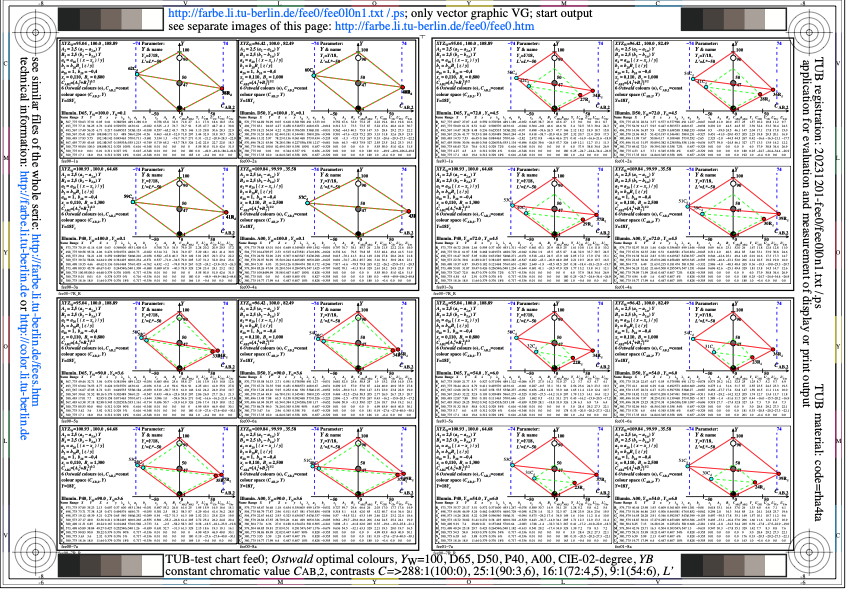
Image fee0l0n1.jpg: Output in format A6 of the file
fee0l0np.pdf, see
fee0l0n1.
PS /
TXT /
PDF /
jpg
fee0: TUB-test chart fee0; Ostwald-optimal colours
4 illuminants D65, D50, P40, A, hue plane CR, 0< Y <100
4 contrasts C >288:1, 25:1, 16:1, 9:1

Image fee1l0n1.jpg: Output in format A6 of the file
fee1l0np.pdf, see
fee1l0n1.
PS /
TXT /
PDF /
jpg
fee1: TUB-test chart fee1; Ostwald-optimal colours
4 illuminants D65, D50, P40, A, hue plane CR, -50< L*CIE <50
4 contrasts C >288:1, 25:1, 16:1, 9:1

Image fee2l0n1.jpg: Output in format A6 of the file
fee2l0np.pdf, see
fee2l0n1.
PS /
TXT /
PDF /
jpg
fee2: TUB-test chart fee2; Ostwald-optimal colours
4 illuminants D65, D50, P40, A, hue plane CR, -50< L*CIr <50
4 contrasts C >288:1, 25:1, 16:1, 9:1

Image fee3l0n1.jpg: Output in format A6 of the file
fee3l0np.pdf, see
fee3l0n1.
PS /
TXT /
PDF /
jpg
fee3: TUB-test chart fee3; Ostwald-optimal colours
4 illuminants D65, D50, P40, A, hue plane CR, -50< L*TUr <50
4 contrasts C >288:1, 25:1, 16:1, 9:1
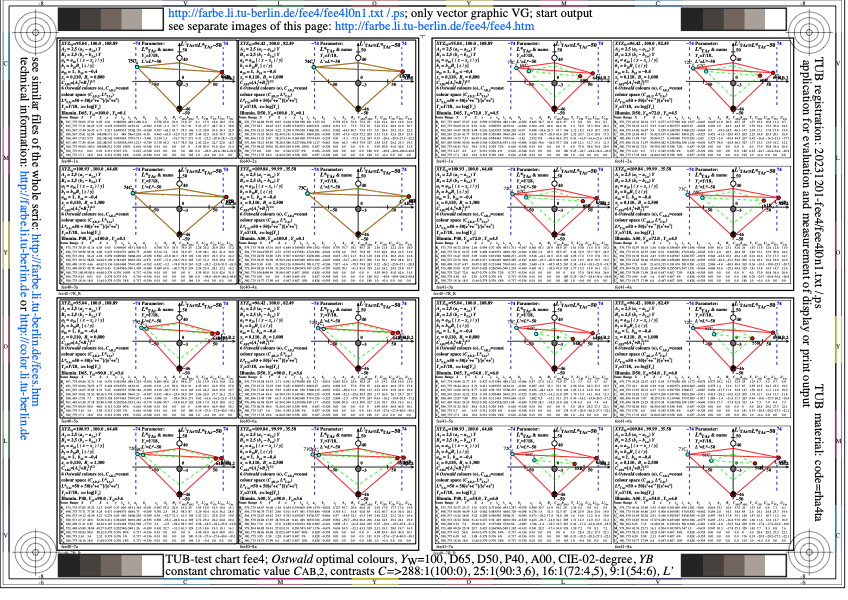
Image fee4l0n1.jpg: Output in format A6 of the file
fee4l0np.pdf, see
fee4l0n1.
PS /
TXT /
PDF /
jpg
fee4: TUB-test chart fee4; Ostwald-optimal colours
4 illuminants D65, D50, P40, A, hue plane CR, -50< L*TAr <50
4 contrasts C >288:1, 25:1, 16:1, 9:1
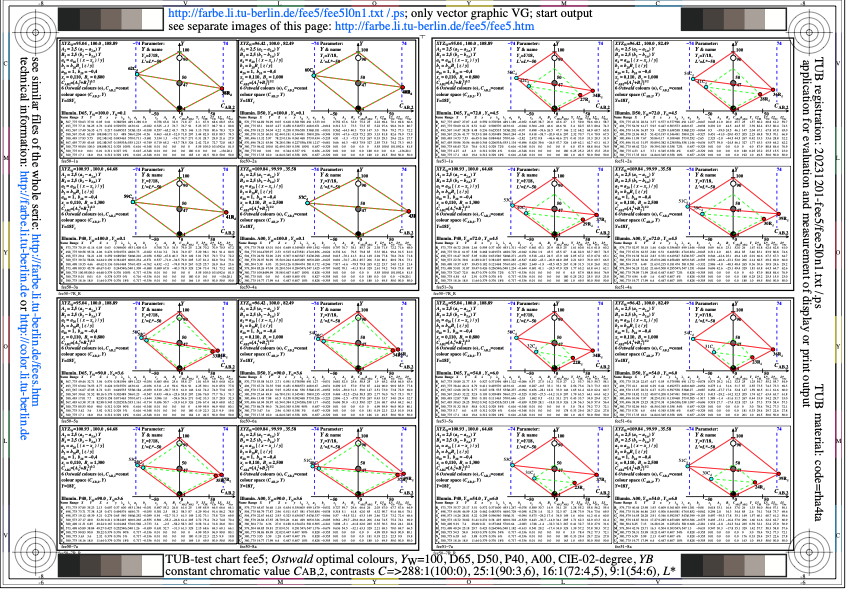
Image fee5l0n1.jpg: Output in format A6 of the file
fee5l0np.pdf, see
fee5l0n1.
PS /
TXT /
PDF /
jpg
fee5: TUB-test chart fee5; Ostwald-optimal colours
4 illuminants D65, D50, P40, A, hue plane CR, 0< Y <100
4 contrasts C >288:1, 25:1, 16:1, 9:1

Image fee6l0n1.jpg: Output in format A6 of the file
fee6l0np.pdf, see
fee6l0n1.
PS /
TXT /
PDF /
jpg
fee6: TUB-test chart fee6; Ostwald-optimal colours
4 illuminants D65, D50, P40, A, hue plane CR, 0< L*CIE <100
4 contrasts C >288:1, 25:1, 16:1, 9:1

Image fee7l0n1.jpg: Output in format A6 of the file
fee7l0np.pdf, see
fee7l0n1.
PS /
TXT /
PDF /
jpg
fee7: TUB-test chart fee7; Ostwald-optimal colours
4 illuminants D65, D50, P40, A, hue plane CR, 0< L*CIr <100
4 contrasts C >288:1, 25:1, 16:1, 9:1

Image fee8l0n1.jpg: Output in format A6 of the file
fee8l0np.pdf, see
fee8l0n1.
PS /
TXT /
PDF /
jpg
fee8: TUB-test chart fee8; Ostwald-optimal colours
4 illuminants D65, D50, P40, A, hue plane CR, 0< L*TUr <100
4 contrasts C >288:1, 25:1, 16:1, 9:1

Image fee9l0n1.jpg: Output in format A6 of the file
fee9l0np.pdf, see
fee9l0n1.
PS /
TXT /
PDF /
jpg
fee9: TUB-test chart fee9; Ostwald-optimal colours
4 illuminants D65, D50, P40, A, hue plane CR, 0< L*TAr <100
4 contrasts C >288:1, 25:1, 16:1, 9:1
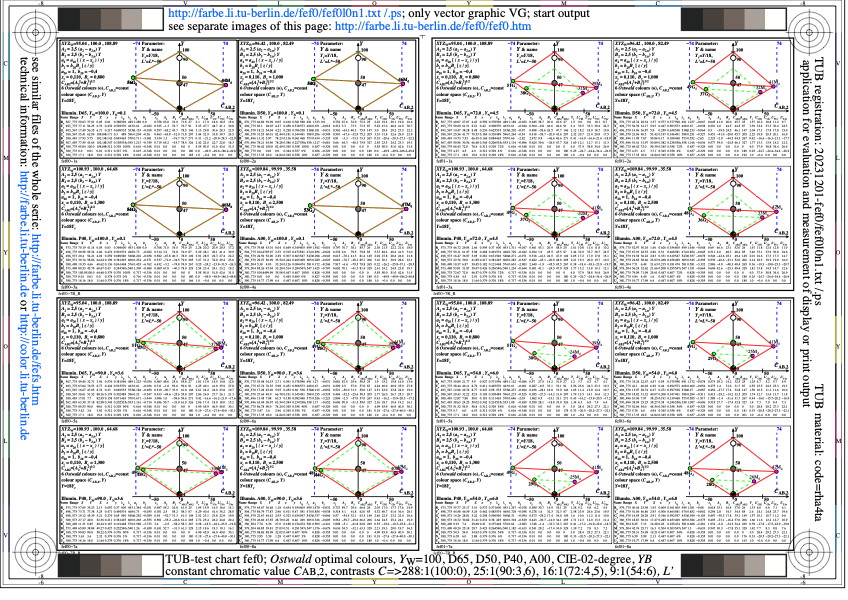
Image fef0l0n1.jpg: Output in format A6 of the file
fef0l0np.pdf, see
fef0l0n1.
PS /
TXT /
PDF /
jpg
fef0: TUB-test chart fef0; Ostwald-optimal colours
4 illuminants D65, D50, P40, A, hue plane GM, 0< Y <100
4 contrasts C >288:1, 25:1, 16:1, 9:1

Image fef1l0n1.jpg: Output in format A6 of the file
fef1l0np.pdf, see
fef1l0n1.
PS /
TXT /
PDF /
jpg
fef1: TUB-test chart fef1; Ostwald-optimal colours
4 illuminants D65, D50, P40, A, hue plane GM, -50< L*CIE <50
4 contrasts C >288:1, 25:1, 16:1, 9:1
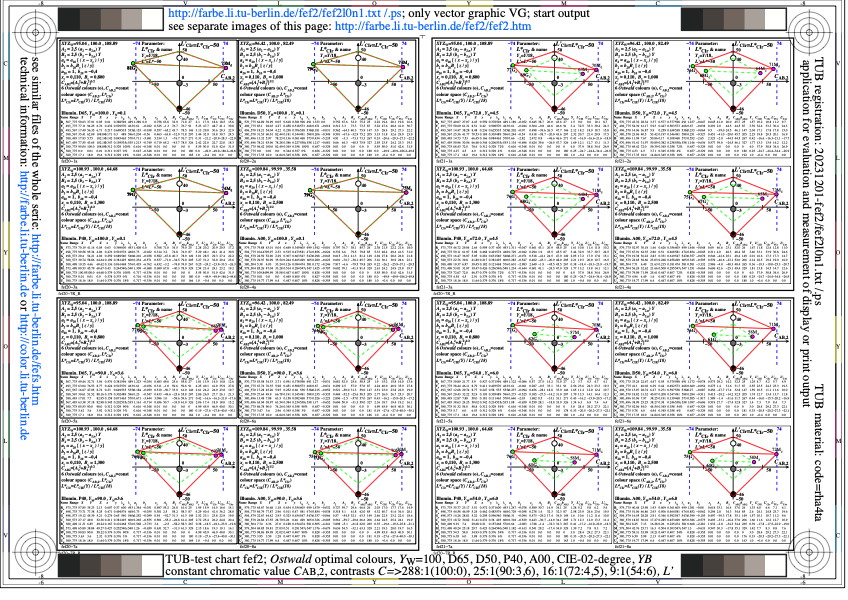
Image fef2l0n1.jpg: Output in format A6 of the file
fef2l0np.pdf, see
fef2l0n1.
PS /
TXT /
PDF /
jpg
fef2: TUB-test chart fef2; Ostwald-optimal colours
4 illuminants D65, D50, P40, A, hue plane GM, -50< L*CIr <50
4 contrasts C >288:1, 25:1, 16:1, 9:1

Image fef3l0n1.jpg: Output in format A6 of the file
fef3l0np.pdf, see
fef3l0n1.
PS /
TXT /
PDF /
jpg
fef3: TUB-test chart fef3; Ostwald-optimal colours
4 illuminants D65, D50, P40, A, hue plane GM, -50< L*TUr <50
4 contrasts C >288:1, 25:1, 16:1, 9:1

Image fef4l0n1.jpg: Output in format A6 of the file
fef4l0np.pdf, see
fef4l0n1.
PS /
TXT /
PDF /
jpg
fef4: TUB-test chart fef4; Ostwald-optimal colours
4 illuminants D65, D50, P40, A, hue plane GM, -50< L*TAr <50
4 contrasts C >288:1, 25:1, 16:1, 9:1
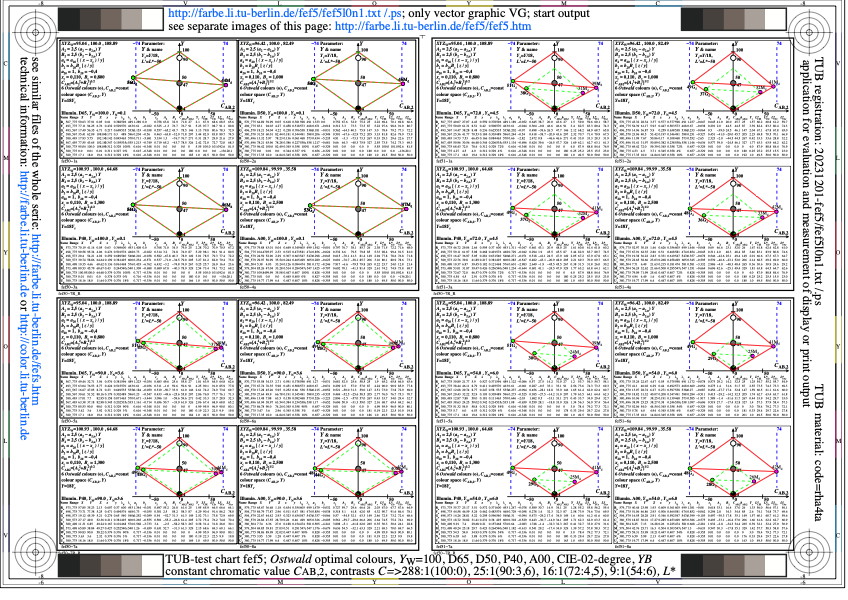
Image fef5l0n1.jpg: Output in format A6 of the file
fef5l0np.pdf, see
fef5l0n1.
PS /
TXT /
PDF /
jpg
fef5: TUB-test chart fef5; Ostwald-optimal colours
4 illuminants D65, D50, P40, A, hue plane GM, 0< Y <100
4 contrasts C >288:1, 25:1, 16:1, 9:1
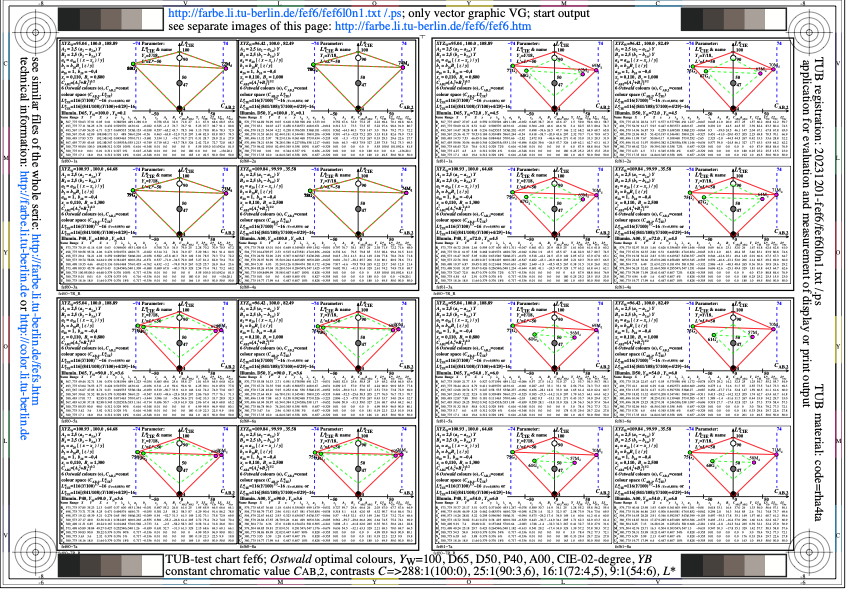
Image fef6l0n1.jpg: Output in format A6 of the file
fef6l0np.pdf, see
fef6l0n1.
PS /
TXT /
PDF /
jpg
fef6: TUB-test chart fef6; Ostwald-optimal colours
4 illuminants D65, D50, P40, A, hue plane GM, 0< L*CIE <100
4 contrasts C >288:1, 25:1, 16:1, 9:1

Image fef7l0n1.jpg: Output in format A6 of the file
fef7l0np.pdf, see
fef7l0n1.
PS /
TXT /
PDF /
jpg
fef7: TUB-test chart fef7; Ostwald-optimal colours
4 illuminants D65, D50, P40, A, hue plane GM, 0< L*CIr <100
4 contrasts C >288:1, 25:1, 16:1, 9:1

Image fef8l0n1.jpg: Output in format A6 of the file
fef8l0np.pdf, see
fef8l0n1.
PS /
TXT /
PDF /
jpg
fef8: TUB-test chart fef8; Ostwald-optimal colours
4 illuminants D65, D50, P40, A, hue plane GM, 0< L*TUr <100
4 contrasts C >288:1, 25:1, 16:1, 9:1
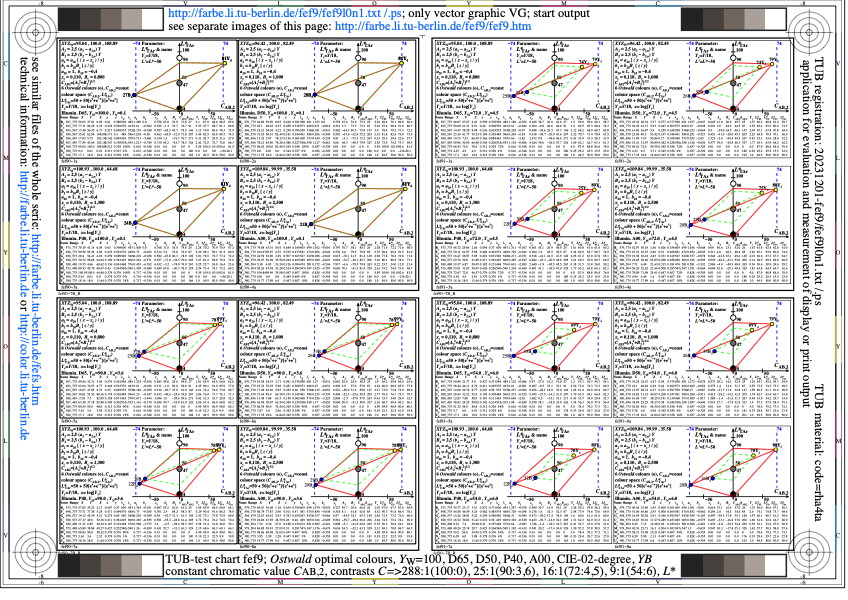
Image fef9l0n1.jpg: Output in format A6 of the file
fef9l0np.pdf, see
fef9l0n1.
PS /
TXT /
PDF /
jpg
fef9: TUB-test chart fef9; Ostwald-optimal colours
4 illuminants D65, D50, P40, A, hue plane GM, 0< L*TAr <100
4 contrasts C >288:1, 25:1, 16:1, 9:1

Image feg0l0n1.jpg: Output in format A6 of the file
feg0l0np.pdf, see
feg0l0n1.
PS /
TXT /
PDF /
jpg
feg0: TUB-test chart feg0; Under development

Image feg1l0n1.jpg: Output in format A6 of the file
feg1l0np.pdf, see
feg1l0n1.
PS /
TXT /
PDF /
jpg
feg1: TUB-test chart feg1; Under development
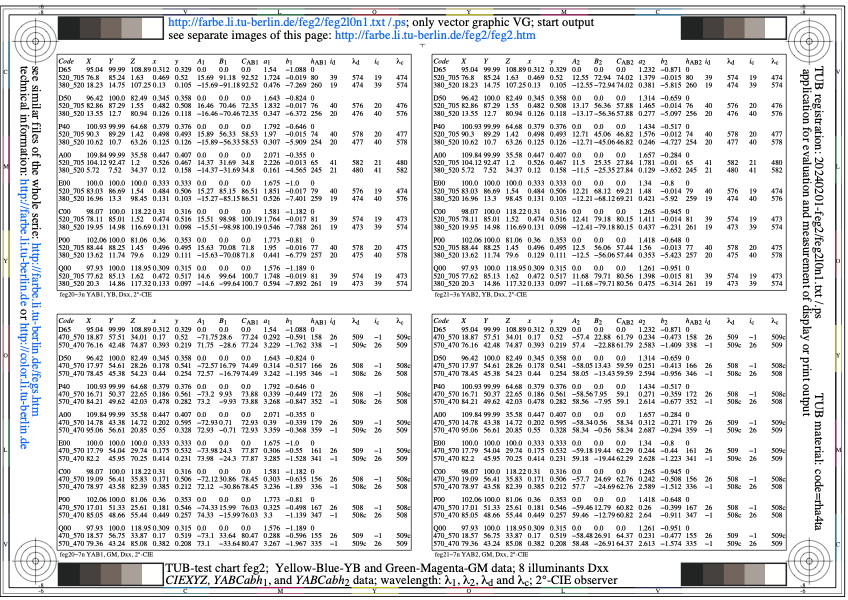
Image feg2l0n1.jpg: Output in format A6 of the file
feg2l0np.pdf, see
feg2l0n1.
PS /
TXT /
PDF /
jpg
feg2: TUB-test chart feg2; Under development
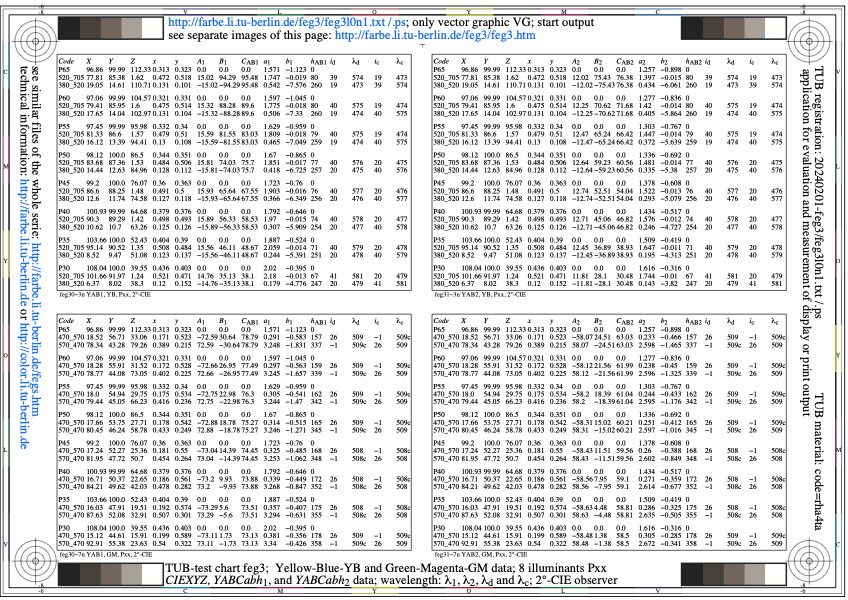
Image feg3l0n1.jpg: Output in format A6 of the file
feg3l0np.pdf, see
feg3l0n1.
PS /
TXT /
PDF /
jpg
feg3: TUB-test chart feg3; Under development

Image feg4l0n1.jpg: Output in format A6 of the file
feg4l0np.pdf, see
feg4l0n1.
PS /
TXT /
PDF /
jpg
feg4: TUB-test chart feg4; Under development

Image feg5l0n1.jpg: Output in format A6 of the file
feg5l0np.pdf, see
feg5l0n1.
PS /
TXT /
PDF /
jpg
feg5: TUB-test chart feg5; Under development
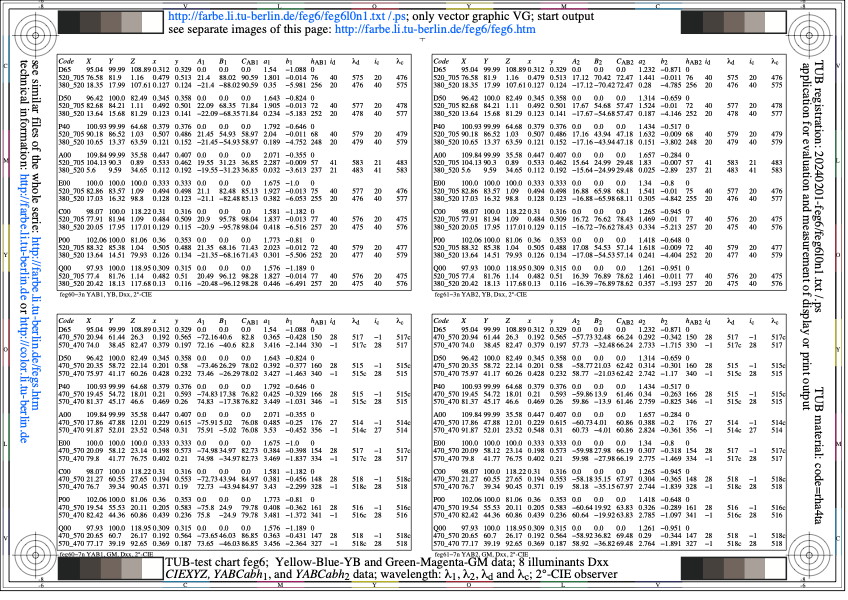
Image feg6l0n1.jpg: Output in format A6 of the file
feg6l0np.pdf, see
feg6l0n1.
PS /
TXT /
PDF /
jpg
feg6: TUB-test chart feg6; Under development
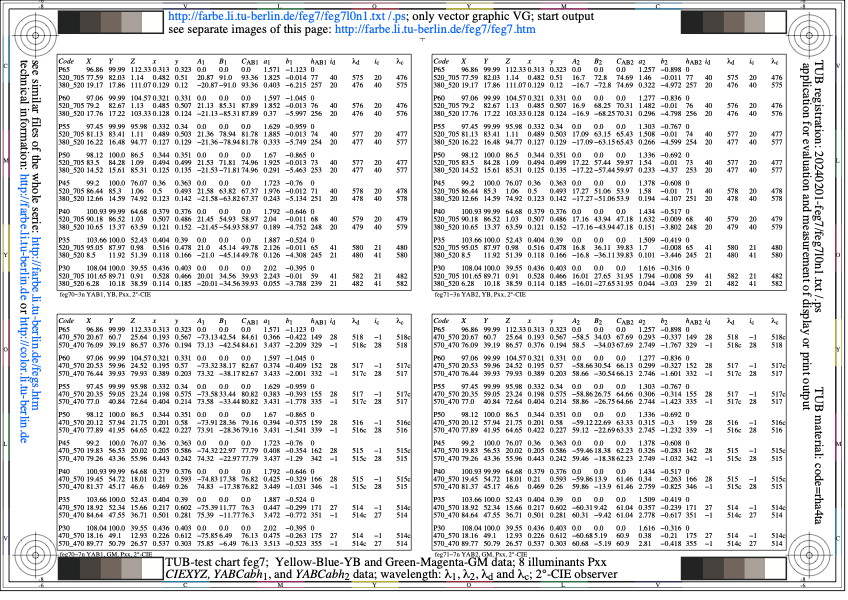
Image feg7l0n1.jpg: Output in format A6 of the file
feg7l0np.pdf, see
feg7l0n1.
PS /
TXT /
PDF /
jpg
feg7: TUB-test chart feg7; Under development
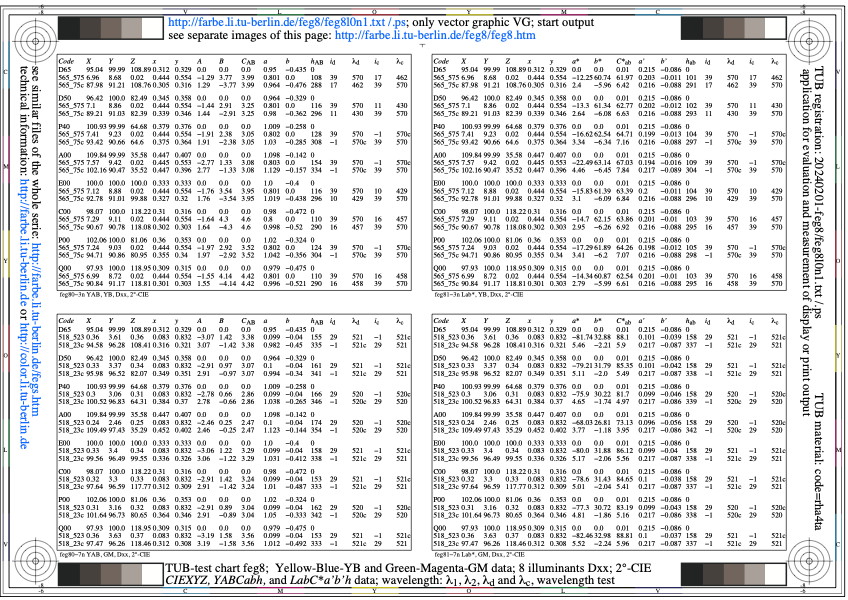
Image feg8l0n1.jpg: Output in format A6 of the file
feg8l0np.pdf, see
feg8l0n1.
PS /
TXT /
PDF /
jpg
feg8: TUB-test chart feg8; Under development
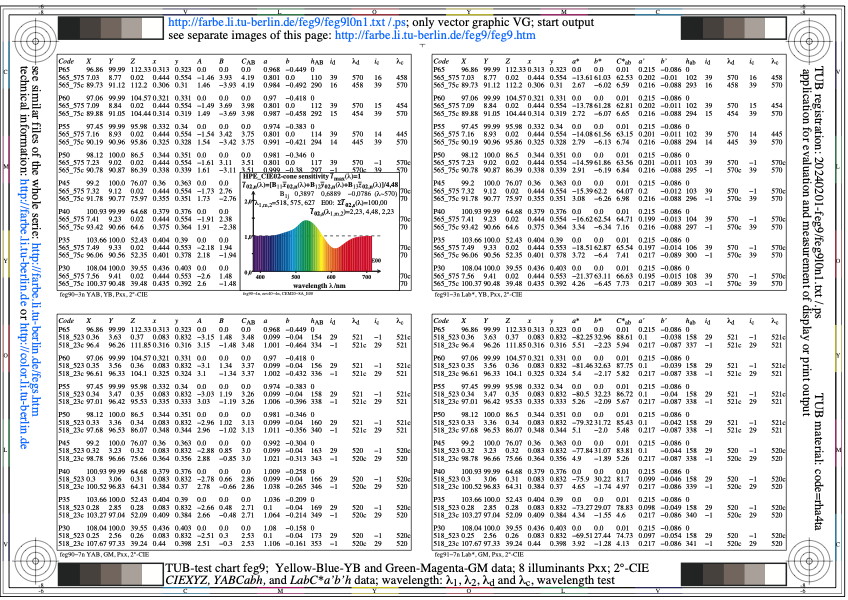
Image feg9l0n1.jpg: Output in format A6 of the file
feg9l0np.pdf, see
feg9l0n1.
PS /
TXT /
PDF /
jpg
feg9: TUB-test chart feg9; Under development
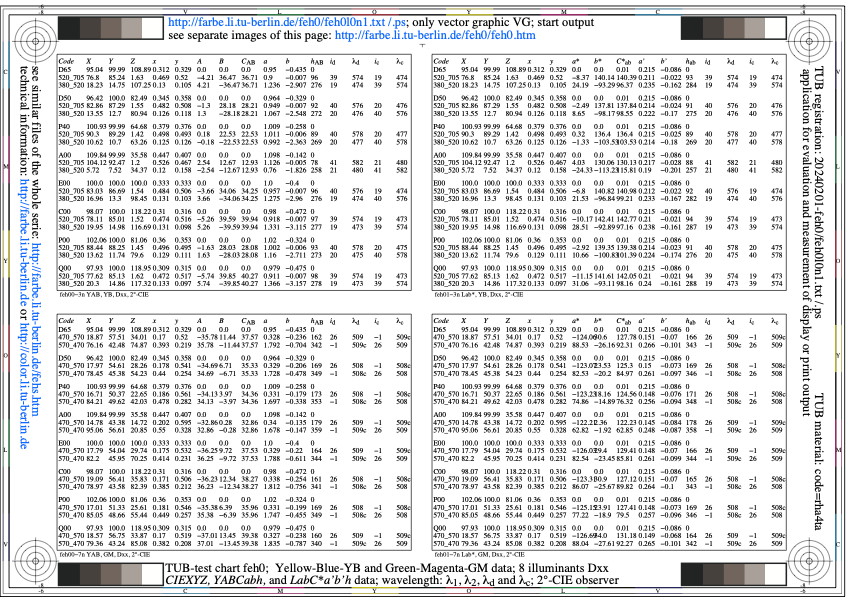
Image feh0l0n1.jpg: Output in format A6 of the file
feh0l0np.pdf, see
feh0l0n1.
PS /
TXT /
PDF /
jpg
feh0: TUB-test chart feh0; Under development
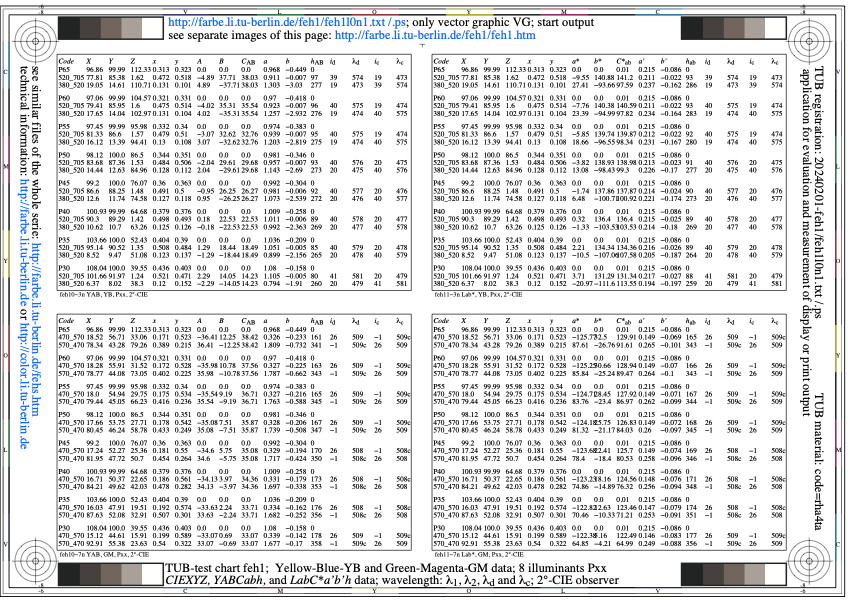
Image feh1l0n1.jpg: Output in format A6 of the file
feh1l0np.pdf, see
feh1l0n1.
PS /
TXT /
PDF /
jpg
feh1: TUB-test chart feh1; Under development

Image feh2l0n1.jpg: Output in format A6 of the file
feh2l0np.pdf, see
feh2l0n1.
PS /
TXT /
PDF /
jpg
feh2: TUB-test chart feh2; Under development

Image feh3l0n1.jpg: Output in format A6 of the file
feh3l0np.pdf, see
feh3l0n1.
PS /
TXT /
PDF /
jpg
feh3: TUB-test chart feh3; Under development

Image feh4l0n1.jpg: Output in format A6 of the file
feh4l0np.pdf, see
feh4l0n1.
PS /
TXT /
PDF /
jpg
feh4: TUB-test chart feh4; Under development
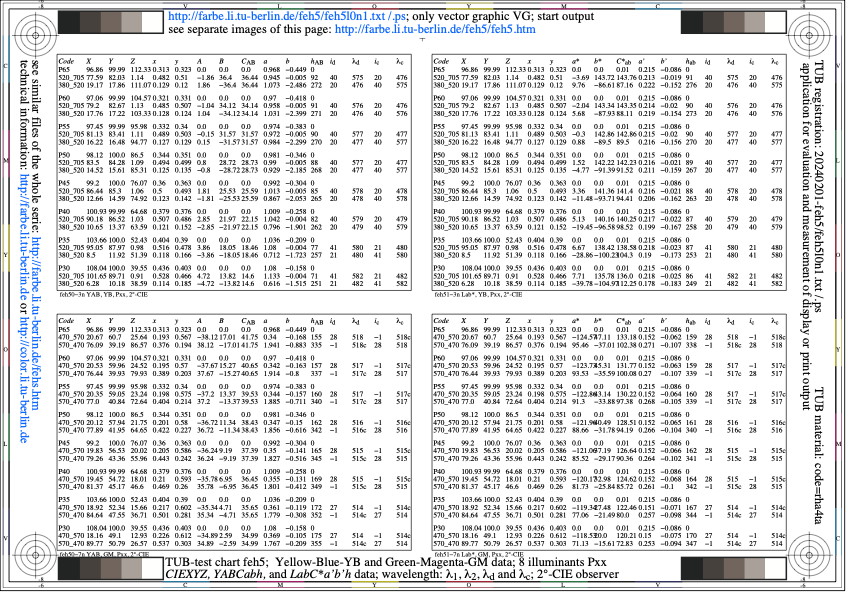
Image feh5l0n1.jpg: Output in format A6 of the file
feh5l0np.pdf, see
feh5l0n1.
PS /
TXT /
PDF /
jpg
feh5: TUB-test chart feh5; Under development

Image feh6l0n1.jpg: Output in format A6 of the file
feh6l0np.pdf, see
feh6l0n1.
PS /
TXT /
PDF /
jpg
feh6: TUB-test chart feh6; Under development

Image feh7l0n1.jpg: Output in format A6 of the file
feh7l0np.pdf, see
feh7l0n1.
PS /
TXT /
PDF /
jpg
feh7: TUB-test chart feh7; Under development

Image feh8l0n1.jpg: Output in format A6 of the file
feh8l0np.pdf, see
feh8l0n1.
PS /
TXT /
PDF /
jpg
feh8: TUB-test chart feh8; Under development
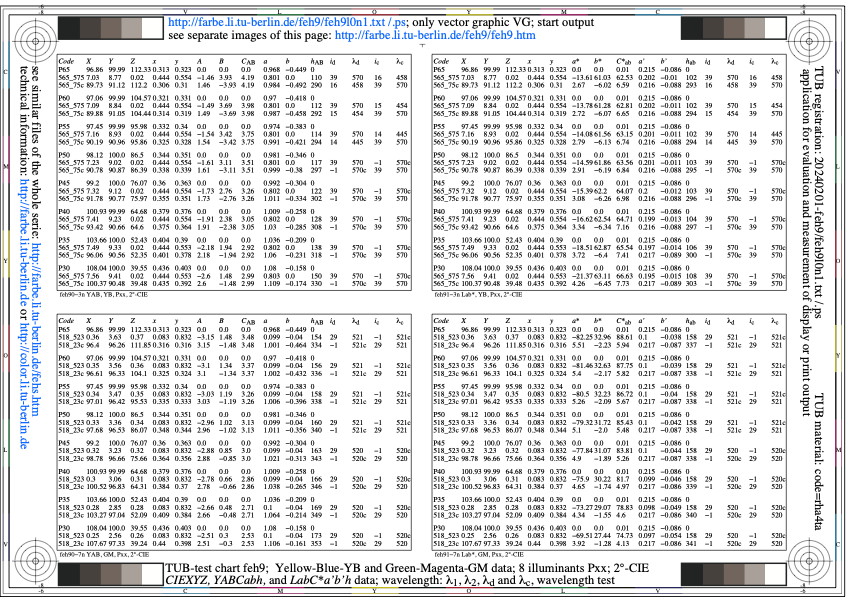
Image feh9l0n1.jpg: Output in format A6 of the file
feh9l0np.pdf, see
feh9l0n1.
PS /
TXT /
PDF /
jpg
feh9: TUB-test chart feh9; Under development
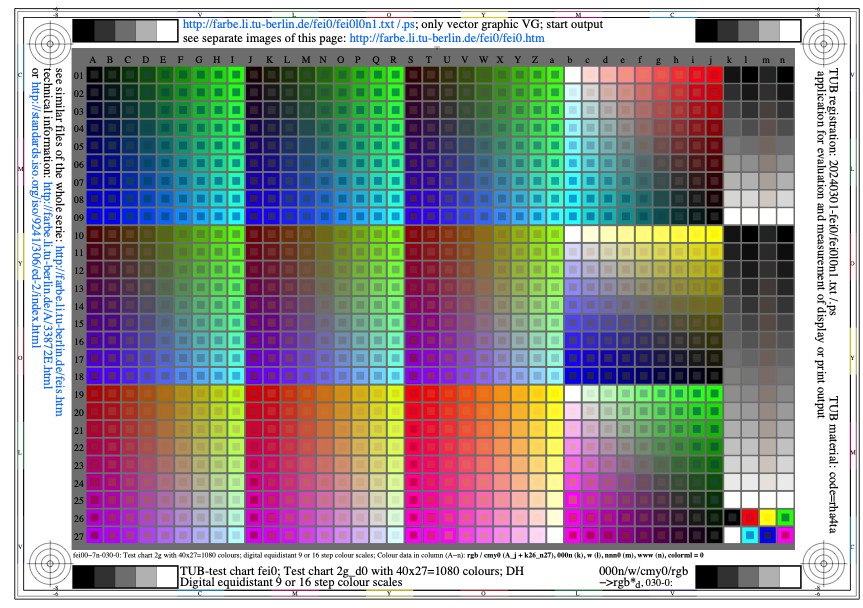
Image fei0l0n1.jpg: Output in format A6 of the file
fei0l0np.pdf, see
fei0l0n1.
PS /
TXT /
PDF /
jpg
fei0: TUB-test chart fei0; Under development
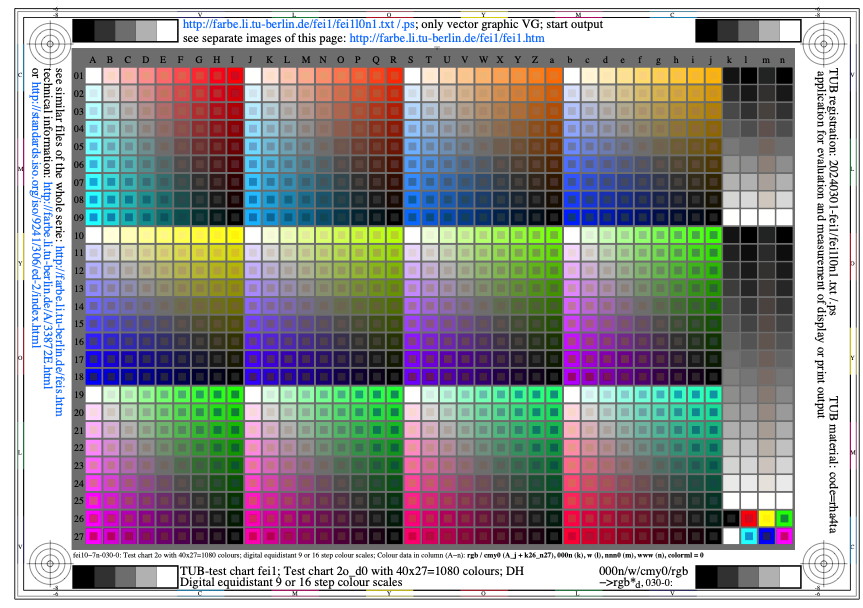
Image fei1l0n1.jpg: Output in format A6 of the file
fei1l0np.pdf, see
fei1l0n1.
PS /
TXT /
PDF /
jpg
fei1: TUB-test chart fei1; Under development

Image fei2l0n1.jpg: Output in format A6 of the file
fei2l0np.pdf, see
fei2l0n1.
PS /
TXT /
PDF /
jpg
fei2: TUB-test chart fei2; Under development

Image fei3l0n1.jpg: Output in format A6 of the file
fei3l0np.pdf, see
fei3l0n1.
PS /
TXT /
PDF /
jpg
fei3: TUB-test chart fei3; Under development

Image fei4l0n1.jpg: Output in format A6 of the file
fei4l0np.pdf, see
fei4l0n1.
PS /
TXT /
PDF /
jpg
fei4: TUB-test chart fei4; Under development

Image fei5l0n1.jpg: Output in format A6 of the file
fei5l0np.pdf, see
fei5l0n1.
PS /
TXT /
PDF /
jpg
fei5: TUB-test chart fei5; Under development

Image fei6l0n1.jpg: Output in format A6 of the file
fei6l0np.pdf, see
fei6l0n1.
PS /
TXT /
PDF /
jpg
fei6: TUB-test chart fei6; Under development

Image fei7l0n1.jpg: Output in format A6 of the file
fei7l0np.pdf, see
fei7l0n1.
PS /
TXT /
PDF /
jpg
fei7: TUB-test chart fei7; Under development
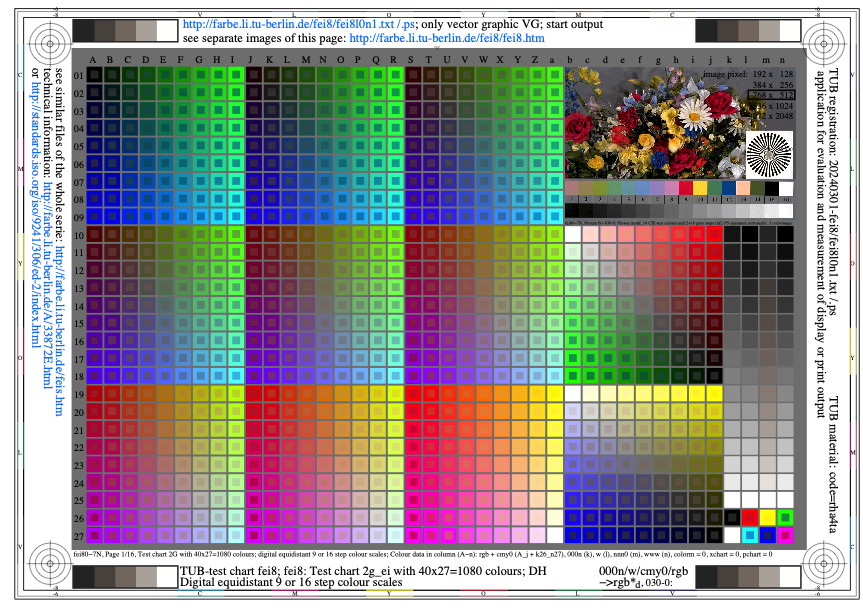
Image fei8l0n1.jpg: Output in format A6 of the file
fei8l0np.pdf, see
fei8l0n1.
PS /
TXT /
PDF /
jpg
fei8: TUB-test chart fei8; Under development
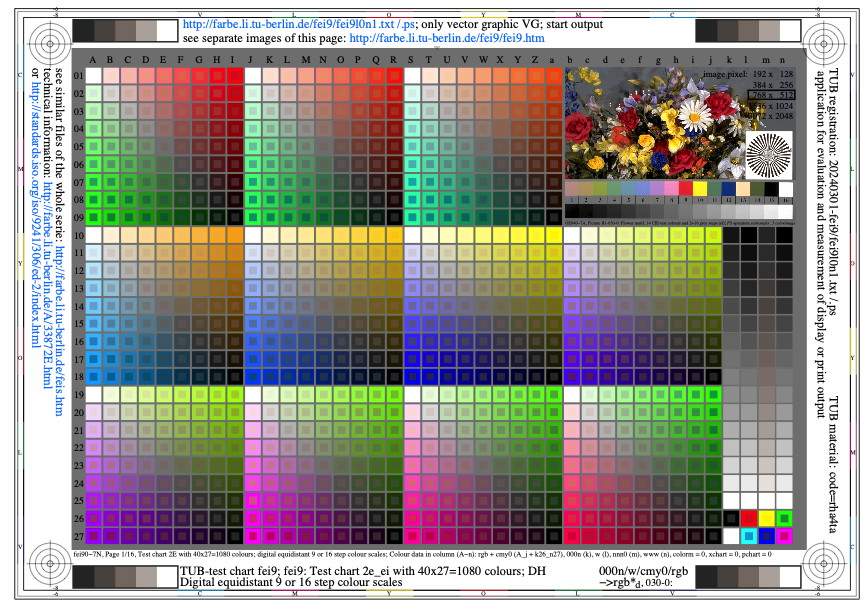
Image fei9l0n1.jpg: Output in format A6 of the file
fei9l0np.pdf, see
fei9l0n1.
PS /
TXT /
PDF /
jpg
fei9: TUB-test chart fei9; Under development
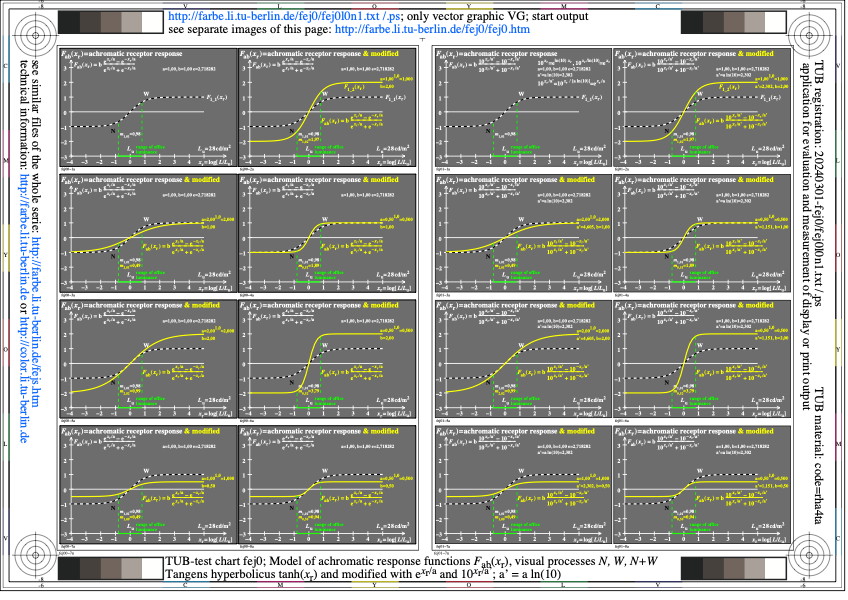
Image fej0l0n1.jpg: Output in format A6 of the file
fej0l0np.pdf, see
fej0l0n1.
PS /
TXT /
PDF /
jpg
fej0: TUB-test chart fej0; Under development
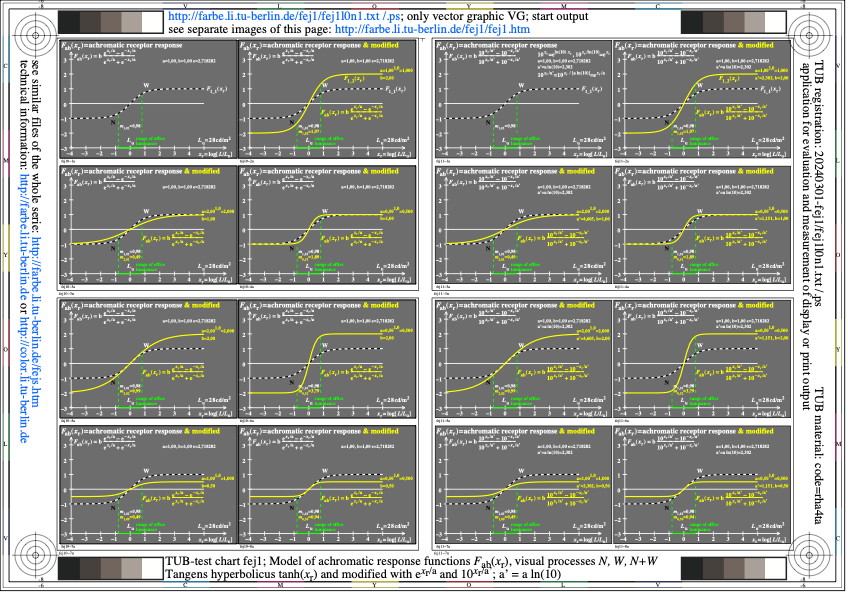
Image fej1l0n1.jpg: Output in format A6 of the file
fej1l0np.pdf, see
fej1l0n1.
PS /
TXT /
PDF /
jpg
fej1: TUB-test chart fej1; Under development
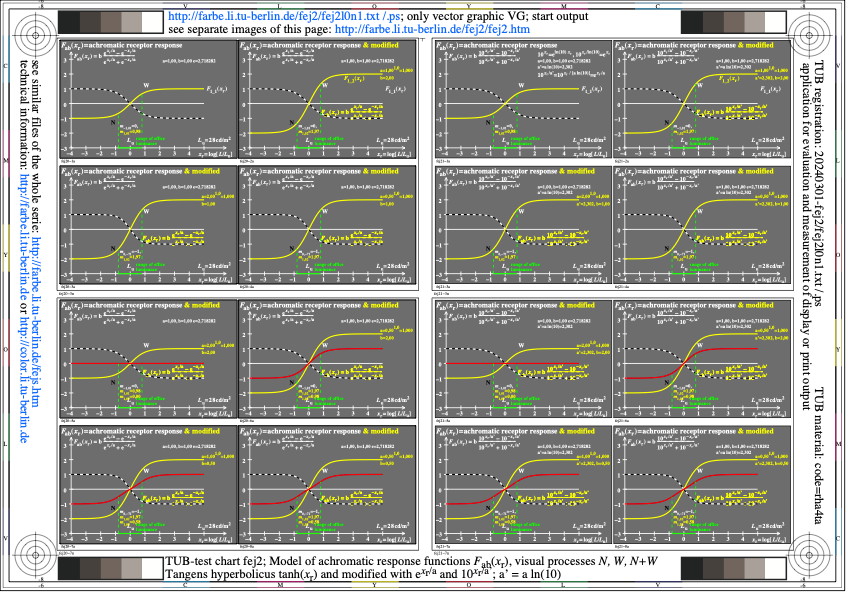
Image fej2l0n1.jpg: Output in format A6 of the file
fej2l0np.pdf, see
fej2l0n1.
PS /
TXT /
PDF /
jpg
fej2: TUB-test chart fej2; Under development

Image fej3l0n1.jpg: Output in format A6 of the file
fej3l0np.pdf, see
fej3l0n1.
PS /
TXT /
PDF /
jpg
fej3: TUB-test chart fej3; Under development
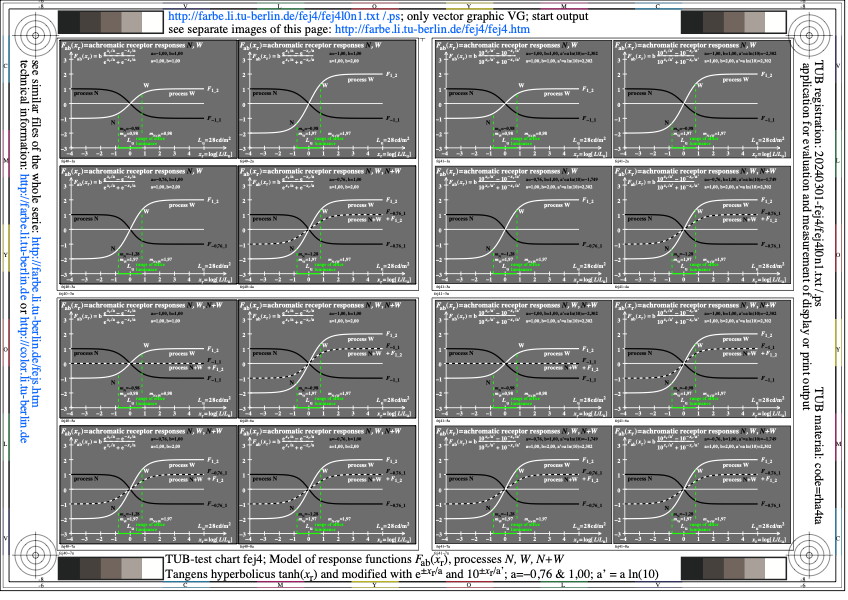
Image fej4l0n1.jpg: Output in format A6 of the file
fej4l0np.pdf, see
fej4l0n1.
PS /
TXT /
PDF /
jpg
fej4: TUB-test chart fej4; Under development

Image fej5l0n1.jpg: Output in format A6 of the file
fej5l0np.pdf, see
fej5l0n1.
PS /
TXT /
PDF /
jpg
fej5: TUB-test chart fej5; Under development
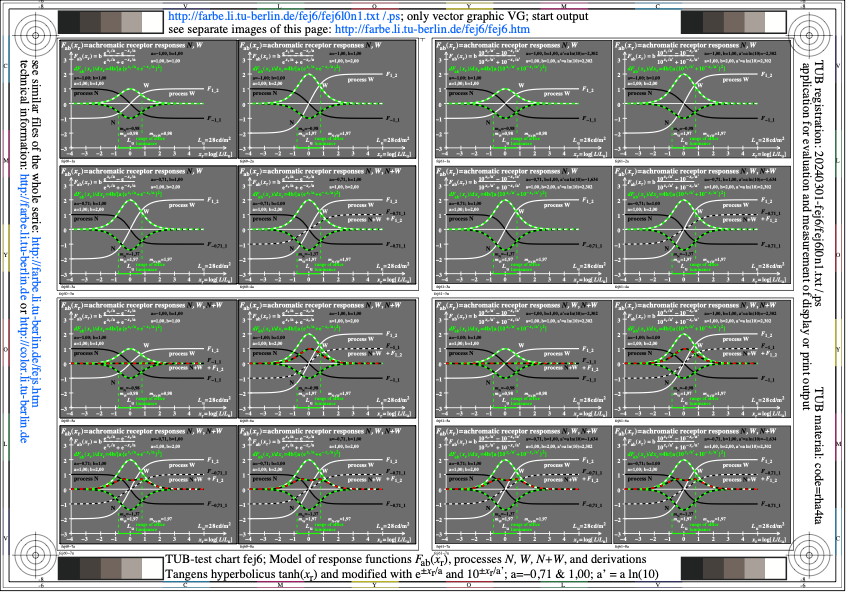
Image fej6l0n1.jpg: Output in format A6 of the file
fej6l0np.pdf, see
fej6l0n1.
PS /
TXT /
PDF /
jpg
fej6: TUB-test chart fej6; Under development

Image fej7l0n1.jpg: Output in format A6 of the file
fej7l0np.pdf, see
fej7l0n1.
PS /
TXT /
PDF /
jpg
fej7: TUB-test chart fej7; Under development
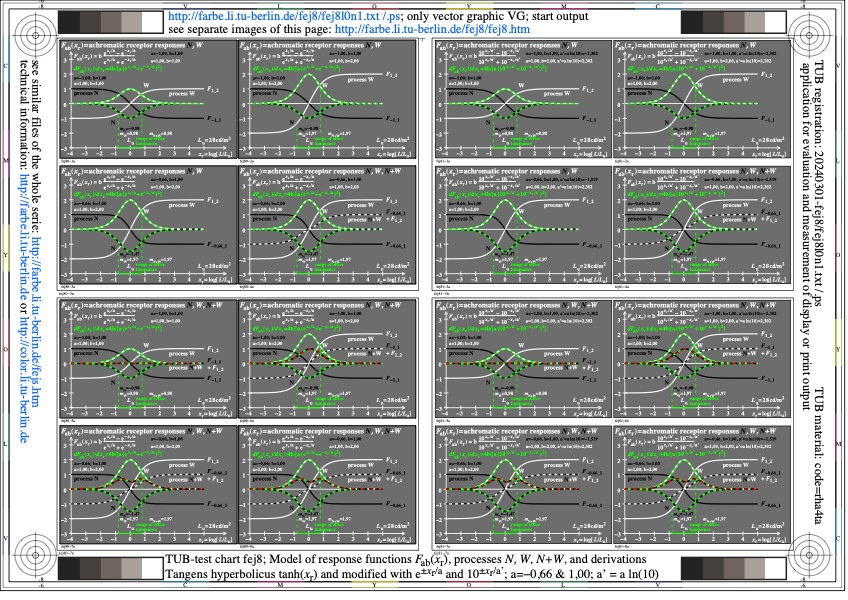
Image fej8l0n1.jpg: Output in format A6 of the file
fej8l0np.pdf, see
fej8l0n1.
PS /
TXT /
PDF /
jpg
fej8: TUB-test chart fej8; Under development
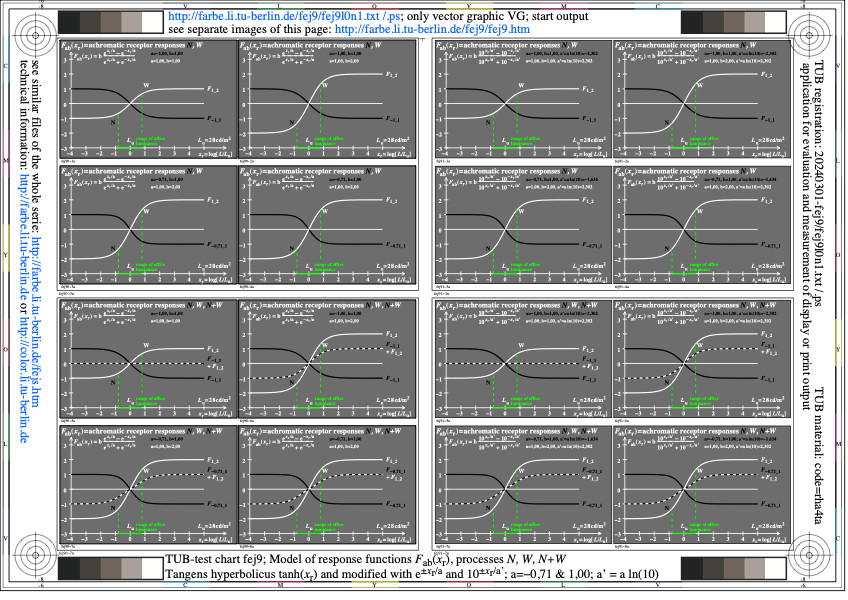
Image fej9l0n1.jpg: Output in format A6 of the file
fej9l0np.pdf, see
fej9l0n1.
PS /
TXT /
PDF /
jpg
fej9: TUB-test chart fej9; Under development
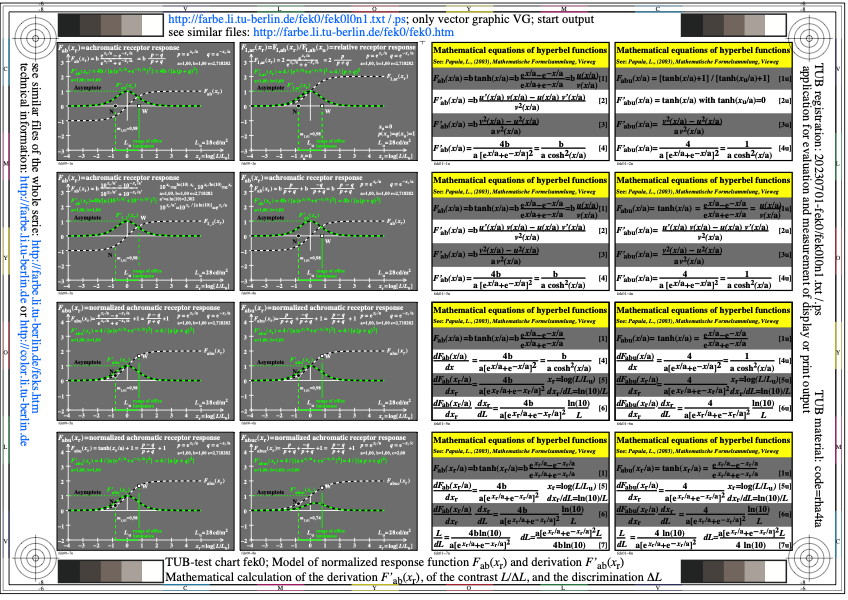
Image fek0l0n1.jpg: Output in format A6 of the file
fek0l0np.pdf, see
fek0l0n1.
PS /
TXT /
PDF /
jpg
fek0: TUB-test chart fek0; Under development
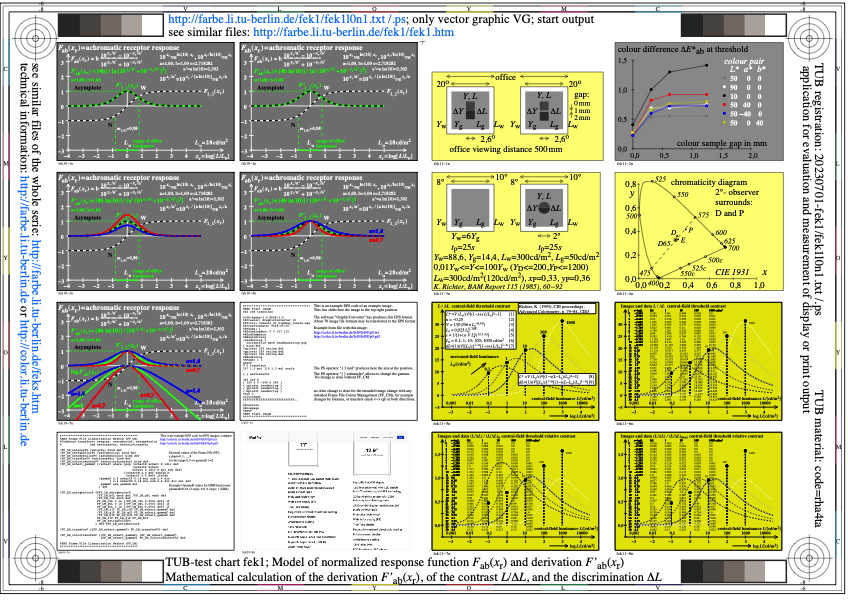
Image fek1l0n1.jpg: Output in format A6 of the file
fek1l0np.pdf, see
fek1l0n1.
PS /
TXT /
PDF /
jpg
fek1: TUB-test chart fek1; Under development
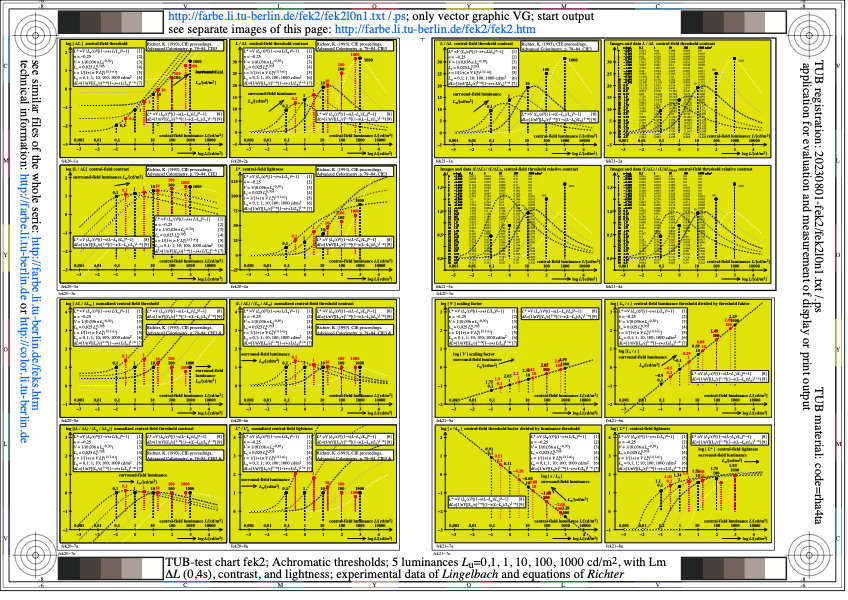
Image fek2l0n1.jpg: Output in format A6 of the file
fek2l0np.pdf, see
fek2l0n1.
PS /
TXT /
PDF /
jpg
fek2: TUB-test chart fek2; Under development

Image fek3l0n1.jpg: Output in format A6 of the file
fek3l0np.pdf, see
fek3l0n1.
PS /
TXT /
PDF /
jpg
fek3: TUB-test chart fek3; Under development
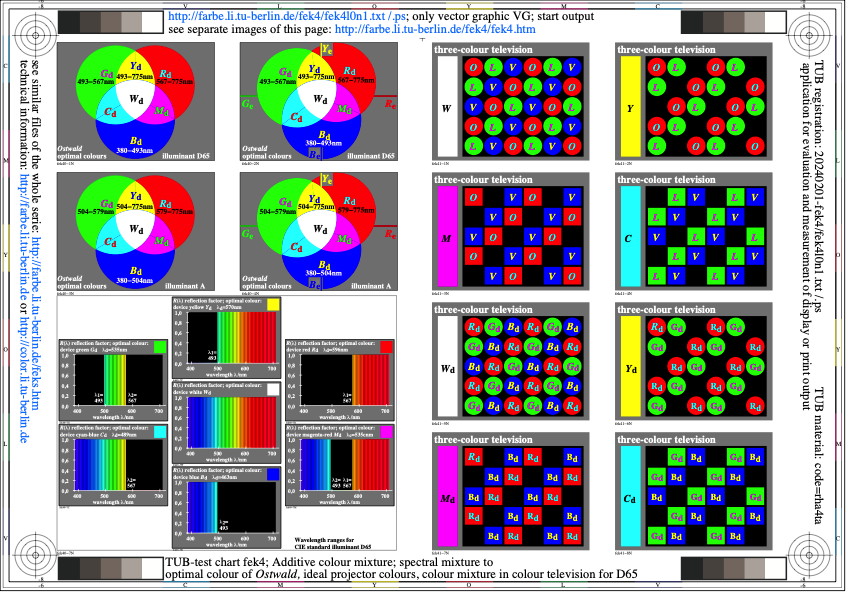
Image fek4l0n1.jpg: Output in format A6 of the file
fek4l0np.pdf, see
fek4l0n1.
PS /
TXT /
PDF /
jpg
fek4: TUB-test chart fek4; Under development
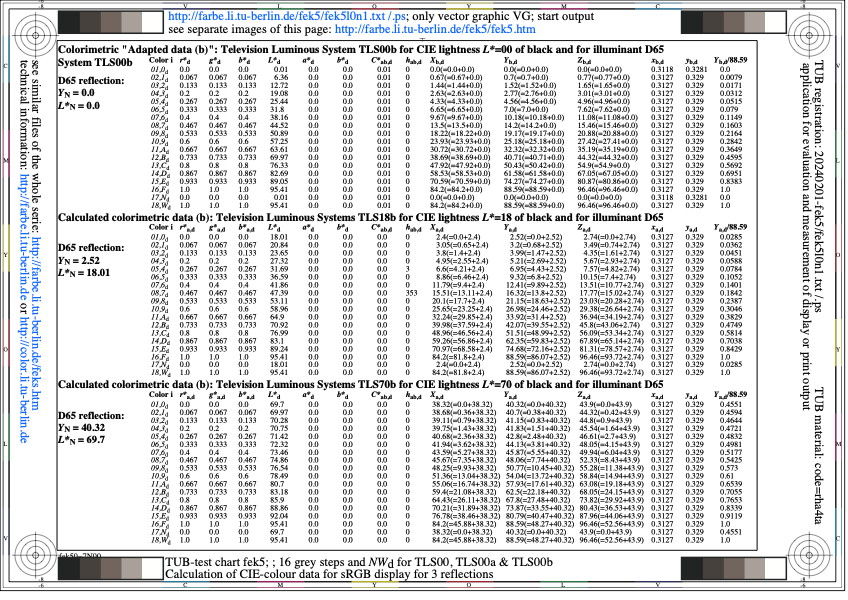
Image fek5l0n1.jpg: Output in format A6 of the file
fek5l0np.pdf, see
fek5l0n1.
PS /
TXT /
PDF /
jpg
fek5: TUB-test chart fek5; Under development
Image fek6l0n1.jpg: Output in format A6 of the file
fek6l0np.pdf, see
fek6l0n1.
PS /
TXT /
PDF /
jpg
fek6: TUB-test chart fek6; Under development
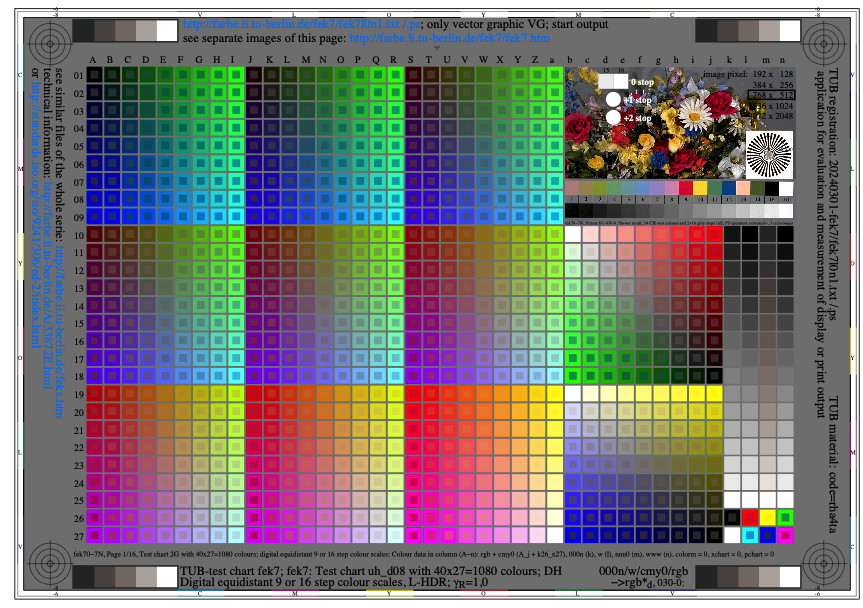
Image fek7l0n1.jpg: Output in format A6 of the file
fek7l0np.pdf, see
fek7l0n1.
PS /
TXT /
PDF /
jpg
fek7: TUB-test chart fek7; Under development

Image fek8l0n1.jpg: Output in format A6 of the file
fek8l0np.pdf, see
fek8l0n1.
PS /
TXT /
PDF /
jpg
fek8: TUB-test chart fek8; Under development

Image fek9l0n1.jpg: Output in format A6 of the file
fek9l0np.pdf, see
fek9l0n1.
PS /
TXT /
PDF /
jpg
fek9: TUB-test chart fek9; Under development

Image fel0l0n1.jpg: Output in format A6 of the file
fel0l0np.pdf, see
fel0l0n1.
PS /
TXT /
PDF /
jpg
fel0: TUB-test chart fel0; Under development
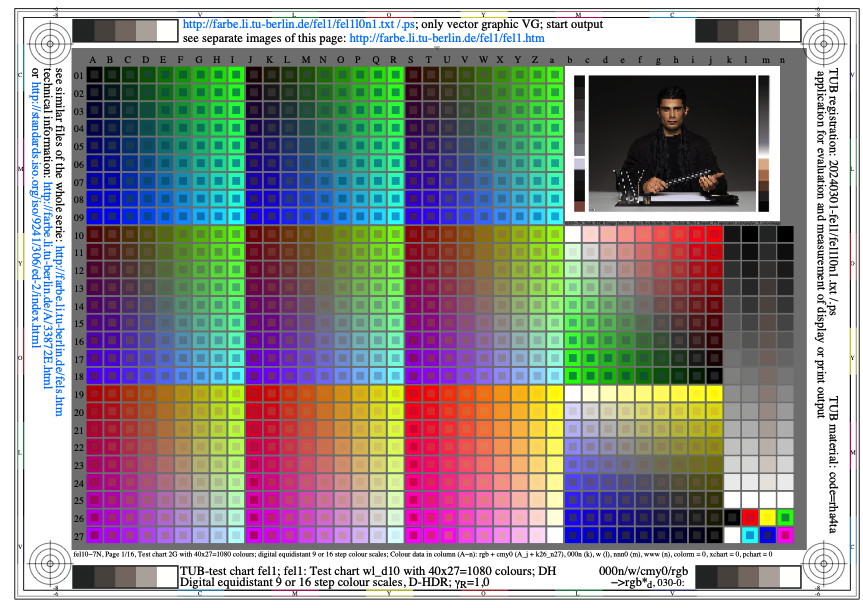
Image fel1l0n1.jpg: Output in format A6 of the file
fel1l0np.pdf, see
fel1l0n1.
PS /
TXT /
PDF /
jpg
fel1: TUB-test chart fel1; Under development
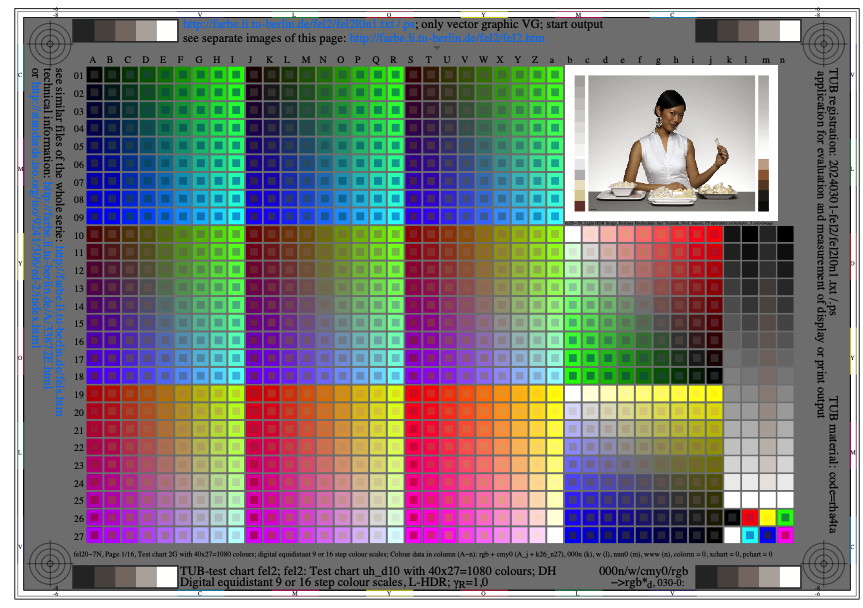
Image fel2l0n1.jpg: Output in format A6 of the file
fel2l0np.pdf, see
fel2l0n1.
PS /
TXT /
PDF /
jpg
fel2: TUB-test chart fel2; Under development
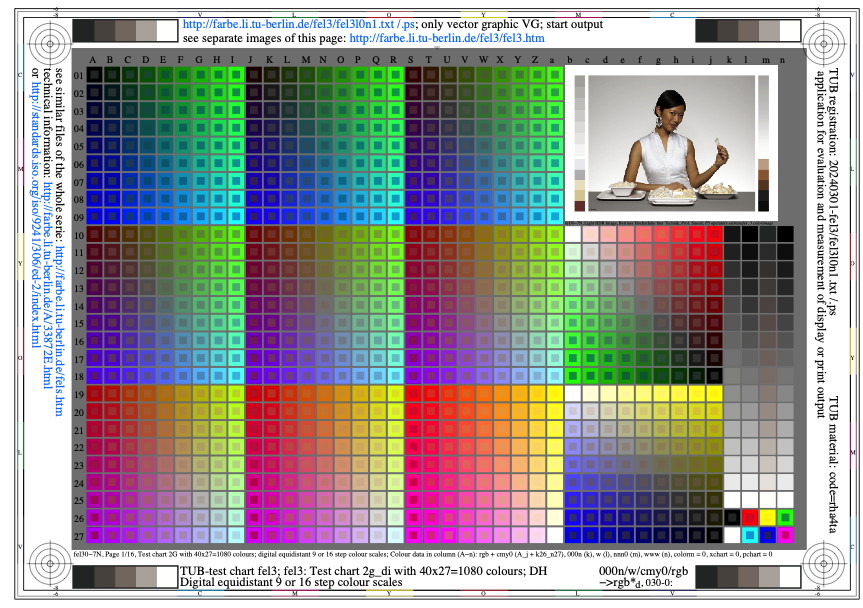
Image fel3l0n1.jpg: Output in format A6 of the file
fel3l0np.pdf, see
fel3l0n1.
PS /
TXT /
PDF /
jpg
fel3: TUB-test chart fel3; Under development

Image fel4l0n1.jpg: Output in format A6 of the file
fel4l0np.pdf, see
fel4l0n1.
PS /
TXT /
PDF /
jpg
fel4: TUB-test chart fel4; Under development
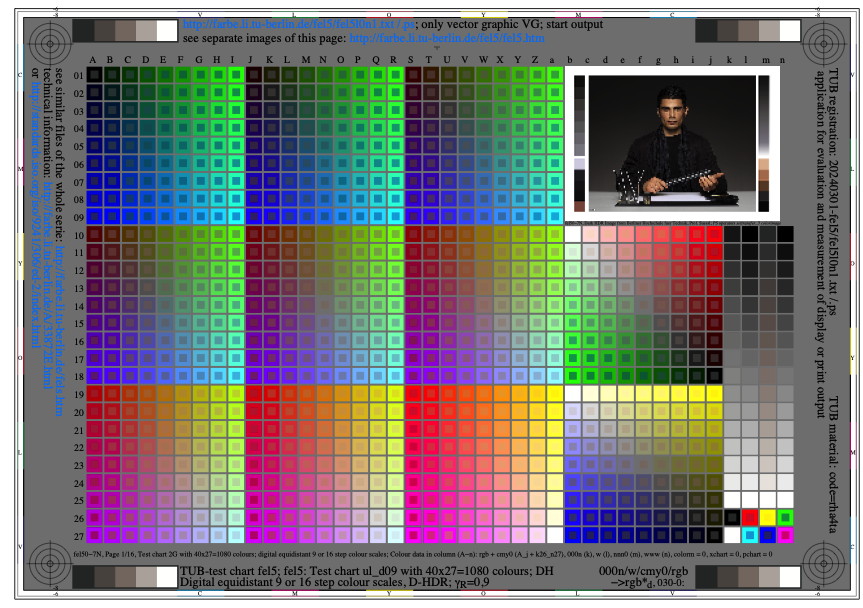
Image fel5l0n1.jpg: Output in format A6 of the file
fel5l0np.pdf, see
fel5l0n1.
PS /
TXT /
PDF /
jpg
fel5: TUB-test chart fel5; Under development

Image fel6l0n1.jpg: Output in format A6 of the file
fel6l0np.pdf, see
fel6l0n1.
PS /
TXT /
PDF /
jpg
fel6: TUB-test chart fel6; Under development

Image fel7l0n1.jpg: Output in format A6 of the file
fel7l0np.pdf, see
fel7l0n1.
PS /
TXT /
PDF /
jpg
fel7: TUB-test chart fel7; Under development

Image fel8l0n1.jpg: Output in format A6 of the file
fel8l0np.pdf, see
fel8l0n1.
PS /
TXT /
PDF /
jpg
fel8: TUB-test chart fel8; Under development

Image fel9l0n1.jpg: Output in format A6 of the file
fel9l0np.pdf, see
fel9l0n1.
PS /
TXT /
PDF /
jpg
fel9: TUB-test chart fel9; Under development
Image fem0l0n1.jpg: Output in format A6 of the file
fem0l0np.pdf, see
fem0l0n1.
PS /
TXT /
PDF /
jpg
fem0: TUB-test chart fem0; Under development
Image fem1l0n1.jpg: Output in format A6 of the file
fem1l0np.pdf, see
fem1l0n1.
PS /
TXT /
PDF /
jpg
fem1: TUB-test chart fem1; Under development
Image fem2l0n1.jpg: Output in format A6 of the file
fem2l0np.pdf, see
fem2l0n1.
PS /
TXT /
PDF /
jpg
fem2: TUB-test chart fem2; Under development
Image fem3l0n1.jpg: Output in format A6 of the file
fem3l0np.pdf, see
fem3l0n1.
PS /
TXT /
PDF /
jpg
fem3: TUB-test chart fem3; Under development
Image fem4l0n1.jpg: Output in format A6 of the file
fem4l0np.pdf, see
fem4l0n1.
PS /
TXT /
PDF /
jpg
fem4: TUB-test chart fem4; Under development
Image fem5l0n1.jpg: Output in format A6 of the file
fem5l0np.pdf, see
fem5l0n1.
PS /
TXT /
PDF /
jpg
fem5: TUB-test chart fem5; Under development
Image fem6l0n1.jpg: Output in format A6 of the file
fem6l0np.pdf, see
fem6l0n1.
PS /
TXT /
PDF /
jpg
fem6: TUB-test chart fem6; Under development
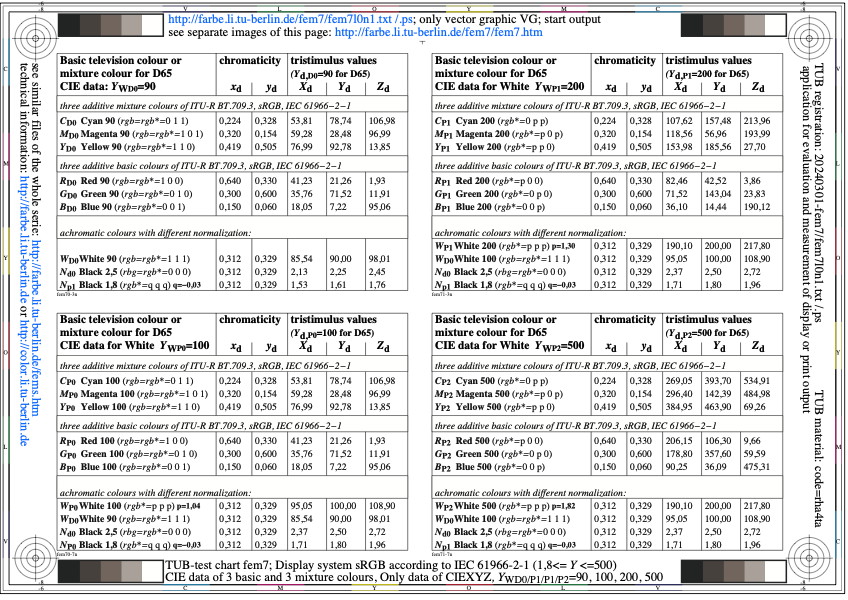
Image fem7l0n1.jpg: Output in format A6 of the file
fem7l0np.pdf, see
fem7l0n1.
PS /
TXT /
PDF /
jpg
fem7: TUB-test chart fem7; Under development
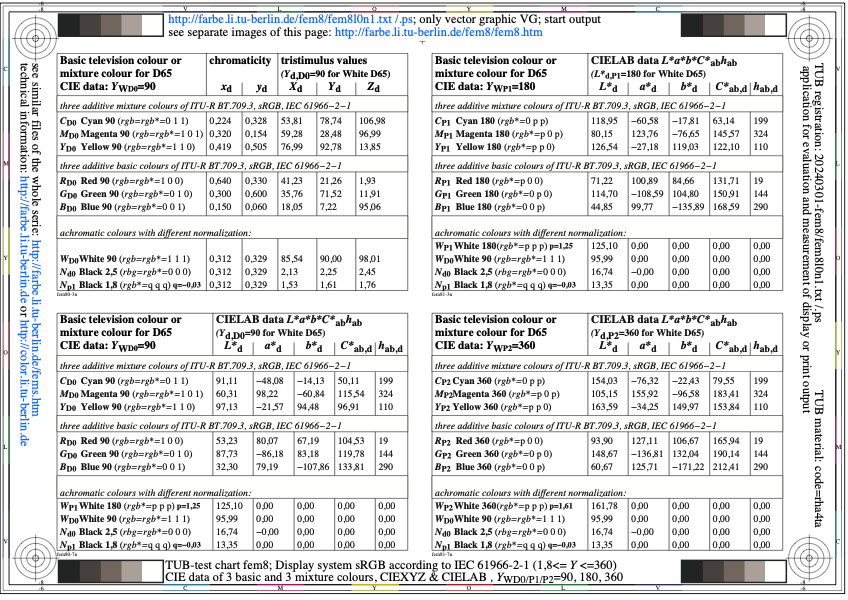
Image fem8l0n1.jpg: Output in format A6 of the file
fem8l0np.pdf, see
fem8l0n1.
PS /
TXT /
PDF /
jpg
fem8: TUB-test chart fem8; Under development
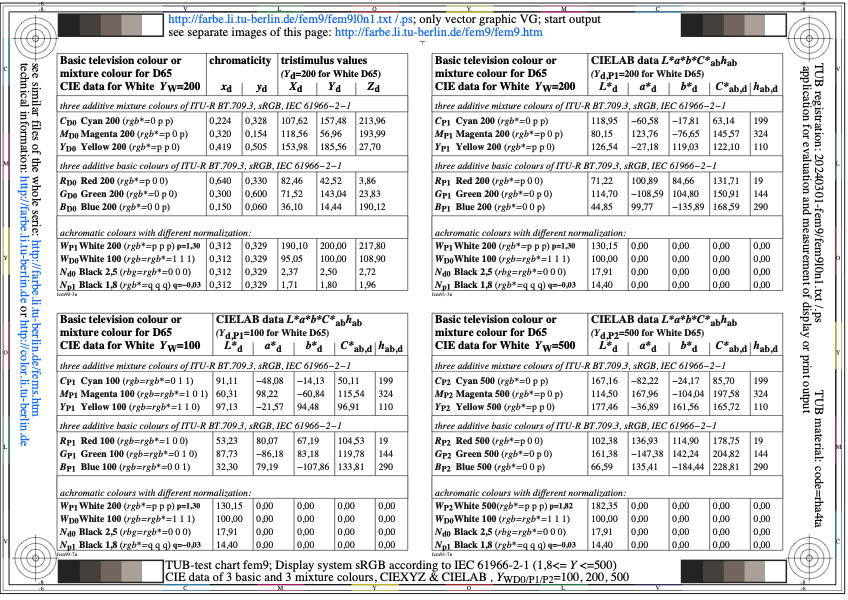
Image fem9l0n1.jpg: Output in format A6 of the file
fem9l0np.pdf, see
fem9l0n1.
PS /
TXT /
PDF /
jpg
fem9: TUB-test chart fem9; Under development
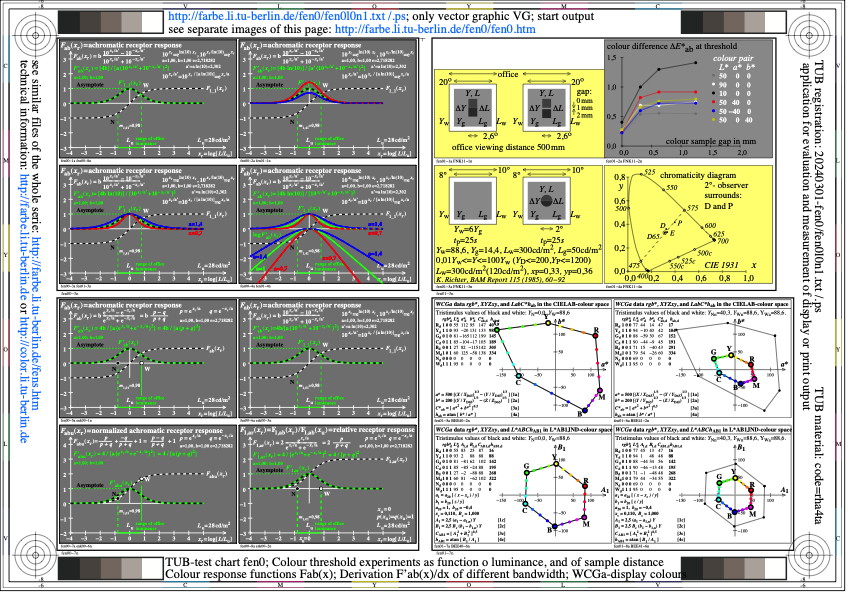
Image fen0l0n1.jpg: Output in format A6 of the file
fen0l0np.pdf, see
fen0l0n1.
PS /
TXT /
PDF /
jpg
fen0: TUB-test chart fen0; Under development
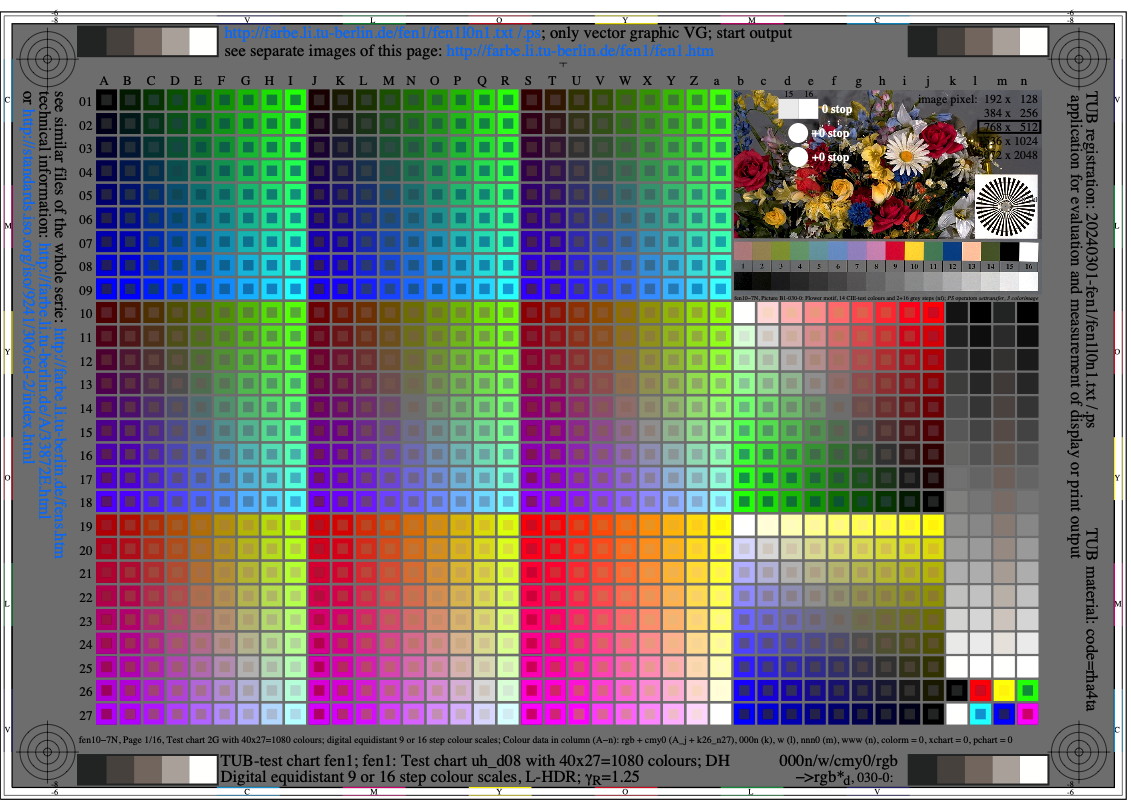
Image fen1l0n1.jpg: Output in format A6 of the file
fen1l0np.pdf, see
fen1l0n1.
PS /
TXT /
PDF /
jpg
fen1: TUB-test chart fen1; Under development

Image fen2l0n1.jpg: Output in format A6 of the file
fen2l0np.pdf, see
fen2l0n1.
PS /
TXT /
PDF /
jpg
fen2: TUB-test chart fen2; Under development

Image fen3l0n1.jpg: Output in format A6 of the file
fen3l0np.pdf, see
fen3l0n1.
PS /
TXT /
PDF /
jpg
fen3: TUB-test chart fen3; Under development
Image fen4l0n1.jpg: Output in format A6 of the file
fen4l0np.pdf, see
fen4l0n1.
PS /
TXT /
PDF /
jpg
fen4: TUB-test chart fen4; Under development
Image fen5l0n1.jpg: Output in format A6 of the file
fen5l0np.pdf, see
fen5l0n1.
PS /
TXT /
PDF /
jpg
fen5: TUB-test chart fen5; Under development
Image fen6l0n1.jpg: Output in format A6 of the file
fen6l0np.pdf, see
fen6l0n1.
PS /
TXT /
PDF /
jpg
fen6: TUB-test chart fen6; Under development
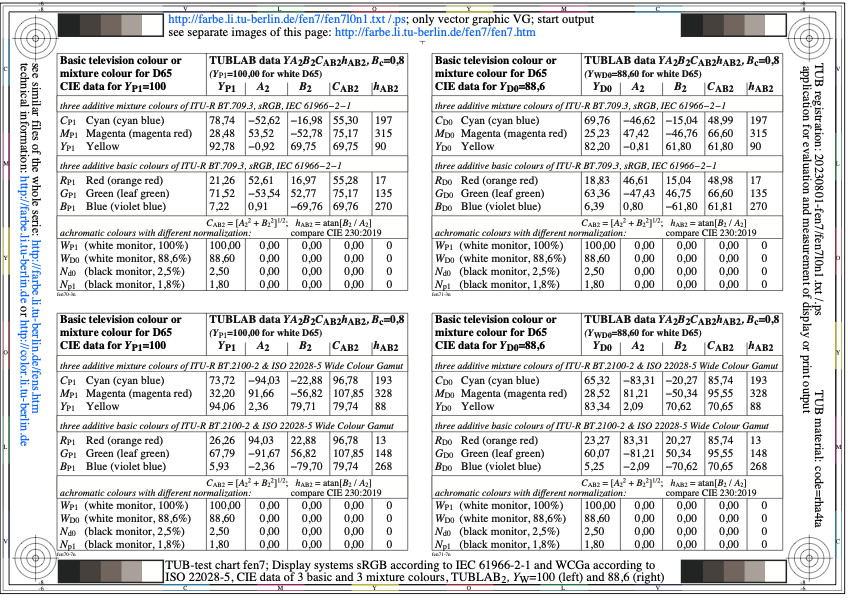
Image fen7l0n1.jpg: Output in format A6 of the file
fen7l0np.pdf, see
fen7l0n1.
PS /
TXT /
PDF /
jpg
fen7: TUB-test chart fen7; Under development
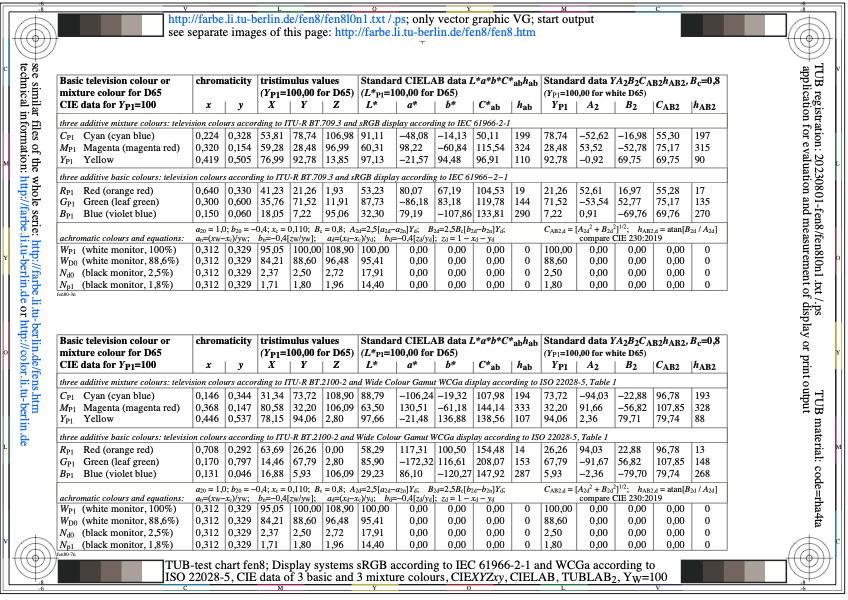
Image fen8l0n1.jpg: Output in format A6 of the file
fen8l0np.pdf, see
fen8l0n1.
PS /
TXT /
PDF /
jpg
fen8: TUB-test chart fen8; Under development
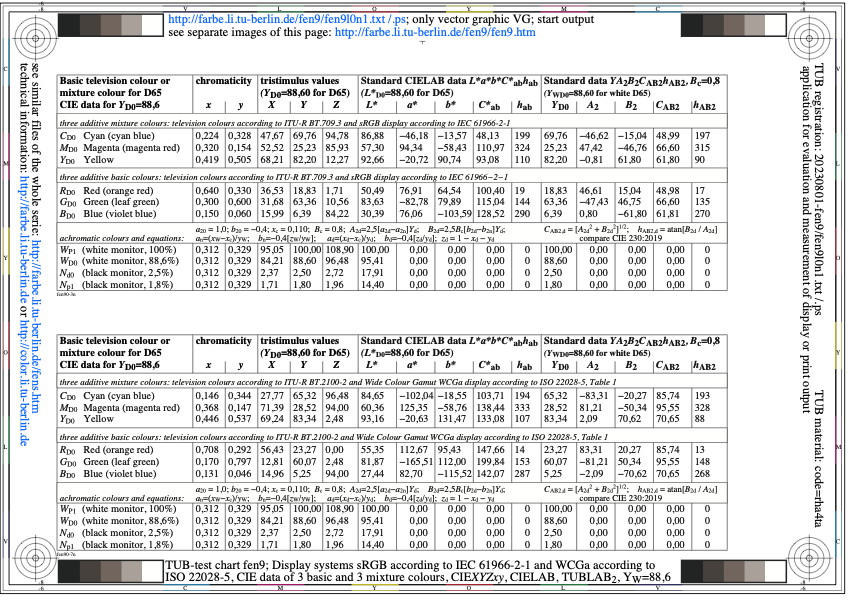
Image fen9l0n1.jpg: Output in format A6 of the file
fen9l0np.pdf, see
fen9l0n1.
PS /
TXT /
PDF /
jpg
fen9: TUB-test chart fen9; Under development
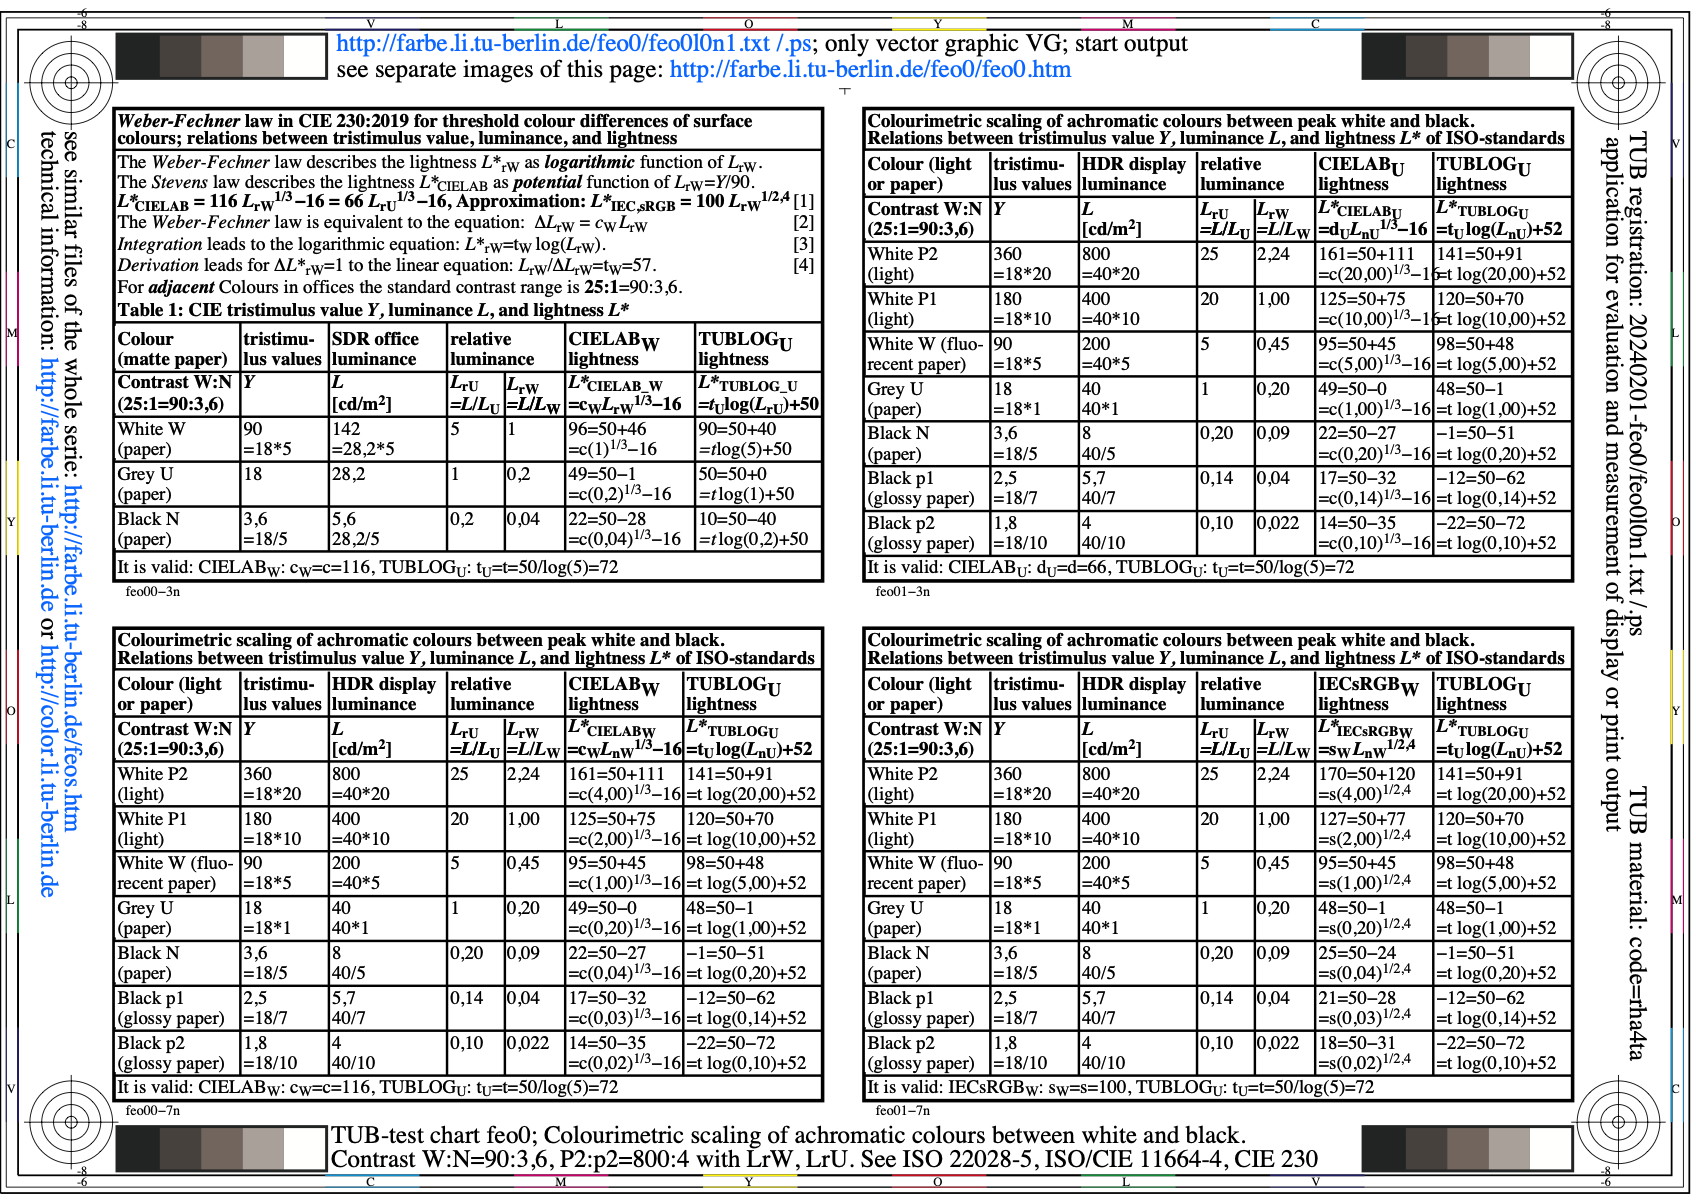
Image feo0l0n1.jpg: Output in format A6 of the file
feo0l0np.pdf, see
feo0l0n1.
PS /
TXT /
PDF /
jpg
feo0: TUB-test chart feo0; Under development
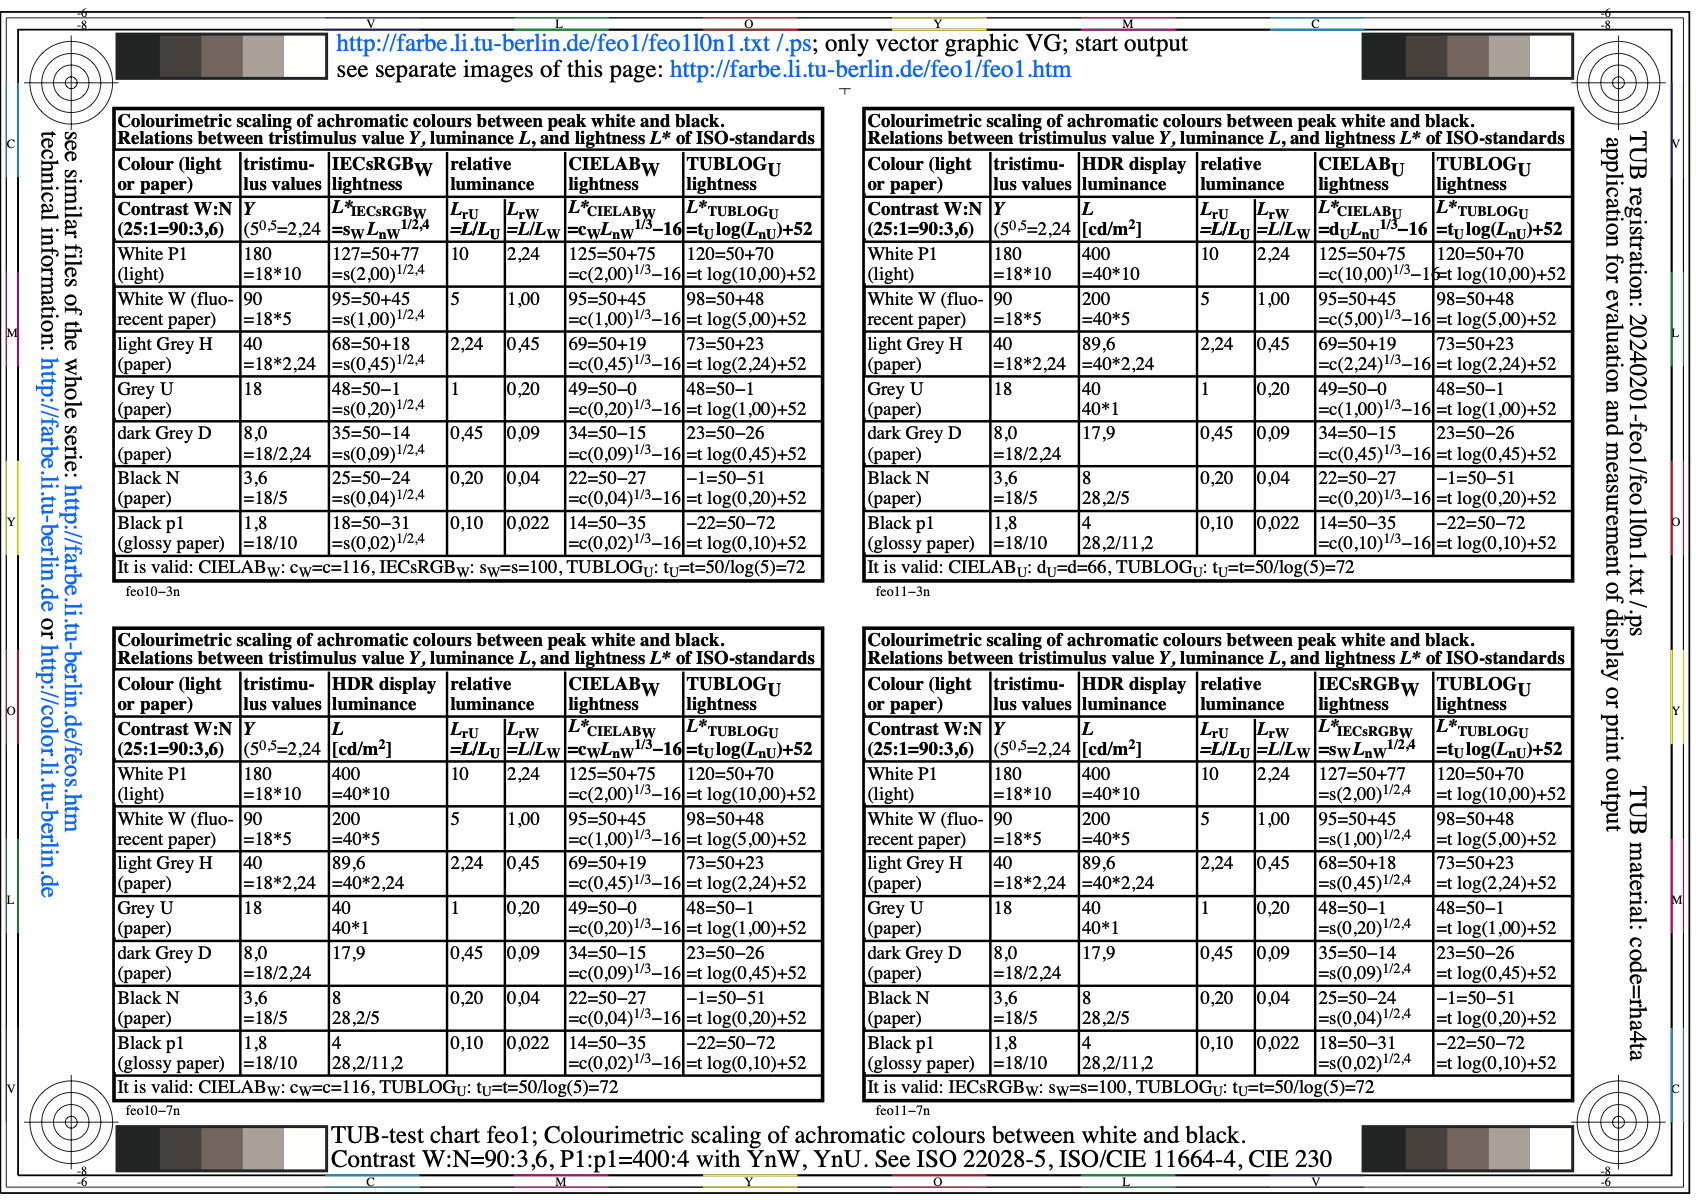
Image feo1l0n1.jpg: Output in format A6 of the file
feo1l0np.pdf, see
feo1l0n1.
PS /
TXT /
PDF /
jpg
feo1: TUB-test chart feo1; Under development

Image feo2l0n1.jpg: Output in format A6 of the file
feo2l0np.pdf, see
feo2l0n1.
PS /
TXT /
PDF /
jpg
feo2: TUB-test chart feo2; Under development
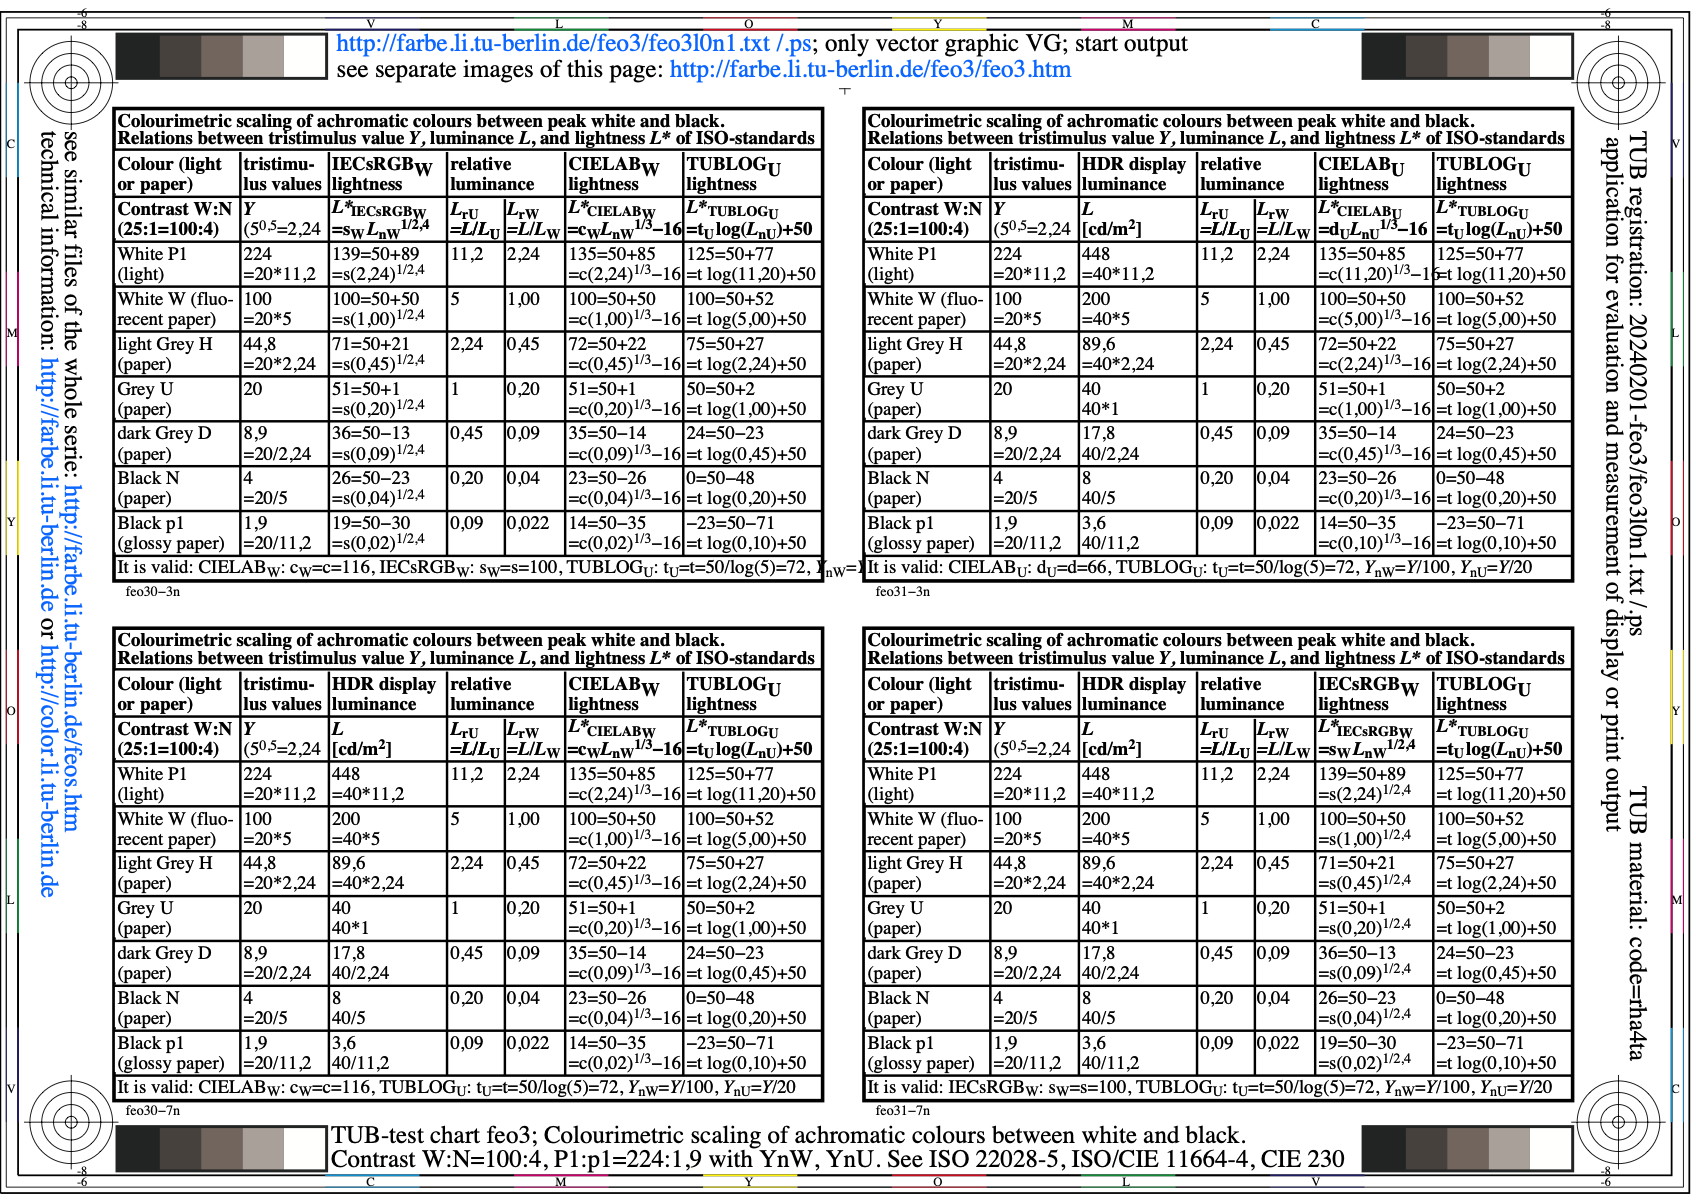
Image feo3l0n1.jpg: Output in format A6 of the file
feo3l0np.pdf, see
feo3l0n1.
PS /
TXT /
PDF /
jpg
feo3: TUB-test chart feo3; Under development

Image feo4l0n1.jpg: Output in format A6 of the file
feo4l0np.pdf, see
feo4l0n1.
PS /
TXT /
PDF /
jpg
feo4: TUB-test chart feo4; Under development
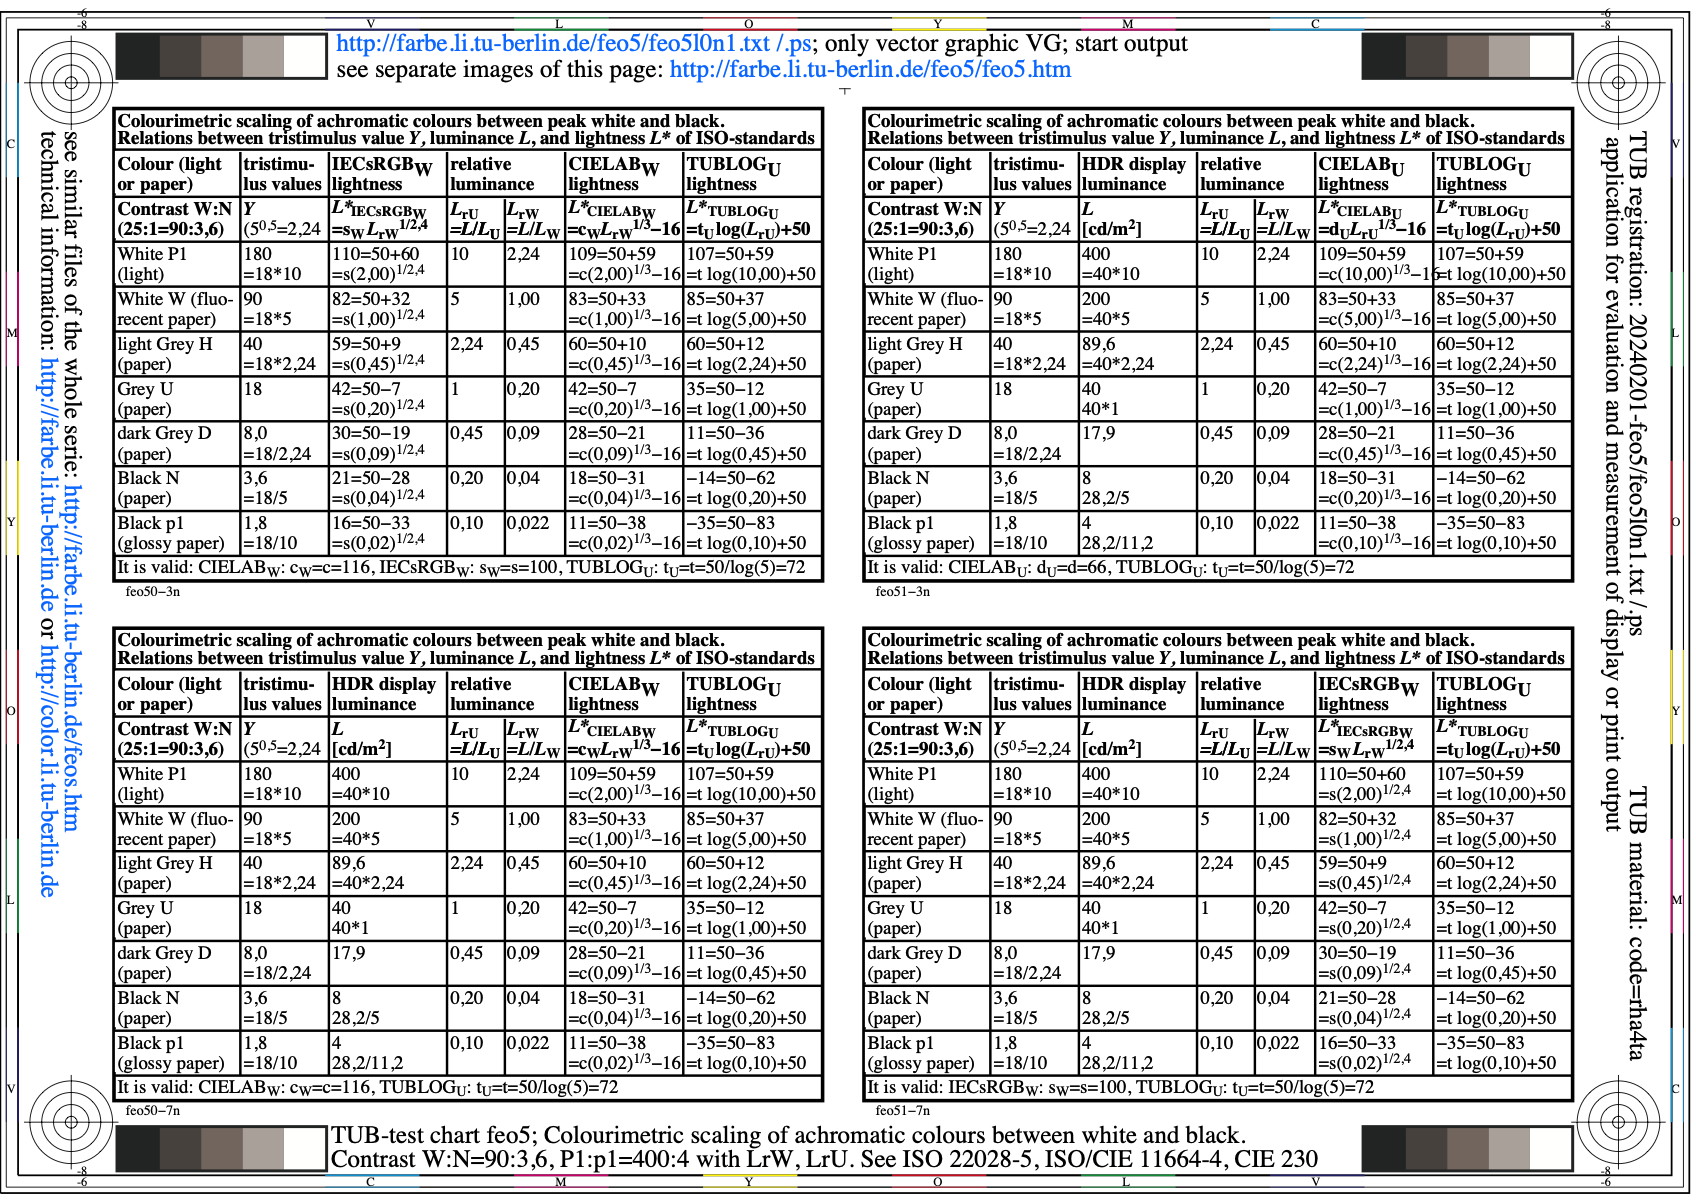
Image feo5l0n1.jpg: Output in format A6 of the file
feo5l0np.pdf, see
feo5l0n1.
PS /
TXT /
PDF /
jpg
feo5: TUB-test chart feo5; Under development

Image feo6l0n1.jpg: Output in format A6 of the file
feo6l0np.pdf, see
feo6l0n1.
PS /
TXT /
PDF /
jpg
feo6: TUB-test chart feo6; Under development

Image feo7l0n1.jpg: Output in format A6 of the file
feo7l0np.pdf, see
feo7l0n1.
PS /
TXT /
PDF /
jpg
feo7: TUB-test chart feo7; Under development

Image feo8l0n1.jpg: Output in format A6 of the file
feo8l0np.pdf, see
feo8l0n1.
PS /
TXT /
PDF /
jpg
feo8: TUB-test chart feo8; Under development
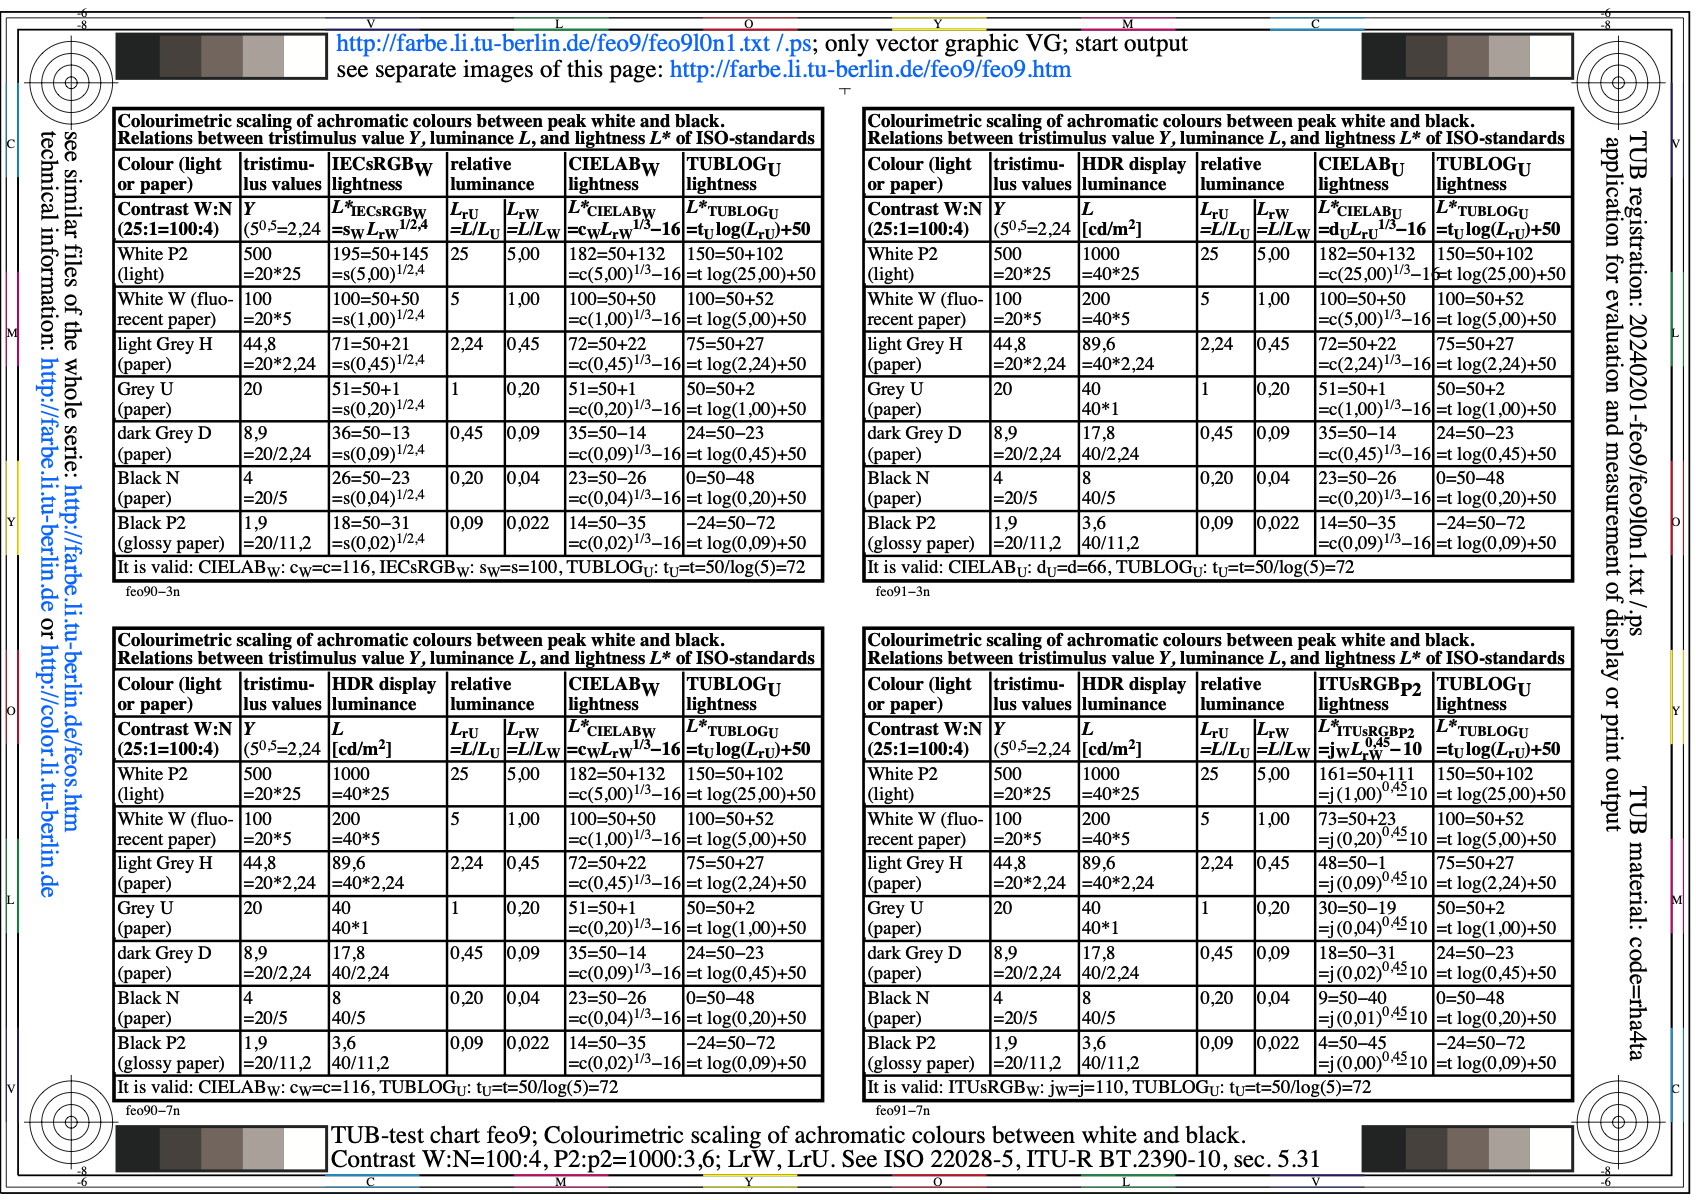
Image feo9l0n1.jpg: Output in format A6 of the file
feo9l0np.pdf, see
feo9l0n1.
PS /
TXT /
PDF /
jpg
feo9: TUB-test chart feo9; Under development
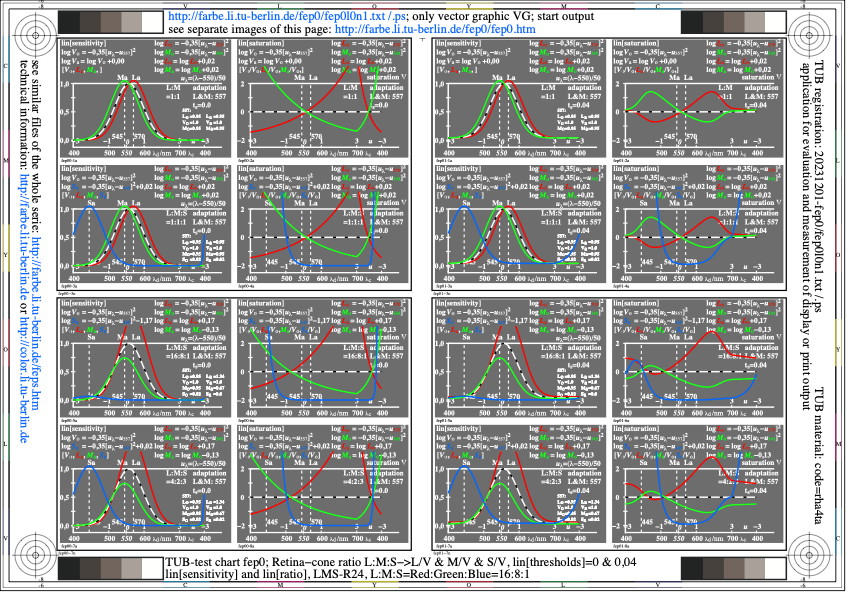
Image fep0l0n1.jpg: Output in format A6 of the file
fep0l0np.pdf, see
fep0l0n1.
PS /
TXT /
PDF /
jpg
fep0: TUB-test chart fep0; LMS-R24-colour vision model
cone ratio L:M:S=red:green:blue=16:8:1
lin[sensitivities], lin[ratios], lin[thresholds]=0&0,04
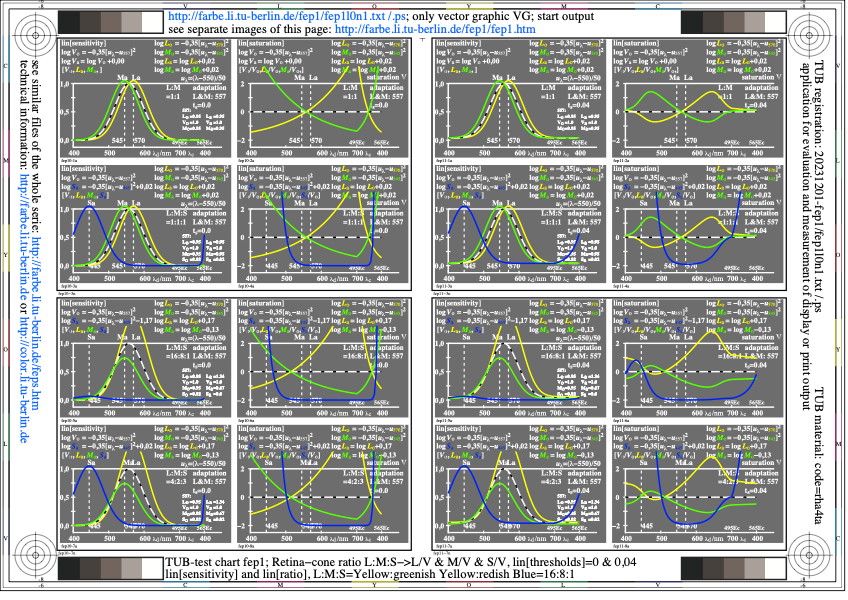
Image fep1l0n1.jpg: Output in format A6 of the file
fep1l0np.pdf, see
fep1l0n1.
PS /
TXT /
PDF /
jpg
fep1: TUB-test chart fep1; LMS-R24-colour vision model
ratio L:M:S=yellow:greenish yellow:redish blue=16:8:1
lin[sensitivities], lin[ratios], lin[thresholds]=0&0,04

Image fep2l0n1.jpg: Output in format A6 of the file
fep2l0np.pdf, see
fep2l0n1.
PS /
TXT /
PDF /
jpg
fep2: TUB-test chart fep2; LMS-R24-colour vision model
adaptation of the sensitivities 570,557,545, LVM->(LVM)/V
lin[sensitivities], lin[ratios], lin[thresholds]=0&0,04
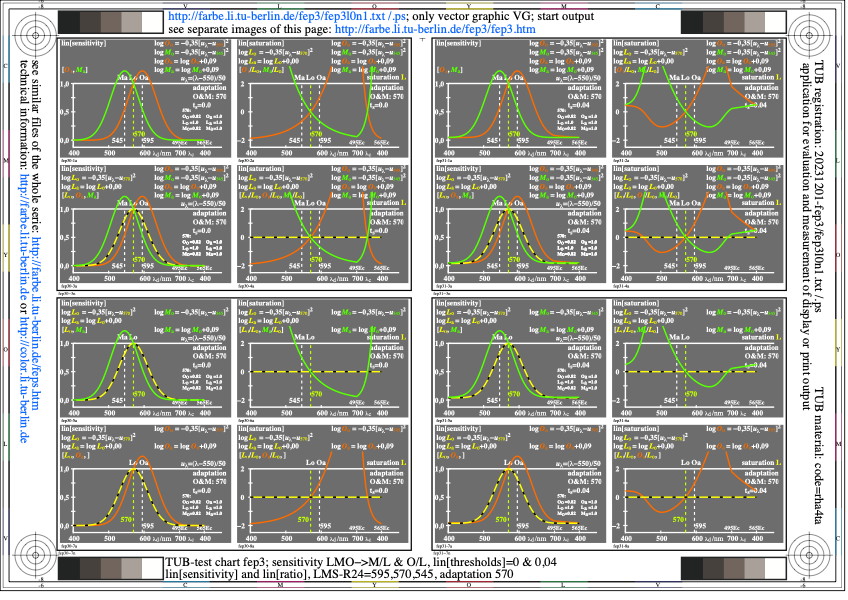
Image fep3l0n1.jpg: Output in format A6 of the file
fep3l0np.pdf, see
fep3l0n1.
PS /
TXT /
PDF /
jpg
fep3: TUB-test chart fep3; LMS-R24-colour vision model
adaptation of the sensitivities 595,570,545, OLM->(OLM)/L
lin[sensitivities], lin[ratios], lin[thresholds]=0&0,04
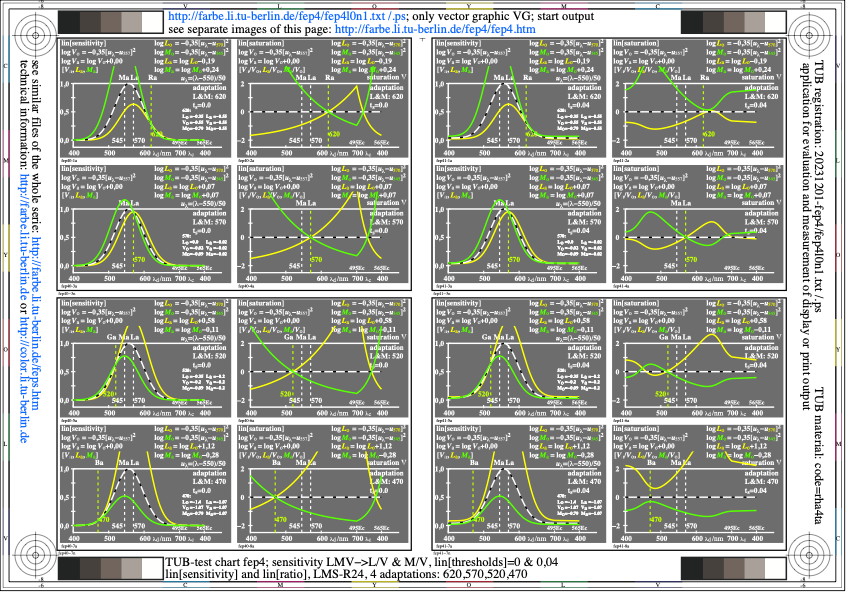
Image fep4l0n1.jpg: Output in format A6 of the file
fep4l0np.pdf, see
fep4l0n1.
PS /
TXT /
PDF /
jpg
fep4: TUB-test chart fep4; LMS-R24-colour vision model
4 adaptations of 620,570,520,470, LVM->(LVM)/V
lin[sensitivities], lin[ratios], lin[thresholds]=0&0,04
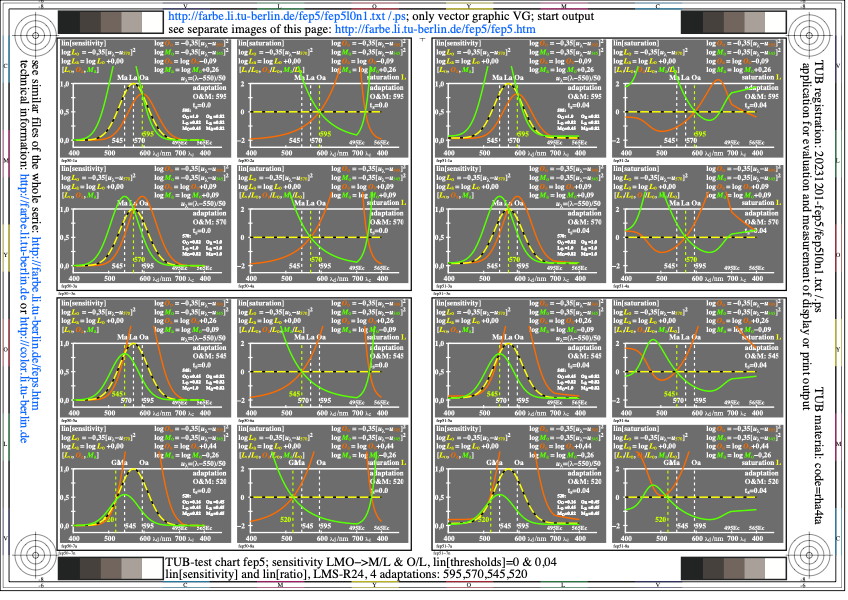
Image fep5l0n1.jpg: Output in format A6 of the file
fep5l0np.pdf, see
fep5l0n1.
PS /
TXT /
PDF /
jpg
fep5: TUB-test chart fep5; LMS-R24-colour vision model
4 adaptations of 620,570,520,470, OLM->(OLM)/L
lin[sensitivities], lin[ratios], lin[thresholds]=0&0,04

Image fep6l0n1.jpg: Output in format A6 of the file
fep6l0np.pdf, see
fep6l0n1.
PS /
TXT /
PDF /
jpg
fep6: TUB-test chart fep6; LMS-R24-colour vision model
4 adaptations of 620,570,520,470, OLM->(OLM)/L
lin[sensitivities], lin[ratios], lin[thresholds]=0&0,04

Image fep7l0n1.jpg: Output in format A6 of the file
fep7l0np.pdf, see
fep7l0n1.
PS /
TXT /
PDF /
jpg
fep7: TUB-test chart fep7; LMS-R24-colour vision model
4 adaptations of 595,570,545,520, OLM->(OLM)/L
lin[sensitivities], lin[ratios], lin[thresholds]=0&0,04
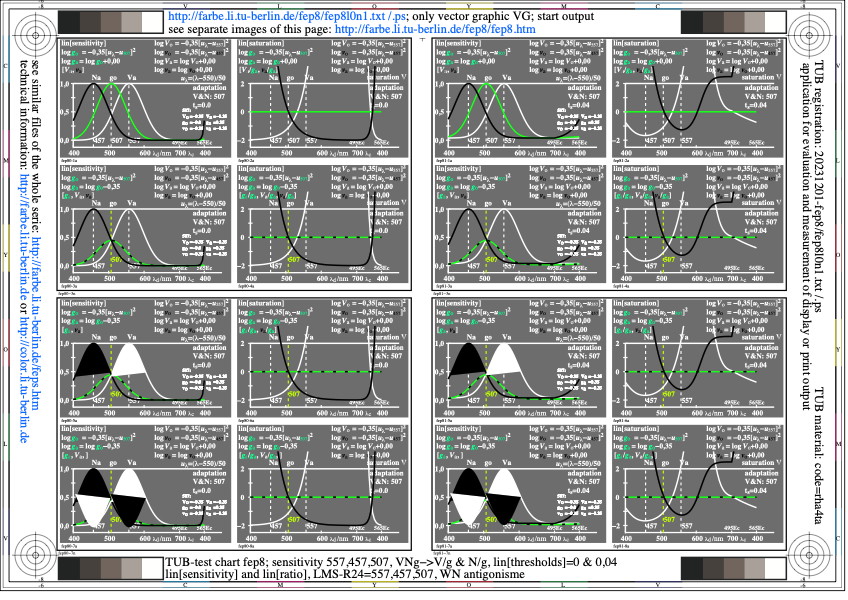
Image fep8l0n1.jpg: Output in format A6 of the file
fep8l0np.pdf, see
fep8l0n1.
PS /
TXT /
PDF /
jpg
fep8: TUB-test chart fep8; LMS-R24-colour vision model
WN antagonisme of sensitivities 547,457, V,N->V/g,N/g
lin[sensitivities], lin[ratios], lin[thresholds]=0&0,04
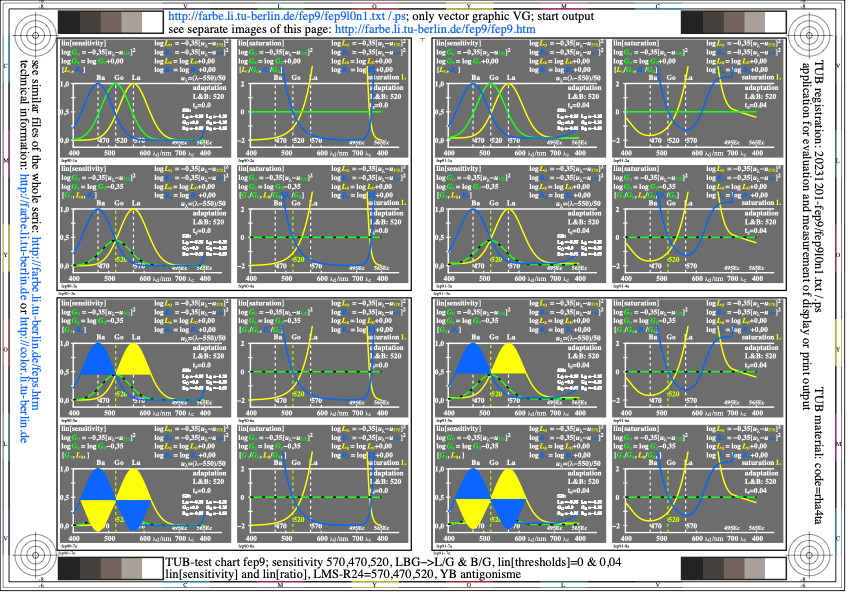
Image fep9l0n1.jpg: Output in format A6 of the file
fep9l0np.pdf, see
fep9l0n1.
PS /
TXT /
PDF /
jpg
fep9: TUB-test chart fep9; LMS-R24-colour vision model
YB antagonisme of sensitivities 570,470, Y,B->J/G,B/G
lin[sensitivities], lin[ratios], lin[thresholds]=0&0,04
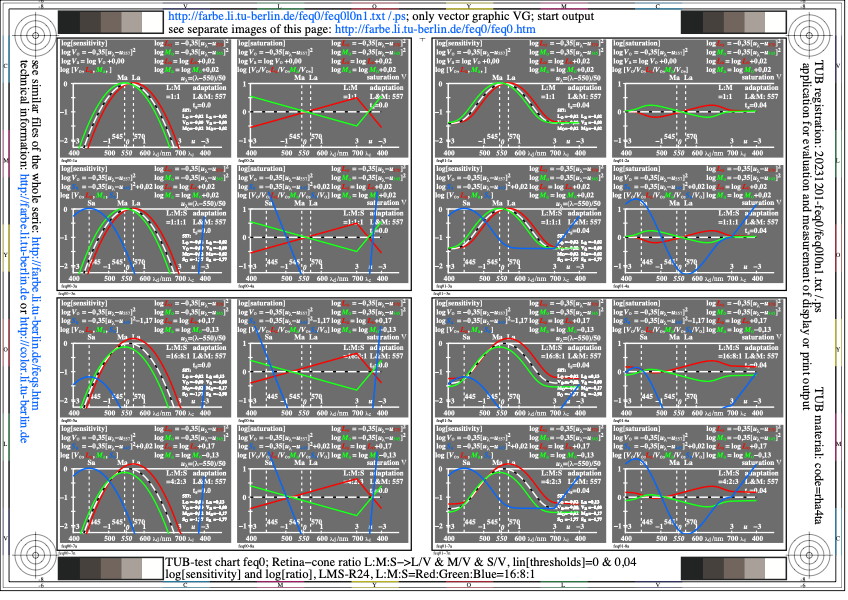
Image feq0l0n1.jpg: Output in format A6 of the file
feq0l0np.pdf, see
feq0l0n1.
PS /
TXT /
PDF /
jpg
feq0: TUB-test chart feq0; LMS-R24-colour vision model
cone ratio L:M:S=red:green:blue=16:8:1
log[sensitivities], log[ratios], lin[thresholds]=0&0,04
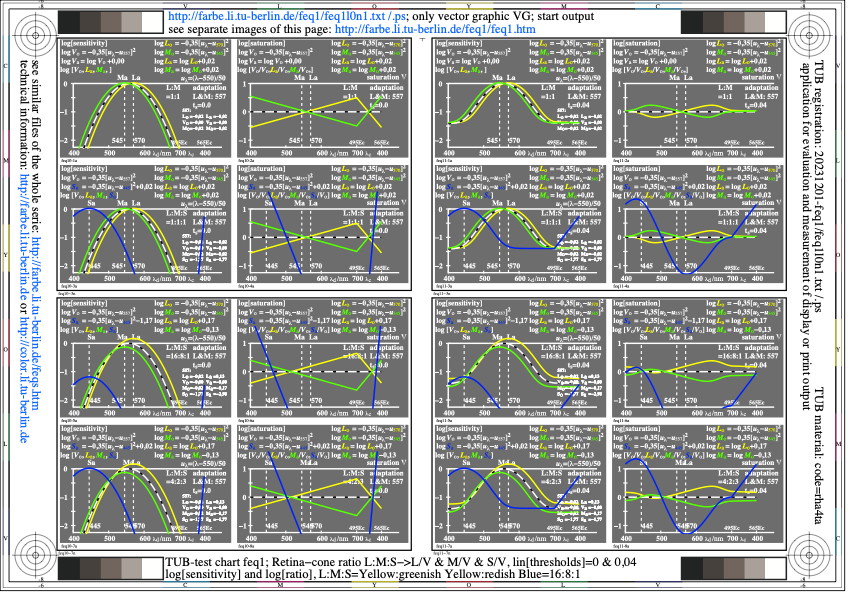
Image feq1l0n1.jpg: Output in format A6 of the file
feq1l0np.pdf, see
feq1l0n1.
PS /
TXT /
PDF /
jpg
feq1: TUB-test chart feq1; LMS-R24-colour vision model
ratio L:M:S=yellow:greenish yellow:redish blue=16:8:1
log[sensitivities], log[ratios], lin[thresholds]=0&0,04
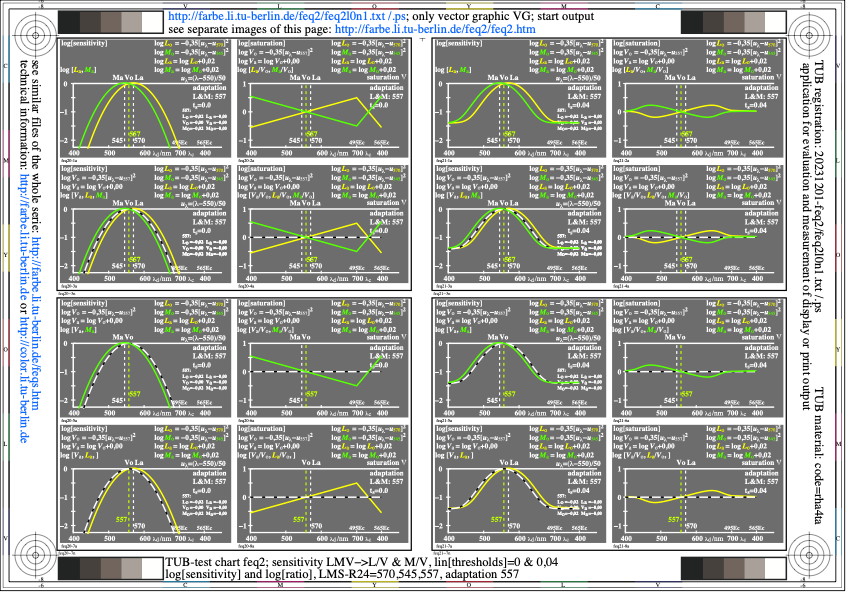
Image feq2l0n1.jpg: Output in format A6 of the file
feq2l0np.pdf, see
feq2l0n1.
PS /
TXT /
PDF /
jpg
feq2: TUB-test chart feq2; LMS-R24-colour vision model
adaptation of the sensitivities 570,557,545, LVM->(LVM)/V
log[sensitivities], log[ratios], lin[thresholds]=0&0,04
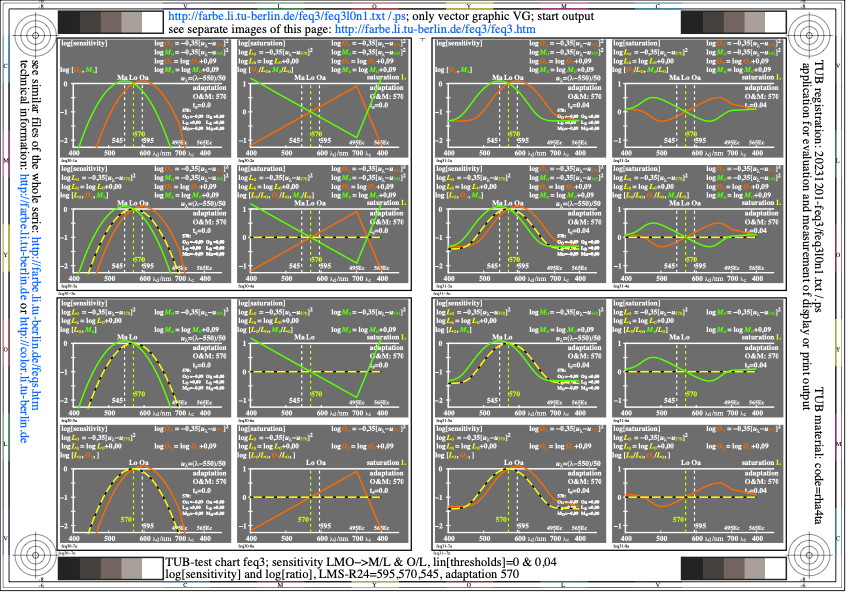
Image feq3l0n1.jpg: Output in format A6 of the file
feq3l0np.pdf, see
feq3l0n1.
PS /
TXT /
PDF /
jpg
feq3: TUB-test chart feq3; LMS-R24-colour vision model
adaptation of the sensitivities 595,570,545, OLM->(OLM)/L
log[sensitivities], log[ratios], lin[thresholds]=0&0,04
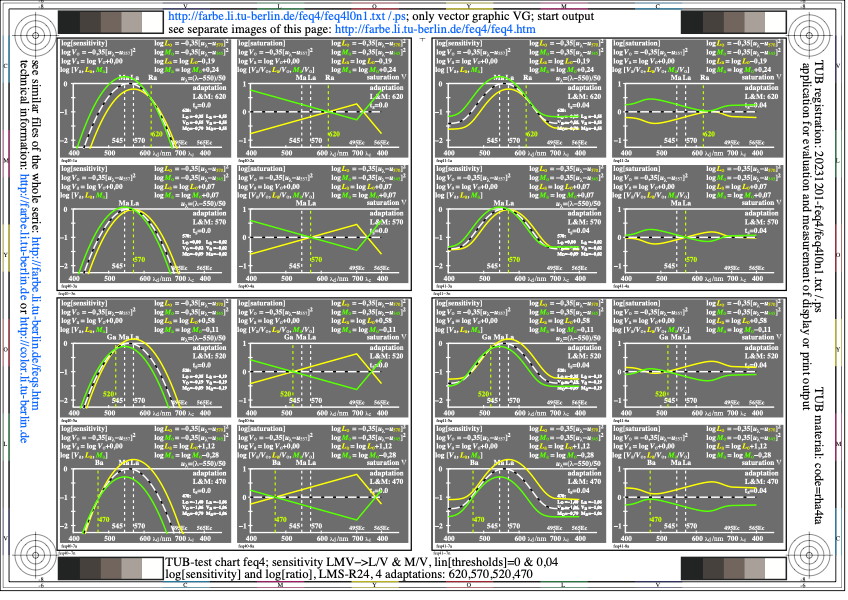
Image feq4l0n1.jpg: Output in format A6 of the file
feq4l0np.pdf, see
feq4l0n1.
PS /
TXT /
PDF /
jpg
feq4: TUB-test chart feq4; LMS-R24-colour vision model
4 adaptations of 620,570,520,470, LVM->(LVM)/V
log[sensitivities], log[ratios], lin[thresholds]=0&0,04

Image feq5l0n1.jpg: Output in format A6 of the file
feq5l0np.pdf, see
feq5l0n1.
PS /
TXT /
PDF /
jpg
feq5: TUB-test chart feq5; LMS-R24-colour vision model
4 adaptations of 620,570,520,470, OLM->(OLM)/L
log[sensitivities], log[ratios], lin[thresholds]=0&0,04
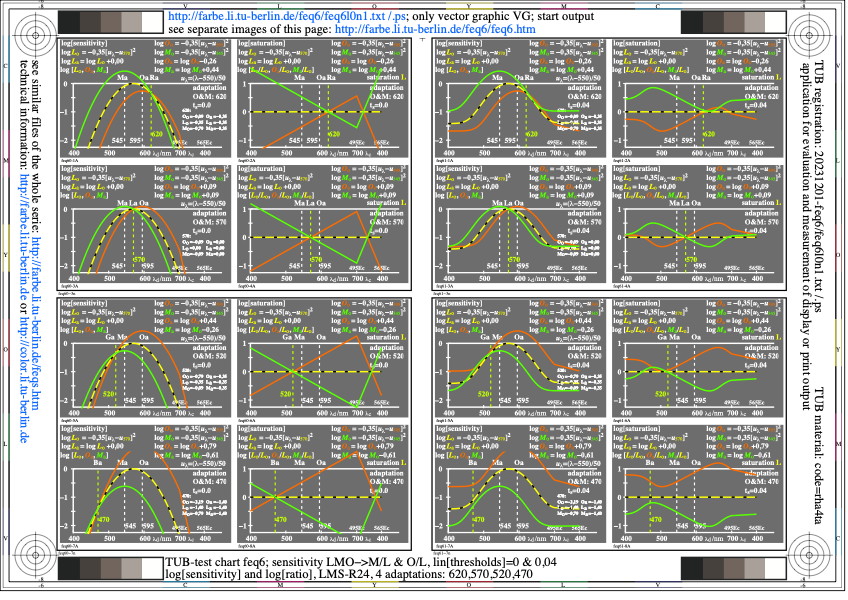
Image feq6l0n1.jpg: Output in format A6 of the file
feq6l0np.pdf, see
feq6l0n1.
PS /
TXT /
PDF /
jpg
feq6: TUB-test chart feq6; LMS-R24-colour vision model
4 adaptations of 620,570,520,470, OLM->(OLM)/L
log[sensitivities], log[ratios], lin[thresholds]=0&0,04
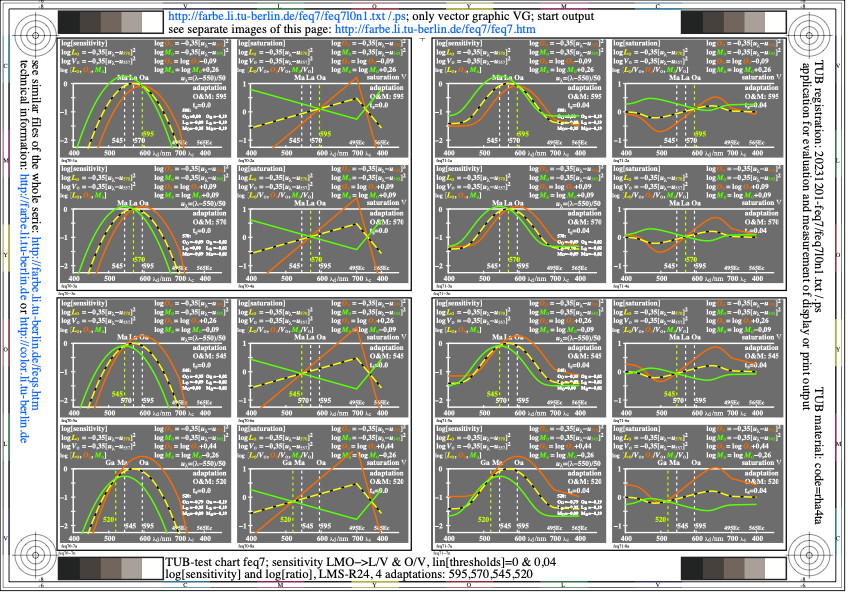
Image feq7l0n1.jpg: Output in format A6 of the file
feq7l0np.pdf, see
feq7l0n1.
PS /
TXT /
PDF /
jpg
feq7: TUB-test chart feq7; LMS-R24-colour vision model
4 adaptations of 595,570,545,520, OLM->(OLM)/L
log[sensitivities], log[ratios], lin[thresholds]=0&0,04
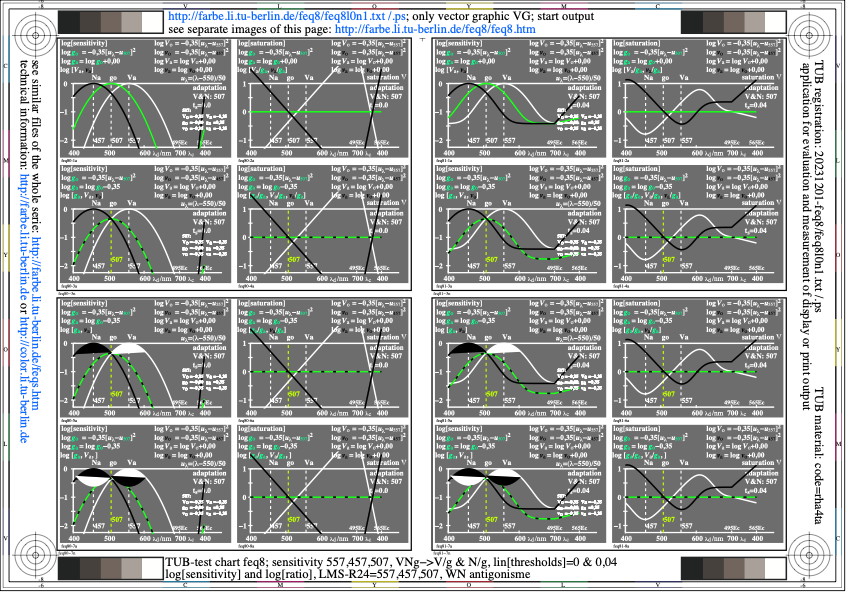
Image feq8l0n1.jpg: Output in format A6 of the file
feq8l0np.pdf, see
feq8l0n1.
PS /
TXT /
PDF /
jpg
feq8: TUB-test chart feq8; LMS-R24-colour vision model
WN antagonisme of sensitivities 547,457, V,N->V/g,N/g
log[sensitivities], log[ratios], lin[thresholds]=0&0,04
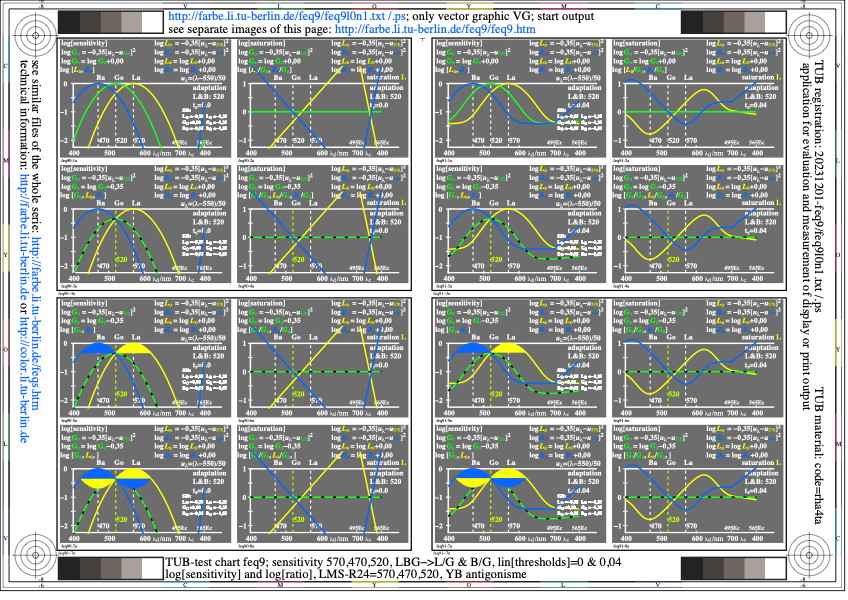
Image feq9l0n1.jpg: Output in format A6 of the file
feq9l0np.pdf, see
feq9l0n1.
PS /
TXT /
PDF /
jpg
feq9: TUB-test chart feq9; LMS-R24-colour vision model
YB antagonisme of sensitivities 570,470, Y,B->J/G,B/G
log[sensitivities], log[ratios], lin[thresholds]=0&0,04
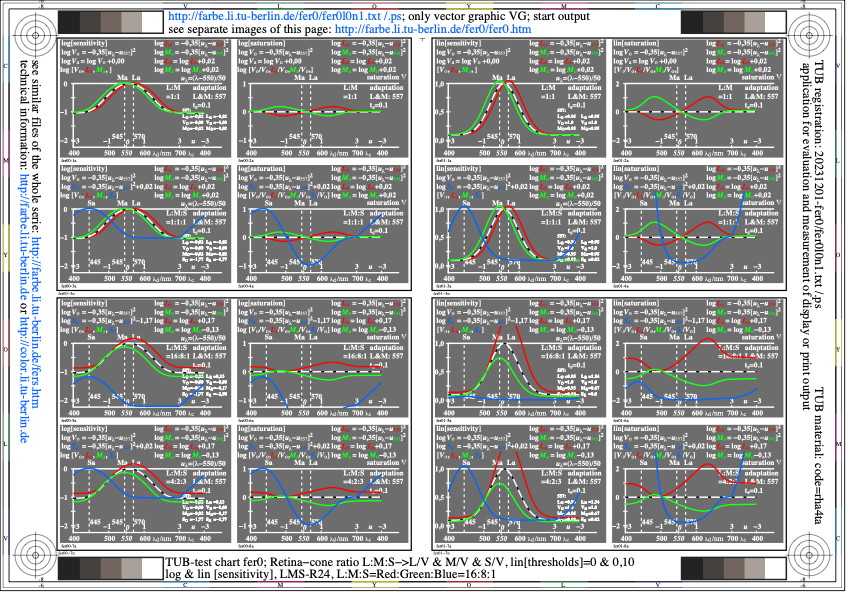
Image fer0l0n1.jpg: Output in format A6 of the file
fer0l0np.pdf, see
fer0l0n1.
PS /
TXT /
PDF /
jpg
fer0: TUB-test chart fer0; LMS-R24-colour vision model
cone ratio L:M:S=red:green:blue=16:8:1
log & lin[sensitivities & ratios], lin[thresholds]=0,1
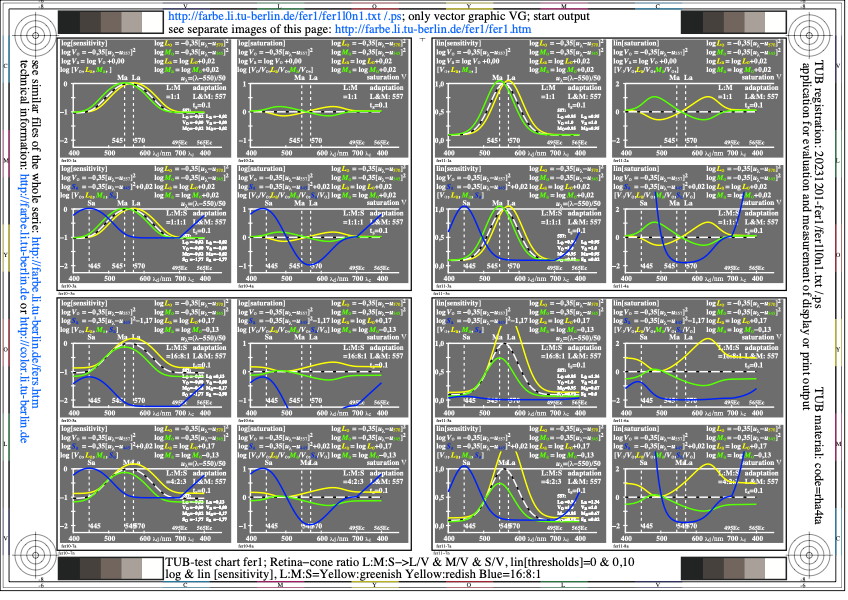
Image fer1l0n1.jpg: Output in format A6 of the file
fer1l0np.pdf, see
fer1l0n1.
PS /
TXT /
PDF /
jpg
fer1: TUB-test chart fer1; LMS-R24-colour vision model
ratio L:M:S=yellow:greenish yellow:redish blue=16:8:1
log & lin[sensitivities & ratios], lin[thresholds]=0,1
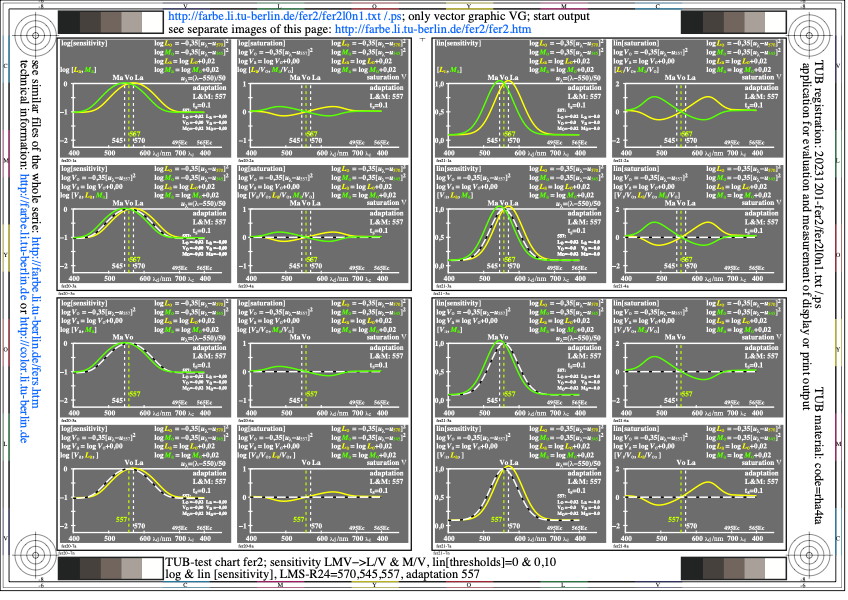
Image fer2l0n1.jpg: Output in format A6 of the file
fer2l0np.pdf, see
fer2l0n1.
PS /
TXT /
PDF /
jpg
fer2: TUB-test chart fer2; LMS-R24-colour vision model
adaptation of the sensitivities 570,557,545, LVM->(LVM)/V
log & lin[sensitivities & ratios], lin[thresholds]=0,1
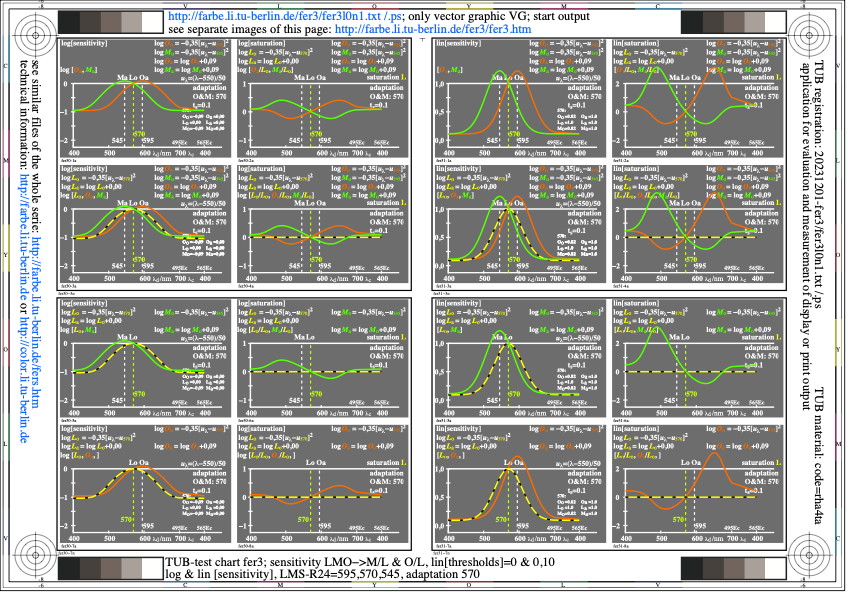
Image fer3l0n1.jpg: Output in format A6 of the file
fer3l0np.pdf, see
fer3l0n1.
PS /
TXT /
PDF /
jpg
fer3: TUB-test chart fer3; LMS-R24-colour vision model
adaptation of the sensitivities 595,570,545, OLM->(OLM)/L
log & lin[sensitivities & ratios], lin[thresholds]=0,1
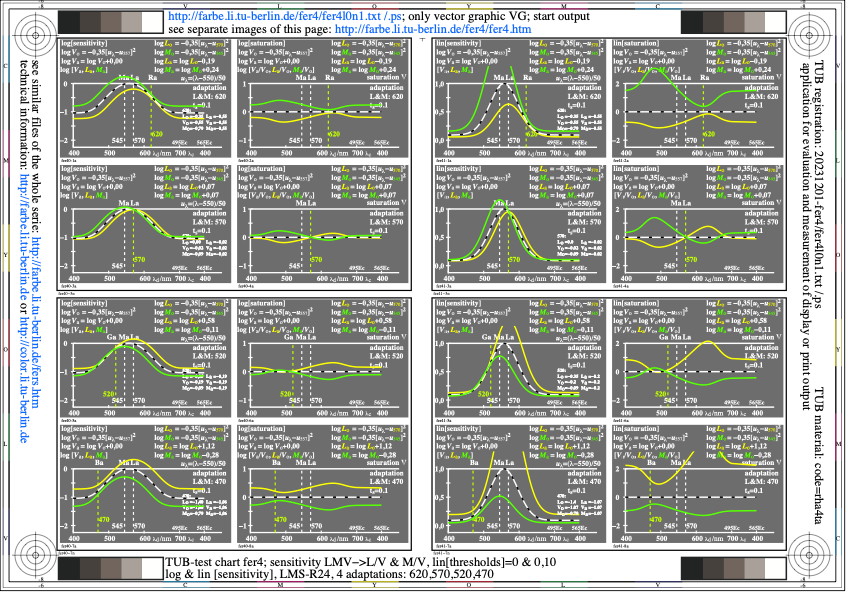
Image fer4l0n1.jpg: Output in format A6 of the file
fer4l0np.pdf, see
fer4l0n1.
PS /
TXT /
PDF /
jpg
fer4: TUB-test chart fer4; LMS-R24-colour vision model
4 adaptations of 620,570,520,470, LVM->(LVM)/V
log & lin[sensitivities & ratios], lin[thresholds]=0,1

Image fer5l0n1.jpg: Output in format A6 of the file
fer5l0np.pdf, see
fer5l0n1.
PS /
TXT /
PDF /
jpg
fer5: TUB-test chart fer5; LMS-R24-colour vision model
4 adaptations of 620,570,520,470, OLM->(OLM)/L
log & lin[sensitivities & ratios], lin[thresholds]=0,1
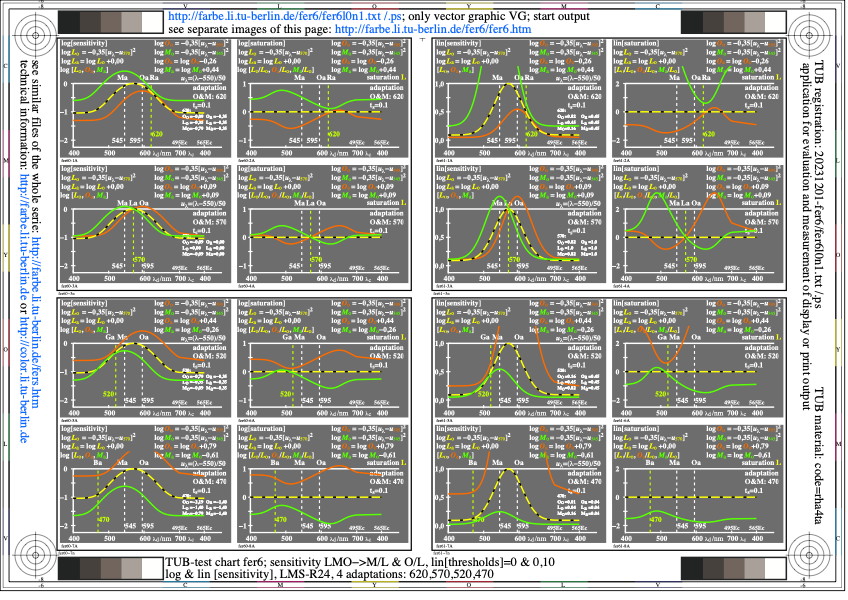
Image fer6l0n1.jpg: Output in format A6 of the file
fer6l0np.pdf, see
fer6l0n1.
PS /
TXT /
PDF /
jpg
fer6: TUB-test chart fer6; LMS-R24-colour vision model
4 adaptations of 620,570,520,470, OLM->(OLM)/L
log & lin[sensitivities & ratios], lin[thresholds]=0,1
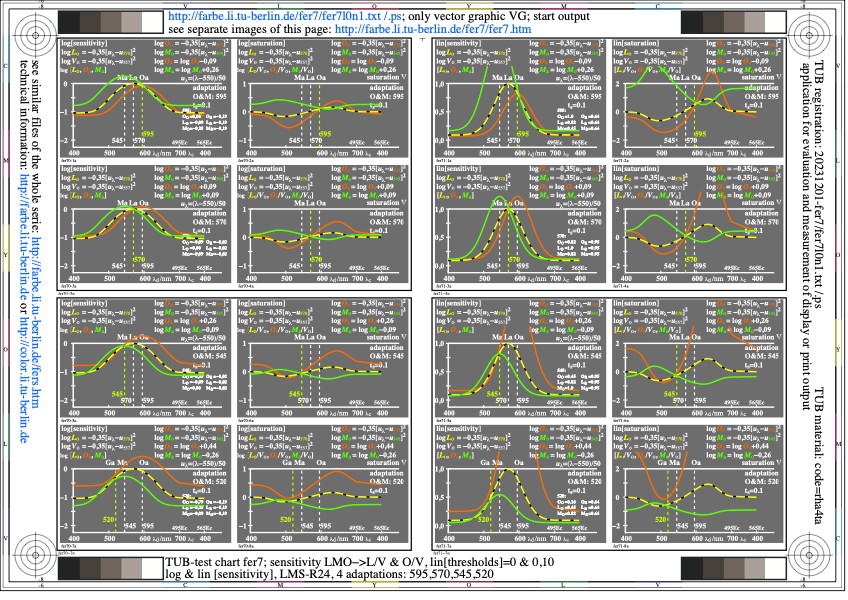
Image fer7l0n1.jpg: Output in format A6 of the file
fer7l0np.pdf, see
fer7l0n1.
PS /
TXT /
PDF /
jpg
fer7: TUB-test chart fer7; LMS-R24-colour vision model
4 adaptations of 595,570,545,520, OLM->(OLM)/L
log & lin[sensitivities & ratios], lin[thresholds]=0,1
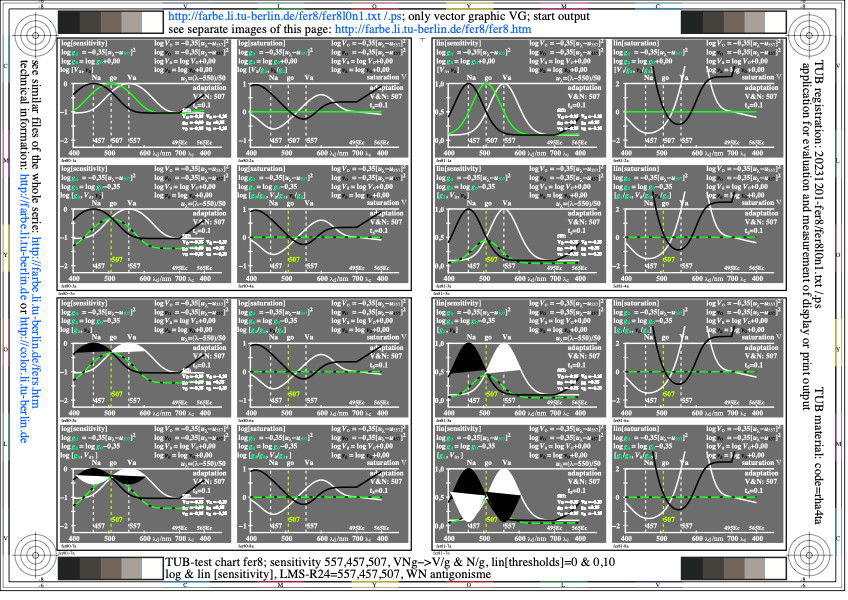
Image fer8l0n1.jpg: Output in format A6 of the file
fer8l0np.pdf, see
fer8l0n1.
PS /
TXT /
PDF /
jpg
fer8: TUB-test chart fer8; LMS-R24-colour vision model
WN antagonisme of sensitivities 547,457, V,N->V/g,N/g
log & lin[sensitivities & ratios], lin[thresholds]=0,1
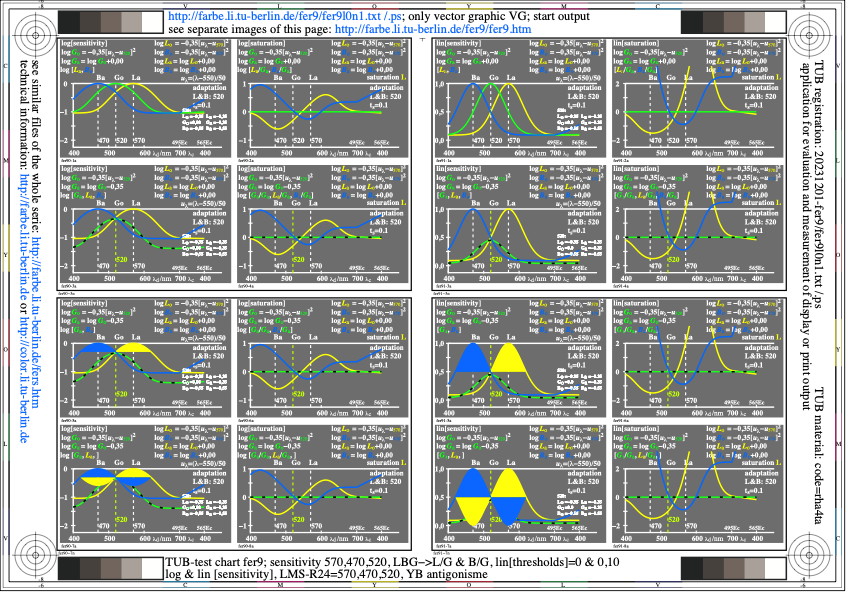
Image fer9l0n1.jpg: Output in format A6 of the file
fer9l0np.pdf, see
fer9l0n1.
PS /
TXT /
PDF /
jpg
fer9: TUB-test chart fer9; LMS-R24-colour vision model
YB antagonisme of sensitivities 570,470, Y,B->J/G,B/G
log & lin[sensitivities & ratios], lin[thresholds]=0,1

Image fes0l0n1.jpg: Output in format A6 of the file
fes0l0np.pdf, see
fes0l0n1.
PS /
TXT /
PDF /
jpg
fes0: TUB-test chart fes0; Under development

Image fes1l0n1.jpg: Output in format A6 of the file
fes1l0np.pdf, see
fes1l0n1.
PS /
TXT /
PDF /
jpg
fes1: TUB-test chart fes1; Under development

Image fes2l0n1.jpg: Output in format A6 of the file
fes2l0np.pdf, see
fes2l0n1.
PS /
TXT /
PDF /
jpg
fes2: TUB-test chart fes2; Under development

Image fes3l0n1.jpg: Output in format A6 of the file
fes3l0np.pdf, see
fes3l0n1.
PS /
TXT /
PDF /
jpg
fes3: TUB-test chart fes3; Under development

Image fes4l0n1.jpg: Output in format A6 of the file
fes4l0np.pdf, see
fes4l0n1.
PS /
TXT /
PDF /
jpg
fes4: TUB-test chart fes4; Under development

Image fes5l0n1.jpg: Output in format A6 of the file
fes5l0np.pdf, see
fes5l0n1.
PS /
TXT /
PDF /
jpg
fes5: TUB-test chart fes5; Under development

Image fes6l0n1.jpg: Output in format A6 of the file
fes6l0np.pdf, see
fes6l0n1.
PS /
TXT /
PDF /
jpg
fes6: TUB-test chart fes6; Under development

Image fes7l0n1.jpg: Output in format A6 of the file
fes7l0np.pdf, see
fes7l0n1.
PS /
TXT /
PDF /
jpg
fes7: TUB-test chart fes7; Under development

Image fes8l0n1.jpg: Output in format A6 of the file
fes8l0np.pdf, see
fes8l0n1.
PS /
TXT /
PDF /
jpg
fes8: TUB-test chart fes8; Under development

Image fes9l0n1.jpg: Output in format A6 of the file
fes9l0np.pdf, see
fes9l0n1.
PS /
TXT /
PDF /
jpg
fes9: TUB-test chart fes9; Under development

Image fet0l0n1.jpg: Output in format A6 of the file
fet0l0np.pdf, see
fet0l0n1.
PS /
TXT /
PDF /
jpg
fet0: TUB-test chart fet0; Under development

Image fet1l0n1.jpg: Output in format A6 of the file
fet1l0np.pdf, see
fet1l0n1.
PS /
TXT /
PDF /
jpg
fet1: TUB-test chart fet1; Under development

Image fet2l0n1.jpg: Output in format A6 of the file
fet2l0np.pdf, see
fet2l0n1.
PS /
TXT /
PDF /
jpg
fet2: TUB-test chart fet2; Under development

Image fet3l0n1.jpg: Output in format A6 of the file
fet3l0np.pdf, see
fet3l0n1.
PS /
TXT /
PDF /
jpg
fet3: TUB-test chart fet3; Under development

Image fet4l0n1.jpg: Output in format A6 of the file
fet4l0np.pdf, see
fet4l0n1.
PS /
TXT /
PDF /
jpg
fet4: TUB-test chart fet4; Under development

Image fet5l0n1.jpg: Output in format A6 of the file
fet5l0np.pdf, see
fet5l0n1.
PS /
TXT /
PDF /
jpg
fet5: TUB-test chart fet5; Under development

Image fet6l0n1.jpg: Output in format A6 of the file
fet6l0np.pdf, see
fet6l0n1.
PS /
TXT /
PDF /
jpg
fet6: TUB-test chart fet6; Under development

Image fet7l0n1.jpg: Output in format A6 of the file
fet7l0np.pdf, see
fet7l0n1.
PS /
TXT /
PDF /
jpg
fet7: TUB-test chart fet7; Under development

Image fet8l0n1.jpg: Output in format A6 of the file
fet8l0np.pdf, see
fet8l0n1.
PS /
TXT /
PDF /
jpg
fet8: TUB-test chart fet8; Under development

Image fet9l0n1.jpg: Output in format A6 of the file
fet9l0np.pdf, see
fet9l0n1.
PS /
TXT /
PDF /
jpg
fet9: TUB-test chart fet9; Under development
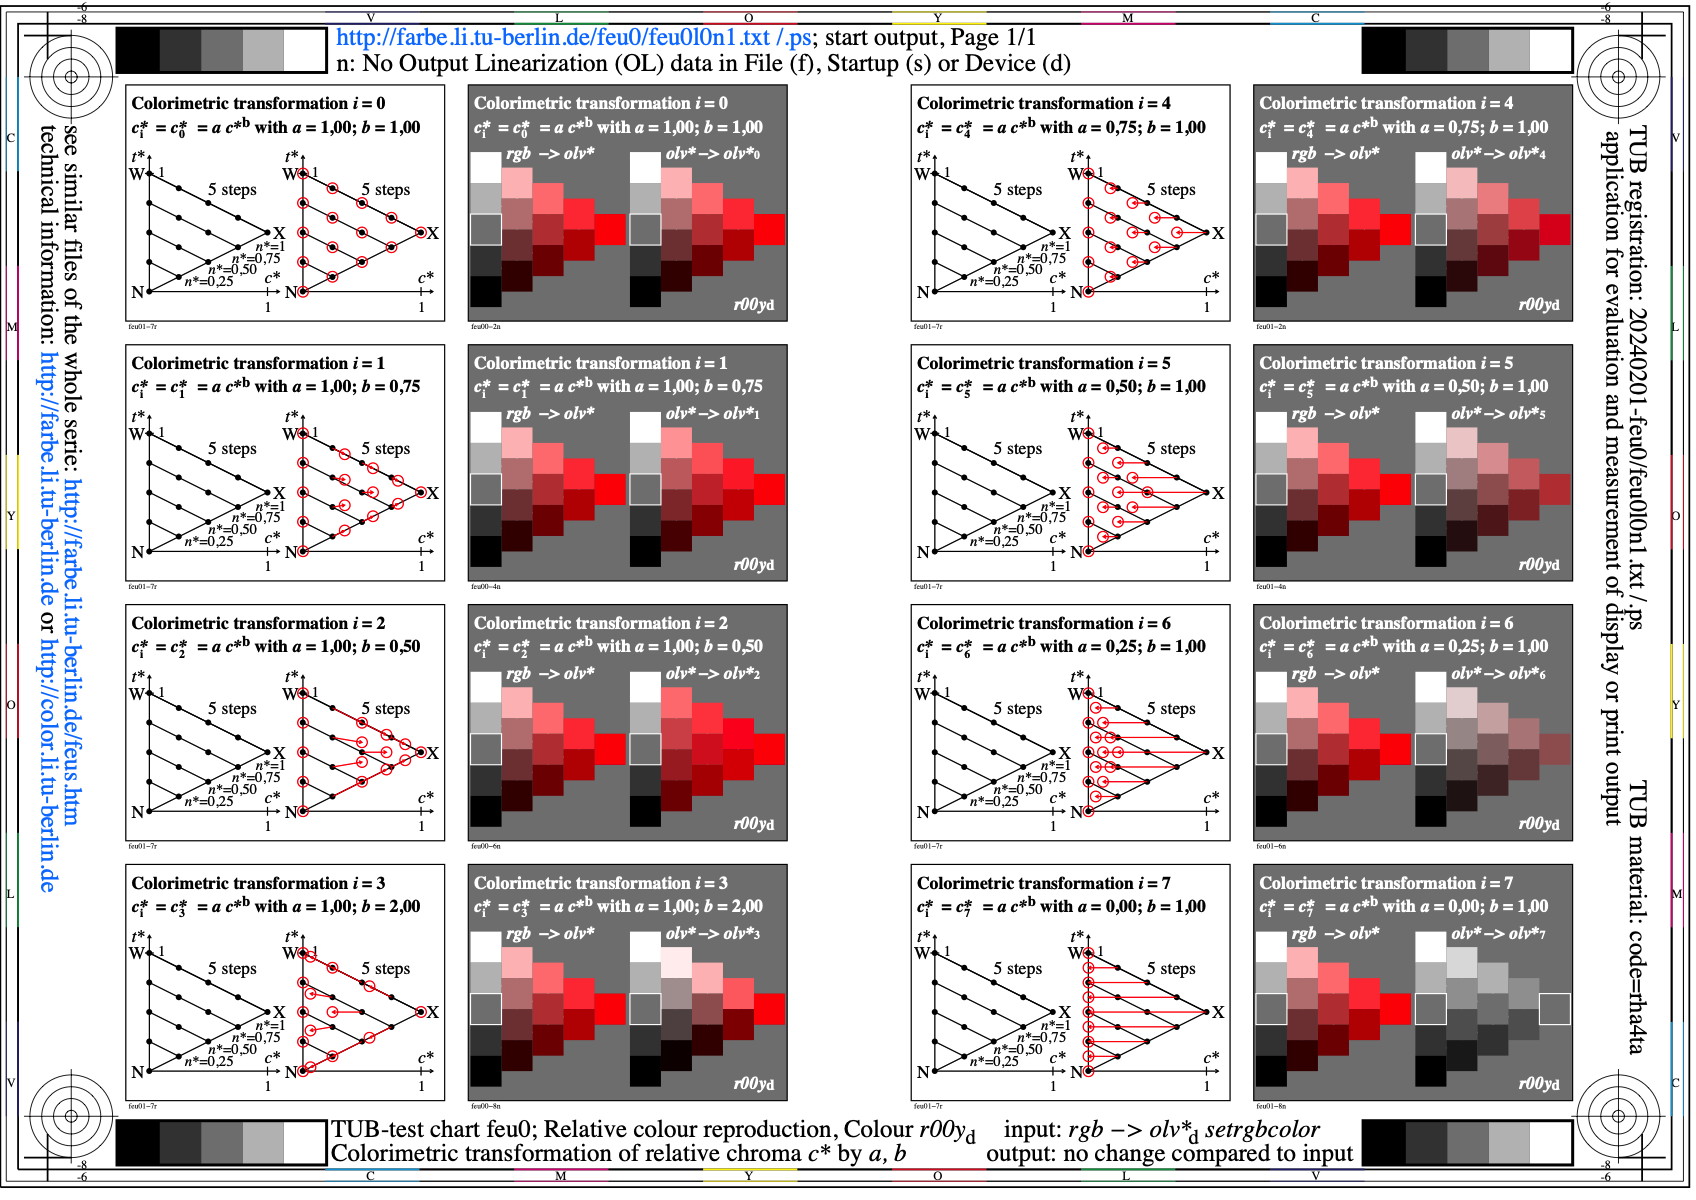
Image feu0l0n1.jpg: Output in format A6 of the file
feu0l0np.pdf, see
feu0l0n1.
PS /
TXT /
PDF /
jpg
feu0: TUB-test chart feu0; Under development

Image feu1l0n1.jpg: Output in format A6 of the file
feu1l0np.pdf, see
feu1l0n1.
PS /
TXT /
PDF /
jpg
feu1: TUB-test chart feu1; Under development

Image feu2l0n1.jpg: Output in format A6 of the file
feu2l0np.pdf, see
feu2l0n1.
PS /
TXT /
PDF /
jpg
feu2: TUB-test chart feu2; Under development

Image feu3l0n1.jpg: Output in format A6 of the file
feu3l0np.pdf, see
feu3l0n1.
PS /
TXT /
PDF /
jpg
feu3: TUB-test chart feu3; Under development

Image feu4l0n1.jpg: Output in format A6 of the file
feu4l0np.pdf, see
feu4l0n1.
PS /
TXT /
PDF /
jpg
feu4: TUB-test chart feu4; Under development
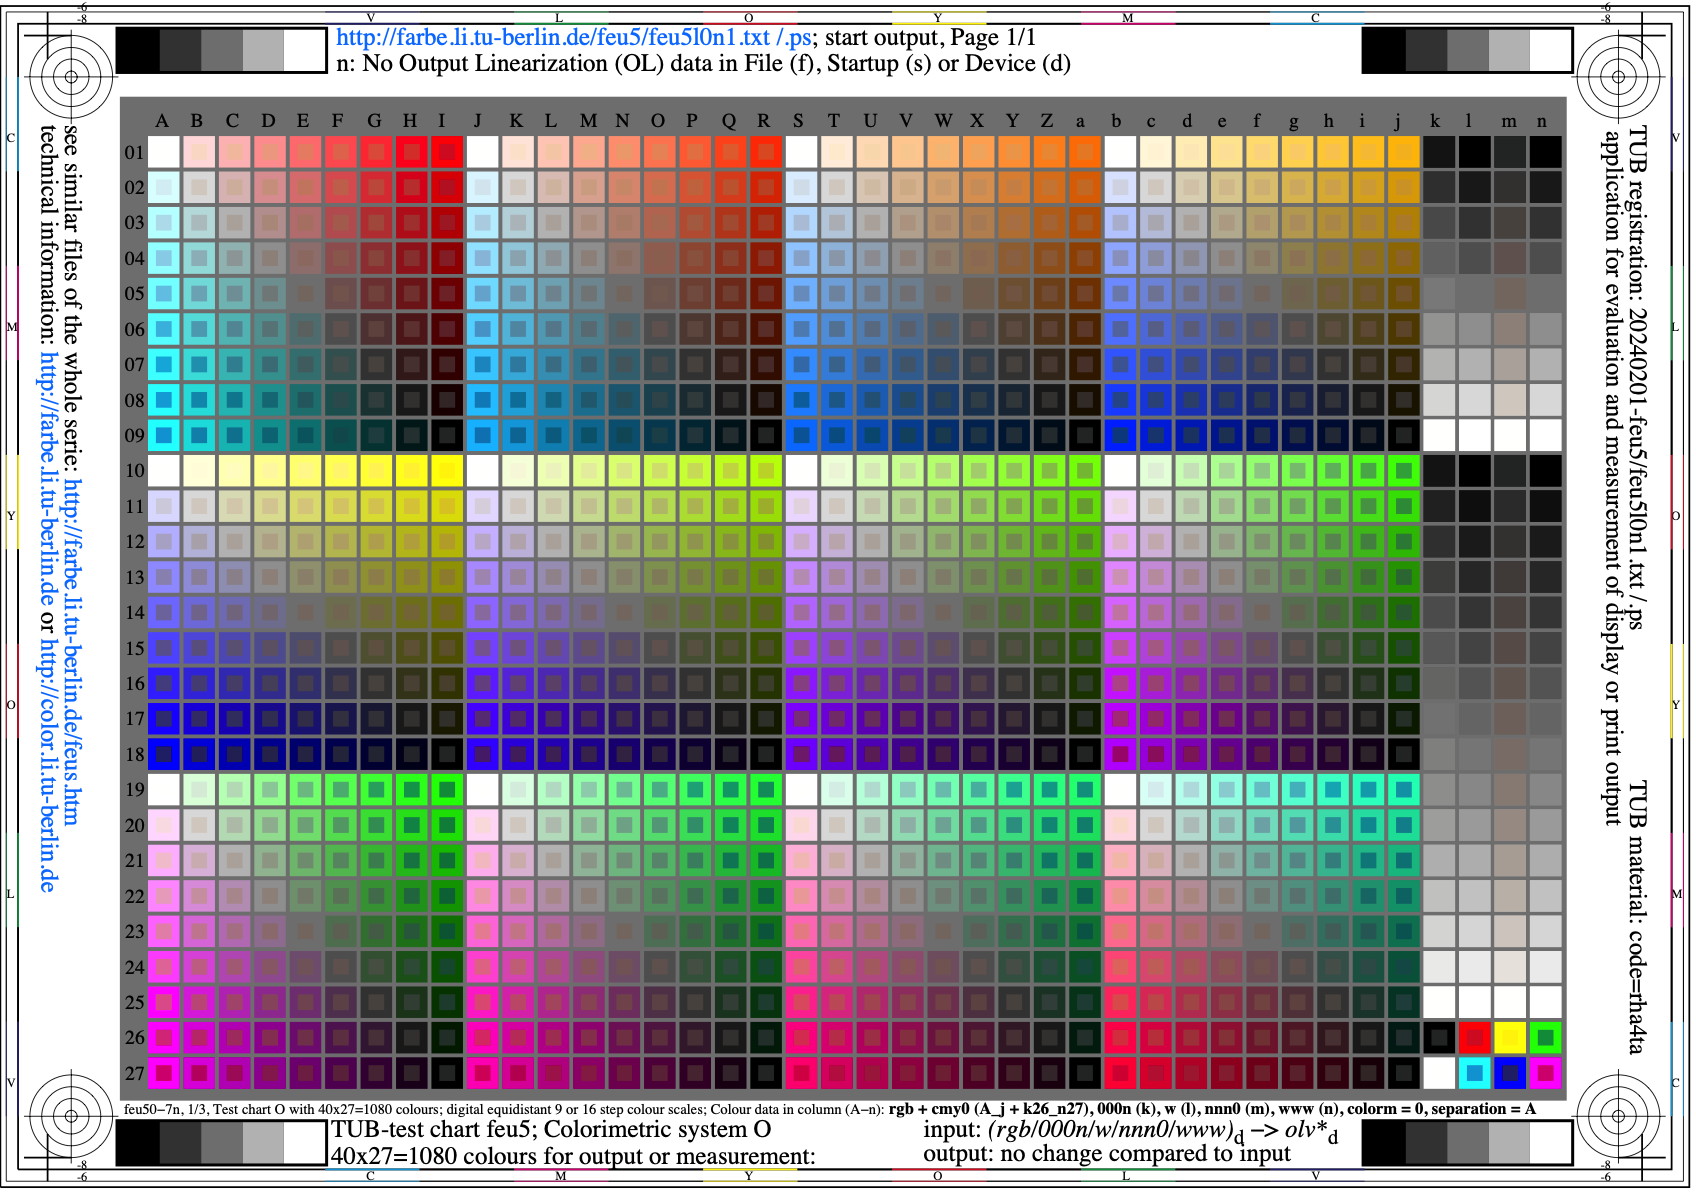
Image feu5l0n1.jpg: Output in format A6 of the file
feu5l0np.pdf, see
feu5l0n1.
PS /
TXT /
PDF /
jpg
feu5: TUB-test chart feu5; Under development

Image feu6l0n1.jpg: Output in format A6 of the file
feu6l0np.pdf, see
feu6l0n1.
PS /
TXT /
PDF /
jpg
feu6: TUB-test chart feu6; Under development

Image feu7l0n1.jpg: Output in format A6 of the file
feu7l0np.pdf, see
feu7l0n1.
PS /
TXT /
PDF /
jpg
feu7: TUB-test chart feu7; Under development

Image feu8l0n1.jpg: Output in format A6 of the file
feu8l0np.pdf, see
feu8l0n1.
PS /
TXT /
PDF /
jpg
feu8: TUB-test chart feu8; Under development
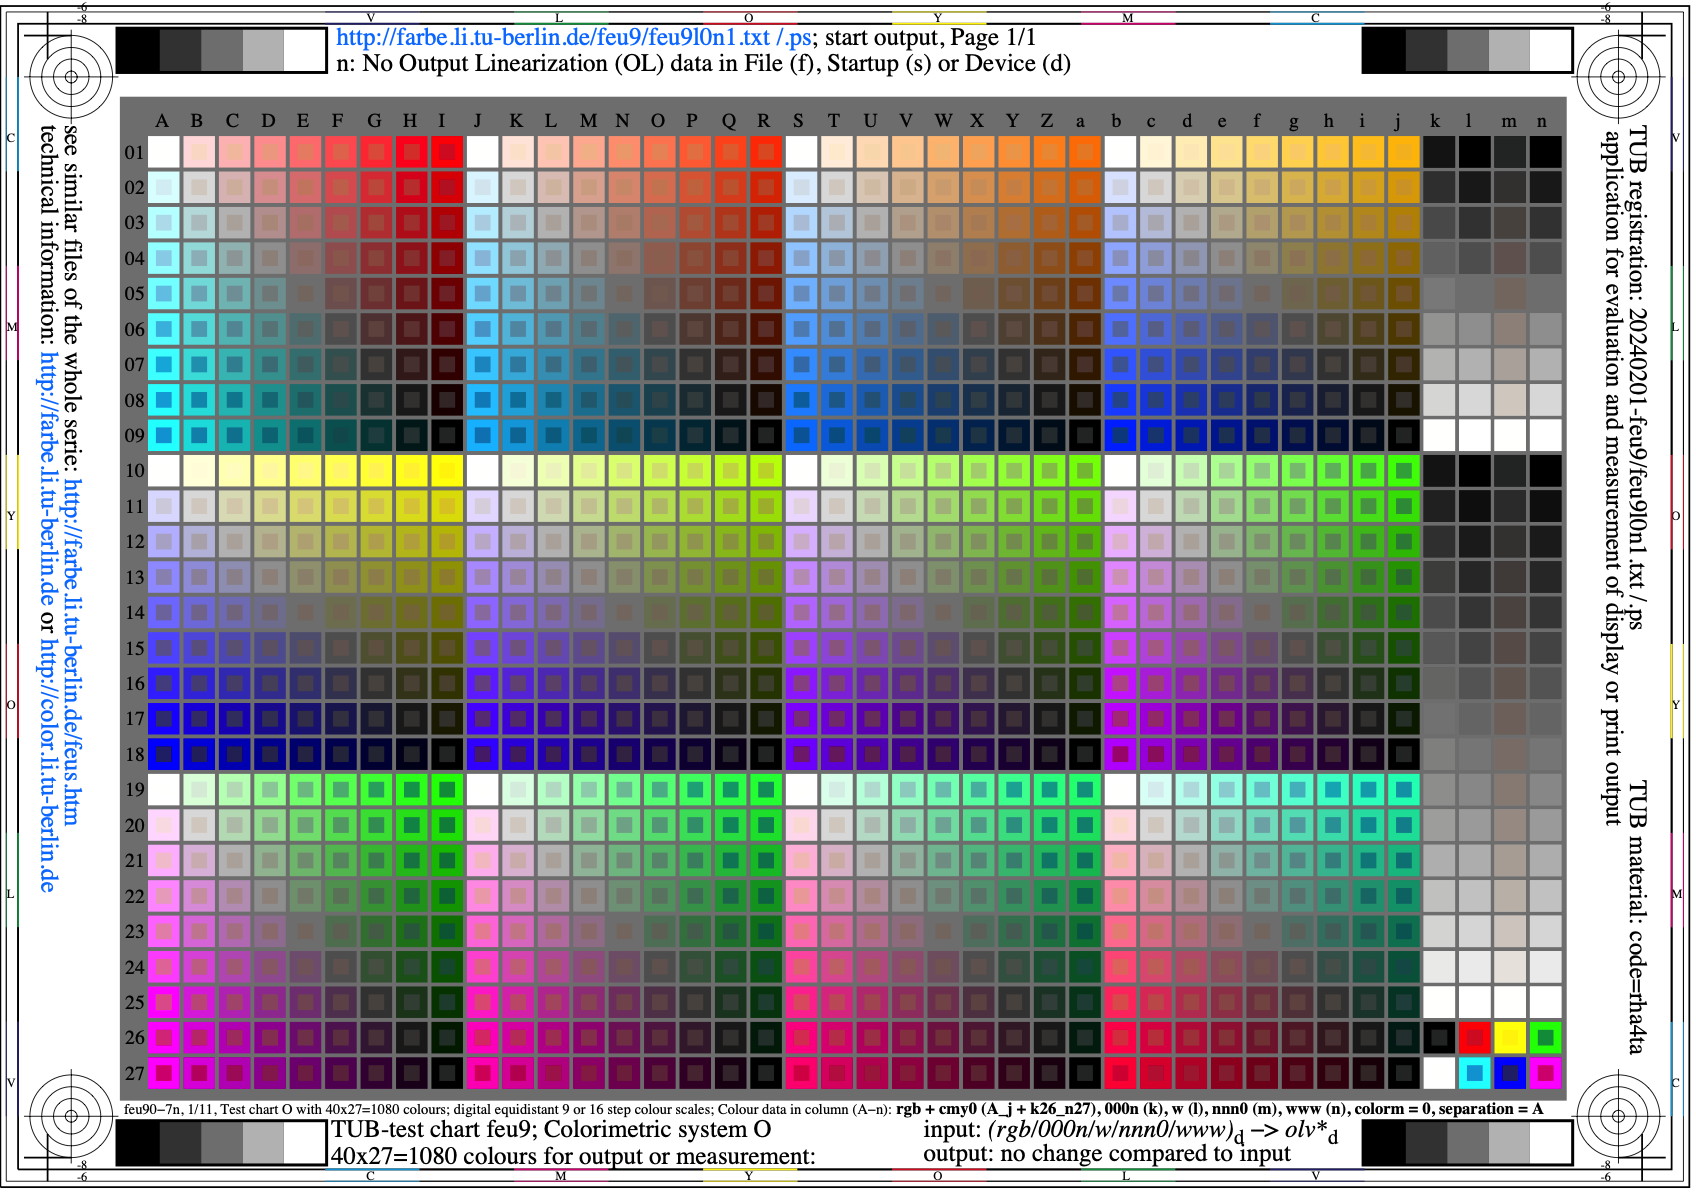
Image feu9l0n1.jpg: Output in format A6 of the file
feu9l0np.pdf, see
feu9l0n1.
PS /
TXT /
PDF /
jpg
feu9: TUB-test chart feu9; Under development

Image fev0l0n1.jpg: Output in format A6 of the file
fev0l0np.pdf, see
fev0l0n1.
PS /
TXT /
PDF /
jpg
fev0: TUB-test chart fev0; Under development

Image fev1l0n1.jpg: Output in format A6 of the file
fev1l0np.pdf, see
fev1l0n1.
PS /
TXT /
PDF /
jpg
fev1: TUB-test chart fev1; Under development

Image fev2l0n1.jpg: Output in format A6 of the file
fev2l0np.pdf, see
fev2l0n1.
PS /
TXT /
PDF /
jpg
fev2: TUB-test chart fev2; Under development
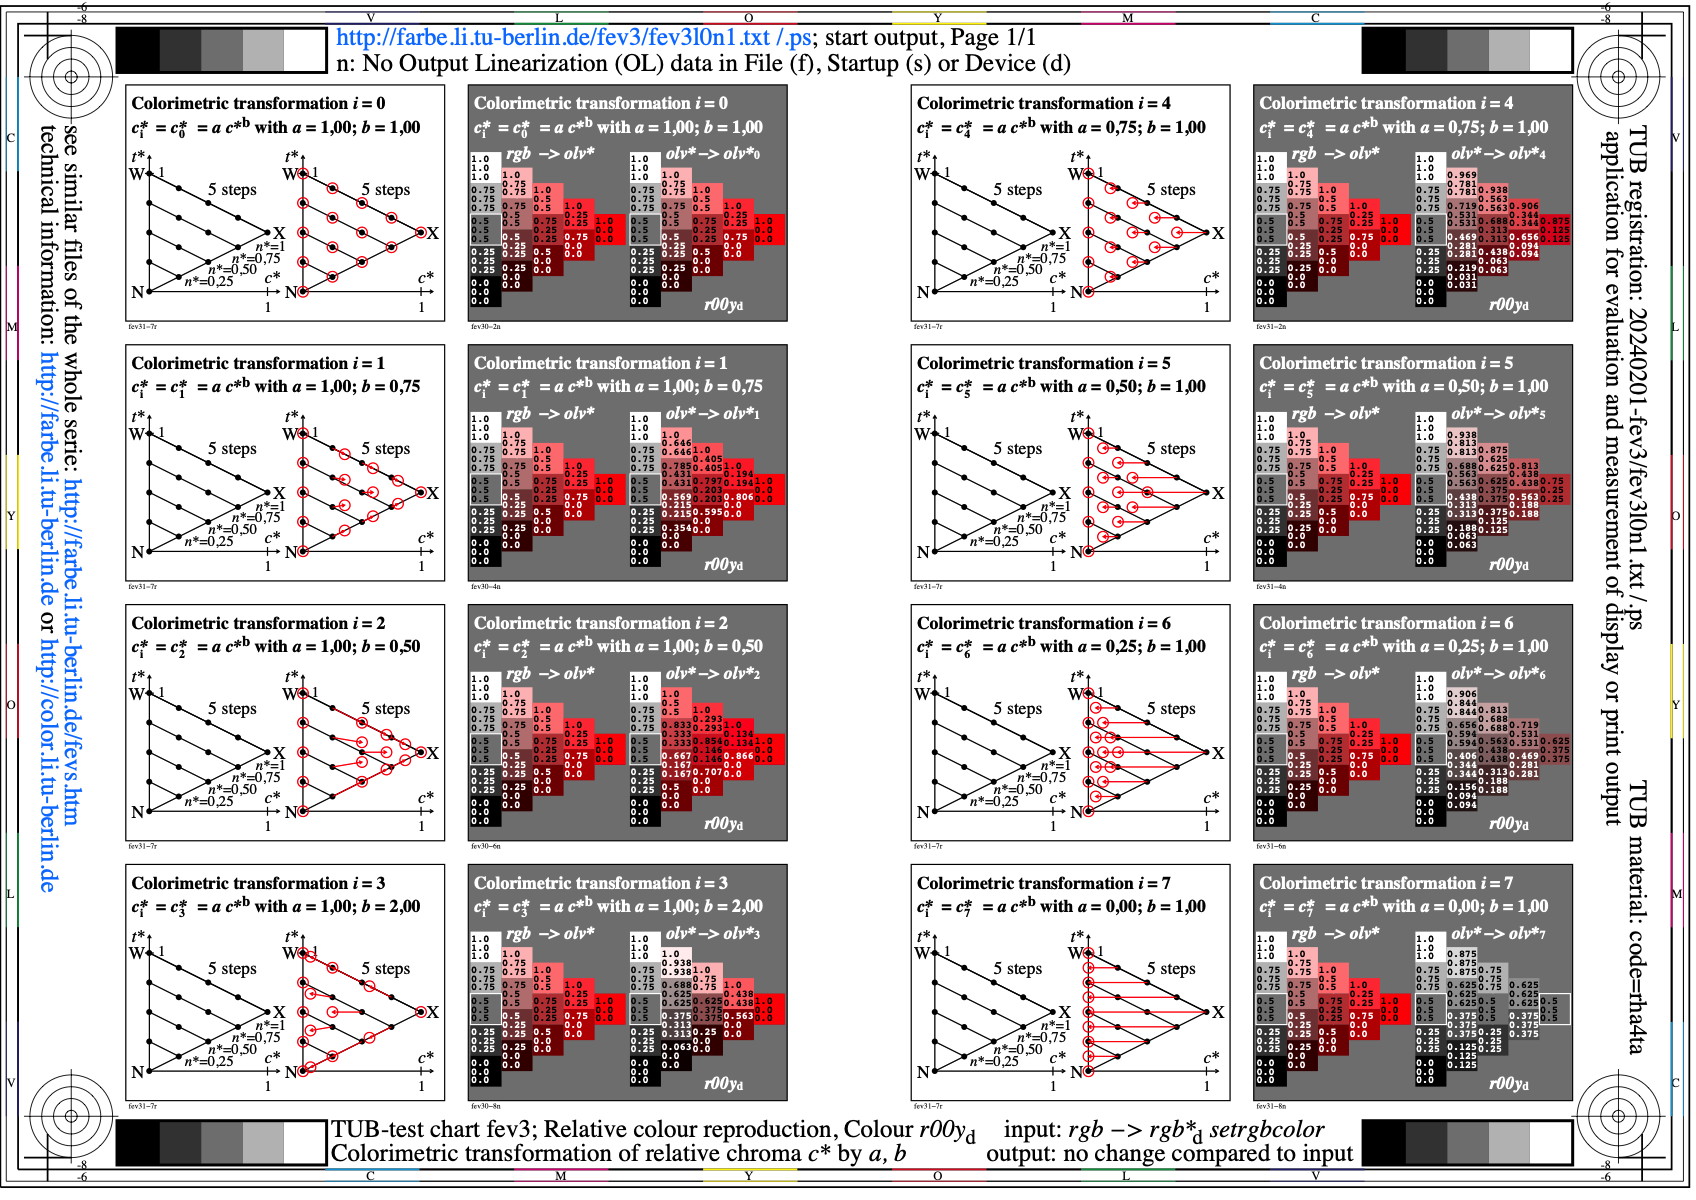
Image fev3l0n1.jpg: Output in format A6 of the file
fev3l0np.pdf, see
fev3l0n1.
PS /
TXT /
PDF /
jpg
fev3: TUB-test chart fev3; Under development

Image fev4l0n1.jpg: Output in format A6 of the file
fev4l0np.pdf, see
fev4l0n1.
PS /
TXT /
PDF /
jpg
fev4: TUB-test chart fev4; Under development

Image fev5l0n1.jpg: Output in format A6 of the file
fev5l0np.pdf, see
fev5l0n1.
PS /
TXT /
PDF /
jpg
fev5: TUB-test chart fev5; Under development

Image fev6l0n1.jpg: Output in format A6 of the file
fev6l0np.pdf, see
fev6l0n1.
PS /
TXT /
PDF /
jpg
fev6: TUB-test chart fev6; Under development
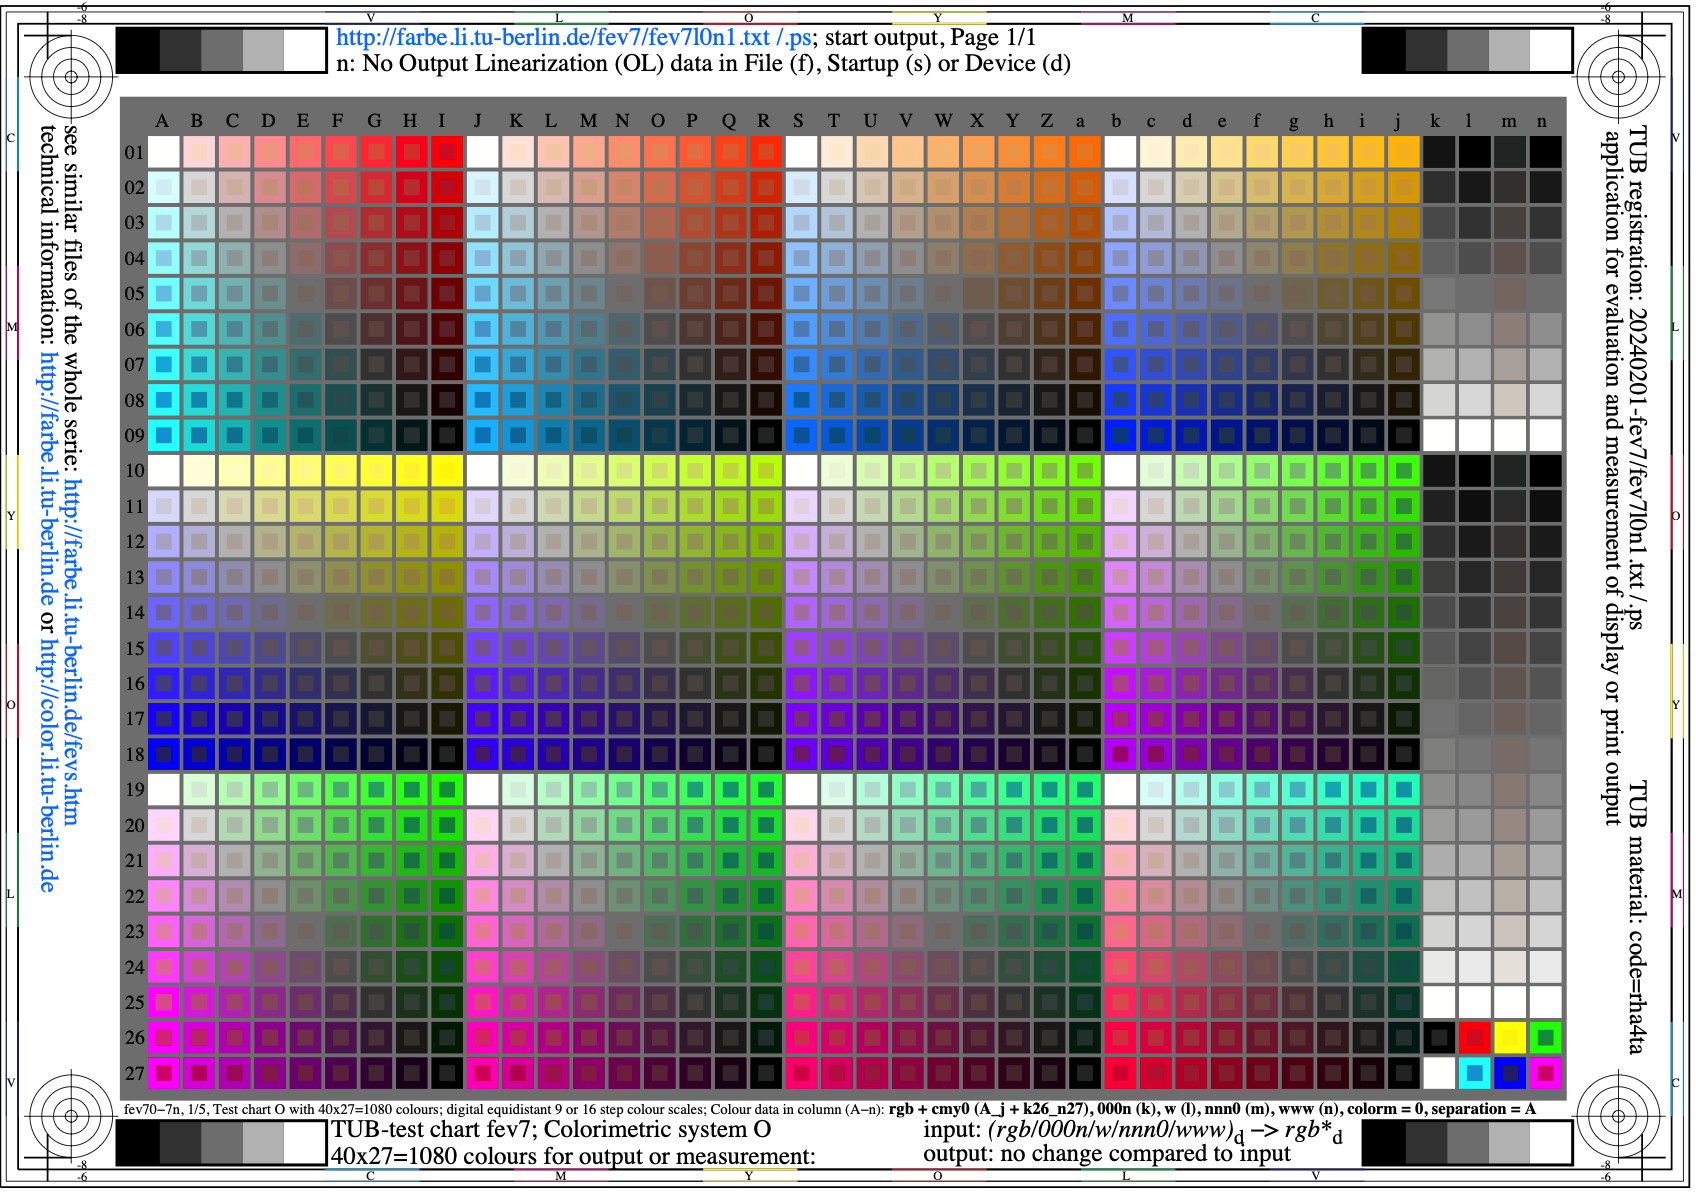
Image fev7l0n1.jpg: Output in format A6 of the file
fev7l0np.pdf, see
fev7l0n1.
PS /
TXT /
PDF /
jpg
fev7: TUB-test chart fev7; Under development
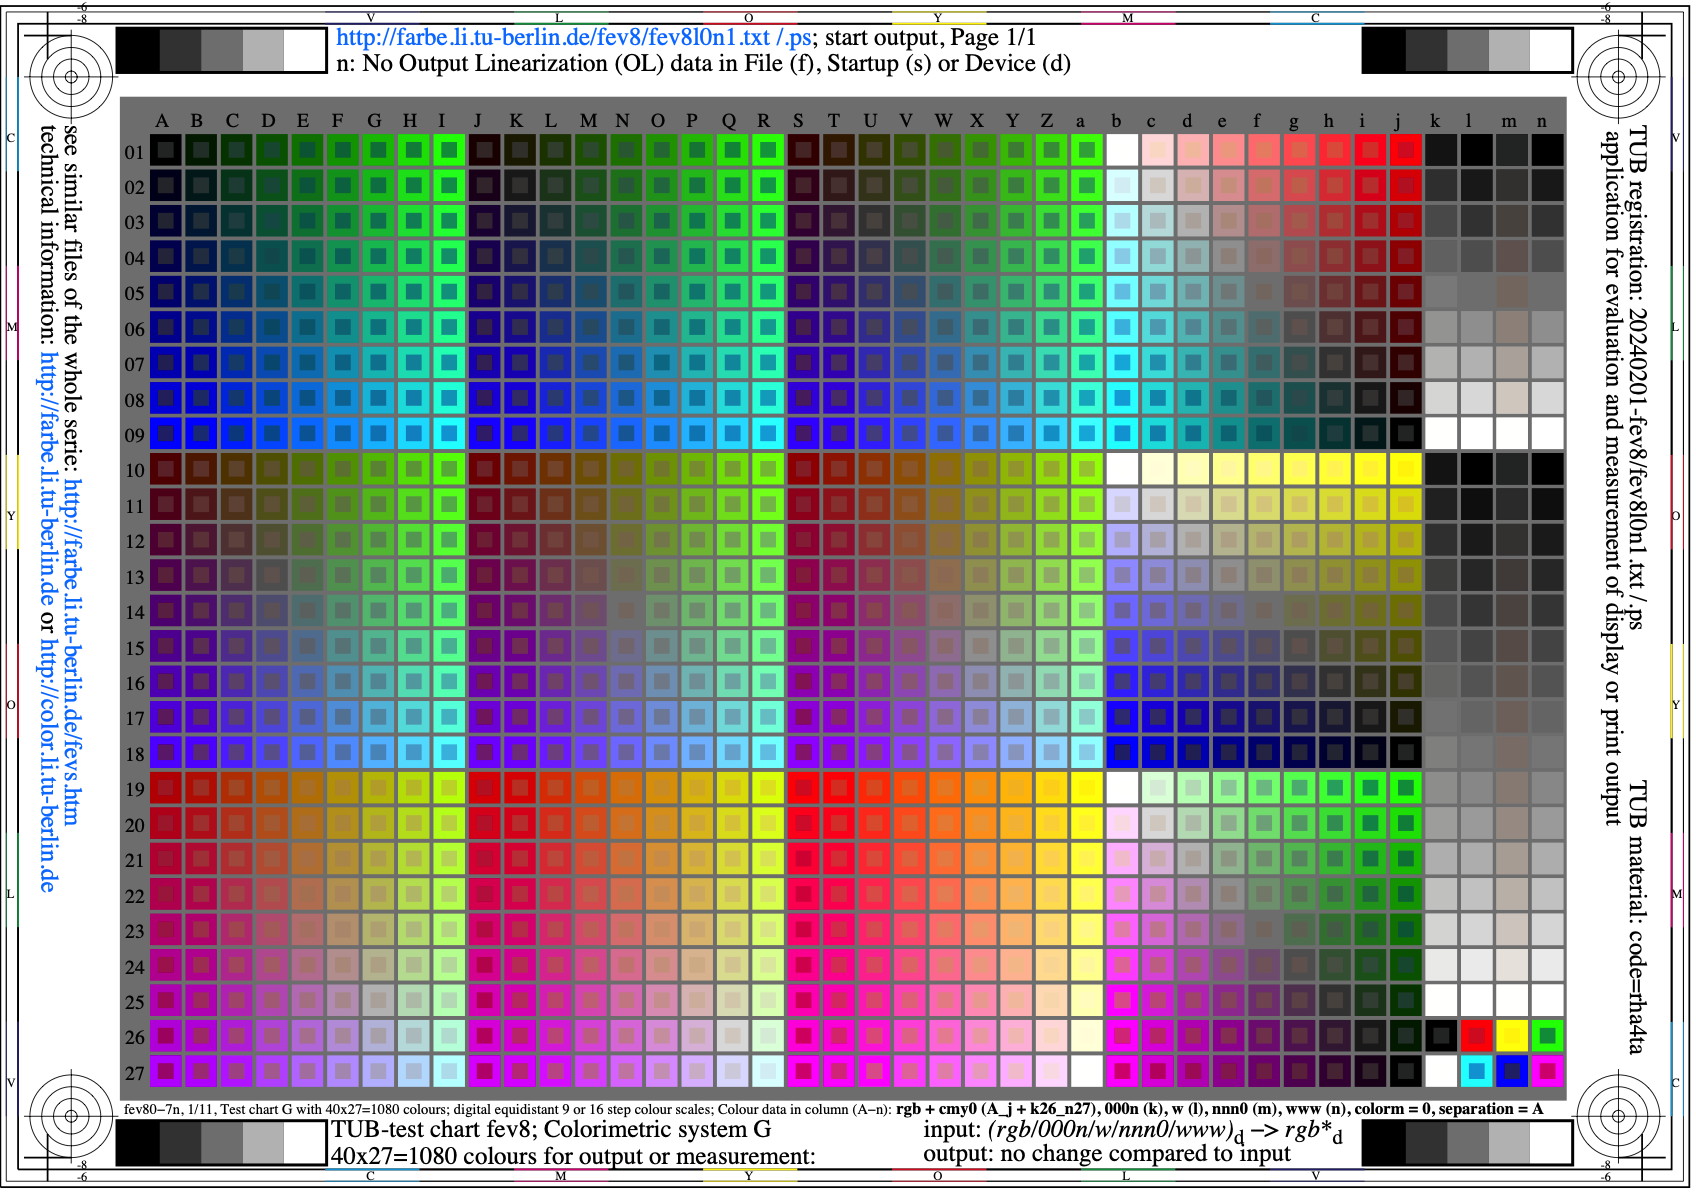
Image fev8l0n1.jpg: Output in format A6 of the file
fev8l0np.pdf, see
fev8l0n1.
PS /
TXT /
PDF /
jpg
fev8: TUB-test chart fev8; Under development

Image fev9l0n1.jpg: Output in format A6 of the file
fev9l0np.pdf, see
fev9l0n1.
PS /
TXT /
PDF /
jpg
fev9: TUB-test chart fev9; Under development

Image few0l0n1.jpg: Output in format A6 of the file
few0l0np.pdf, see
few0l0n1.
PS /
TXT /
PDF /
jpg
few0: TUB-test chart few0; Under development

Image few1l0n1.jpg: Output in format A6 of the file
few1l0np.pdf, see
few1l0n1.
PS /
TXT /
PDF /
jpg
few1: TUB-test chart few1; Under development

Image few2l0n1.jpg: Output in format A6 of the file
few2l0np.pdf, see
few2l0n1.
PS /
TXT /
PDF /
jpg
few2: TUB-test chart few2; Under development

Image few3l0n1.jpg: Output in format A6 of the file
few3l0np.pdf, see
few3l0n1.
PS /
TXT /
PDF /
jpg
few3: TUB-test chart few3; Under development

Image few4l0n1.jpg: Output in format A6 of the file
few4l0np.pdf, see
few4l0n1.
PS /
TXT /
PDF /
jpg
few4: TUB-test chart few4; Under development

Image few5l0n1.jpg: Output in format A6 of the file
few5l0np.pdf, see
few5l0n1.
PS /
TXT /
PDF /
jpg
few5: TUB-test chart few5; Under development

Image few6l0n1.jpg: Output in format A6 of the file
few6l0np.pdf, see
few6l0n1.
PS /
TXT /
PDF /
jpg
few6: TUB-test chart few6; Under development

Image few7l0n1.jpg: Output in format A6 of the file
few7l0np.pdf, see
few7l0n1.
PS /
TXT /
PDF /
jpg
few7: TUB-test chart few7; Under development

Image few8l0n1.jpg: Output in format A6 of the file
few8l0np.pdf, see
few8l0n1.
PS /
TXT /
PDF /
jpg
few8: TUB-test chart few8; Under development

Image few9l0n1.jpg: Output in format A6 of the file
few9l0np.pdf, see
few9l0n1.
PS /
TXT /
PDF /
jpg
few9: TUB-test chart few9; Under development

Image fex0l0n1.jpg: Output in format A6 of the file
fex0l0np.pdf, see
fex0l0n1.
PS /
TXT /
PDF /
jpg
fex0: TUB-test chart fex0; Under development

Image fex1l0n1.jpg: Output in format A6 of the file
fex1l0np.pdf, see
fex1l0n1.
PS /
TXT /
PDF /
jpg
fex1: TUB-test chart fex1; Under development

Image fex2l0n1.jpg: Output in format A6 of the file
fex2l0np.pdf, see
fex2l0n1.
PS /
TXT /
PDF /
jpg
fex2: TUB-test chart fex2; Under development

Image fex3l0n1.jpg: Output in format A6 of the file
fex3l0np.pdf, see
fex3l0n1.
PS /
TXT /
PDF /
jpg
fex3: TUB-test chart fex3; Under development

Image fex4l0n1.jpg: Output in format A6 of the file
fex4l0np.pdf, see
fex4l0n1.
PS /
TXT /
PDF /
jpg
fex4: TUB-test chart fex4; Under development

Image fex5l0n1.jpg: Output in format A6 of the file
fex5l0np.pdf, see
fex5l0n1.
PS /
TXT /
PDF /
jpg
fex5: TUB-test chart fex5; Under development

Image fex6l0n1.jpg: Output in format A6 of the file
fex6l0np.pdf, see
fex6l0n1.
PS /
TXT /
PDF /
jpg
fex6: TUB-test chart fex6; Under development

Image fex7l0n1.jpg: Output in format A6 of the file
fex7l0np.pdf, see
fex7l0n1.
PS /
TXT /
PDF /
jpg
fex7: TUB-test chart fex7; Under development

Image fex8l0n1.jpg: Output in format A6 of the file
fex8l0np.pdf, see
fex8l0n1.
PS /
TXT /
PDF /
jpg
fex8: TUB-test chart fex8; Under development

Image fex9l0n1.jpg: Output in format A6 of the file
fex9l0np.pdf, see
fex9l0n1.
PS /
TXT /
PDF /
jpg
fex9: TUB-test chart fex9; Under development

Image fey0l0n1.jpg: Output in format A6 of the file
fey0l0np.pdf, see
fey0l0n1.
PS /
TXT /
PDF /
jpg
fey0: TUB-test chart fey0; Under development

Image fey1l0n1.jpg: Output in format A6 of the file
fey1l0np.pdf, see
fey1l0n1.
PS /
TXT /
PDF /
jpg
fey1: TUB-test chart fey1; Under development

Image fey2l0n1.jpg: Output in format A6 of the file
fey2l0np.pdf, see
fey2l0n1.
PS /
TXT /
PDF /
jpg
fey2: TUB-test chart fey2; Under development

Image fey3l0n1.jpg: Output in format A6 of the file
fey3l0np.pdf, see
fey3l0n1.
PS /
TXT /
PDF /
jpg
fey3: TUB-test chart fey3; Under development

Image fey4l0n1.jpg: Output in format A6 of the file
fey4l0np.pdf, see
fey4l0n1.
PS /
TXT /
PDF /
jpg
fey4: TUB-test chart fey4; Under development

Image fey5l0n1.jpg: Output in format A6 of the file
fey5l0np.pdf, see
fey5l0n1.
PS /
TXT /
PDF /
jpg
fey5: TUB-test chart fey5; Under development

Image fey6l0n1.jpg: Output in format A6 of the file
fey6l0np.pdf, see
fey6l0n1.
PS /
TXT /
PDF /
jpg
fey6: TUB-test chart fey6; Under development

Image fey7l0n1.jpg: Output in format A6 of the file
fey7l0np.pdf, see
fey7l0n1.
PS /
TXT /
PDF /
jpg
fey7: TUB-test chart fey7; Under development

Image fey8l0n1.jpg: Output in format A6 of the file
fey8l0np.pdf, see
fey8l0n1.
PS /
TXT /
PDF /
jpg
fey8: TUB-test chart fey8; Under development

Image fey9l0n1.jpg: Output in format A6 of the file
fey9l0np.pdf, see
fey9l0n1.
PS /
TXT /
PDF /
jpg
fey9: TUB-test chart fey9; Under development

Image fez0l0n1.jpg: Output in format A6 of the file
fez0l0np.pdf, see
fez0l0n1.
PS /
TXT /
PDF /
jpg
fez0: TUB-test chart fez0; Under development

Image fez1l0n1.jpg: Output in format A6 of the file
fez1l0np.pdf, see
fez1l0n1.
PS /
TXT /
PDF /
jpg
fez1: TUB-test chart fez1; Under development

Image fez2l0n1.jpg: Output in format A6 of the file
fez2l0np.pdf, see
fez2l0n1.
PS /
TXT /
PDF /
jpg
fez2: TUB-test chart fez2; Under development

Image fez3l0n1.jpg: Output in format A6 of the file
fez3l0np.pdf, see
fez3l0n1.
PS /
TXT /
PDF /
jpg
fez3: TUB-test chart fez3; Under development

Image fez4l0n1.jpg: Output in format A6 of the file
fez4l0np.pdf, see
fez4l0n1.
PS /
TXT /
PDF /
jpg
fez4: TUB-test chart fez4; Under development

Image fez5l0n1.jpg: Output in format A6 of the file
fez5l0np.pdf, see
fez5l0n1.
PS /
TXT /
PDF /
jpg
fez5: TUB-test chart fez5; Under development

Image fez6l0n1.jpg: Output in format A6 of the file
fez6l0np.pdf, see
fez6l0n1.
PS /
TXT /
PDF /
jpg
fez6: TUB-test chart fez6; Under development

Image fez7l0n1.jpg: Output in format A6 of the file
fez7l0np.pdf, see
fez7l0n1.
PS /
TXT /
PDF /
jpg
fez7: TUB-test chart fez7; Under development

Image fez8l0n1.jpg: Output in format A6 of the file
fez8l0np.pdf, see
fez8l0n1.
PS /
TXT /
PDF /
jpg
fez8: TUB-test chart fez8; Under development

Image fez9l0n1.jpg: Output in format A6 of the file
fez9l0np.pdf, see
fez9l0n1.
PS /
TXT /
PDF /
jpg
fez9: TUB-test chart fez9; Under development
Section 2, Chapter F:
Colour Metrics for chromatic and luminance adaptation (2024)
This image page with 260 image series:
fe2s in English,
fg2s in German.
Previous image page:
ee2s in English,
eg2s in German.
Next image page, see
ge2s in English,
gg2s in German.
Introduction, content list and summary:
feai,
fea_i,
fea_s in English or
fgai,
fga_i,
fga_s in German.
-------
Für Archiv-Information (2000-2009) des BAM servers "www.ps.bam.de"
(2000-2018)
über Prüfvorlagen,
farbmetrische Berechnungen, Normen und Veröffentlichungen, siehe
indexAE.html in englisch,
indexAG.html in deutsch.
Zurück zur TUB-Hauptseite (NICHT Archiv), siehe
index.html in englisch,
indexDE.html. in deutsch.