240115 'ENAX' http://farbe.li.tu-berlin.de/eea_i.htm or
http://color.li.tu-berlin.de/eea_i.htm.
'ANAX':@PROZ_AEA_I.COM format: LINKSEA_D.HTM
Chapter A:
Colour Image Technology and Colour Management (2019)
, see
Introduction, content list and summary:
AEAI,
AEA_I,
AEA_S in English or
AGAI,
AGA_I,
AGA_S in German.
Image pages with 10 and 260 image series:
AEAS,
ae2s in English or
AGAS,
ag2s in German.
Chapter B:
Colour Vision and Colorimetry (2020)
, see
Introduction, content list and summary:
BEAI,
BEA_I,
BEA_S in English or
BGAI,
BGA_I,
BGA_S in German.
Image pages with 10 and 260 image series:
BEAS,
be2s in English or
BGAS,
bg2s in German.
Chapter C:
Colour Spaces, Colour Differences, and Line Elements (2021)
, see
Introduction, content list and summary:
CEAI,
CEA_I,
CEA_S in English or
CGAI,
CGA_I,
CGA_S in German.
Image pages with 10 and 260 image series:
CEAS,
ce2s in English or
CGAS,
cg2s in German.
Chapter D:
Colour Appearance, Elementary Colours, and Metrics (2022)
, see
Introduction, content list and summary:
DEAI,
DEA_I,
DEA_S in English or
DGAI,
DGA_I,
DGA_S in German.
Image pages with 10 and 260 image series:
DEAS,
de2s in English or
DGAS,
dg2s in German.
Chapter E:
Colour Metrics, Differences, and Appearance (2023)
, see
Introduction, content list and summary:
eeai,
eea_i,
eea_s in English or
egai,
ega_i,
ega_s in German.
Image pages with 10 and 260 image series:
eeas,
ee2s in English or
egas,
eg2s in German.
Chapter F:
Colour Metrics for chromatic and luminance adaptation (2024)
, under work, see
Introduction, content list and summary:
feai,
fea_i,
fea_s in English or
fgai,
fga_i,
fga_s in German.
Image pages with 10 and 260 image series:
feas,
fe2s in English or
fgas,
fg2s in German.
Project title: Colour and colour vision with Ostwald, device, and elementary colours -
Antagonistic colour-vision model TUBJND and properties for many applications
Chapter E: Colour Metrics, Differences, and Appearance (2023),
Main part eea_i, under work
Each chapter includes main parts (I) with information to an image part (S).
There are 26 image parts (S), each with 10 figure pages.
The 10 figure pages (0 to 9) include up to 16 figures,
and each figure with up to six formats.
Structure, content, and order of files and figures on the example chapter
Colour Vision and Colorimetry
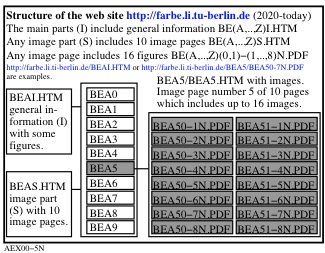
Figure 1 shows the structure of the web site BE(A..Z)I.HTM und BE(A..Z)S.HTM.
For the download of this figure in the VG-PDF format, see
AEX00-5N.PDF.
Structure, content, and order of files and figures on the web site
http://farbe.li.tu-berlin.de.
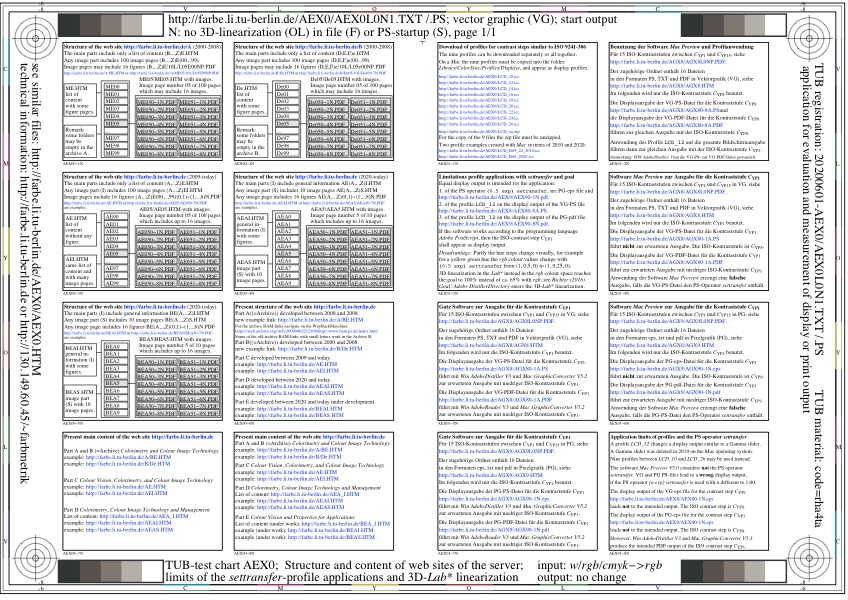
Figure 2 shows the structure, the content, and the order of files and figures on the web site
http://farbe.li.tu-berlin.de.
For the download of this figure in the VG-PDF format, see
AEX0L0NP.PDF.
List of links to the contents of all image parts
Image part eeas
in English or egas in German.
Title: Line elements of higher colourimetry;
CIELAB, LABJND, TUBJND, CIEDE2000, see CIE 230:2019;
regularity index according to ISO/IEC 15775:2022;
lightness, Y difference, sensitivity and contrast;
relative lightness as basis for grey scaling
1. Introduction and goals.
2. Line elements of higher colourimetry;
CIELAB, LABJND, TUBJND, CIEDE2000, see CIE 230:2019.
3. Regularity index g* according to ISO/IEC 15775:2022, Annex G.
4. Relative lightness L*/L*u.
5. Relative Y difference delta_Y/delta_Yu.
6. Relative sensitivity (delta_Y/Y)/(delta_Yu/Yu).
7. Relative contrast (Y/delta_Y)/(Yu/delta_Yu).
8. Discussion of results for colour vision.
for further information and discussion,
see eeai.
go to the image part eeas
to study the 10 image pages and the content.
Image part eebs
in English or egbs in German.
Title: Colour loop, contrast steps according to ISO 9241-306,
image-output quality by regularity index g*
according to ISO/IEC 15775
1. Introduction and goals.
2. Colour loop: ISO file - print output - scan or camera input - ISO file.
3. Contrast steps CYP1 to CYP8 according to ISO 9241-306:2018.
4. Images with raw data rgb and linearized data rgb*.
5. Image-output quality by the regularity index g* according to
ISO/IEC 15775:2022.
6. 7 sets of image data and regularity indices between under and over exposure
for slide and negative film.
7. ISO image with 4 resolutions for slide and negative film.
8. Discussion of image quality.
go to the image part eebs
to study the 10 image pages and the content.
Image part eecs
in English or egcs in German.
Title: Colourimetry of displays;
colour images for visual and colourimetric spacing
1. Introduction and goals.
2. Lightnes L* according to CIE 15, and relative lightness
T* according to IEC 61966-2-1 (sRGB-colour space).
3. Table data CIEXYZxy and CIELAB for three normalizations:
YW=100 according to CIE 15 & ISO/TS 28028-5 (diffuse white)
YW=90 according to ISO/IEC 15775 & ISO 9241-306,
YW=500 according to ISO/TS 28028-5 (peak white).
4. Test charts with 1080 colours, 729(=9x9x9) are equally spaced,
flower motiv with 16 equally spaced grey steps (slide and negative film)
according to ISO/IEC 15775 & ISO 9241-306.
5. All test charrts with 16 relative gamma values 0,5 <= g <= 2,
Identical image with g=1 for visual test if the output appears equal
(Yes/No).
6. Discussion of aplications.
go to the image part eecs
to study the 10 image pages and the content.
Image part eeds
in English or egds in German.
Title: Colour vision, chroma and elementary colours in
chromaticity and chroma diagrams
1. Introduction and goals.
2. Colour vision and elementary colours.
3. CIE-test colours, Miescher and Munsell-elementary colours.
4. Affin colour metrics; chroma enhancement and chroma reduction#w"
5. Munsell Chroma 2 and Value 1, 5, and 9 in chromaticity and
chroma diagrams:
6. (x2, y2), (x2*, y2*), (a', b'), (a*, b*), (p2, q2), (P2*, Q2*)
(a2, b2), (A2*, A2*).
7. Discussion of results for the description of chroma
and the elementary colours.
go to the image part eeds
to study the 10 image pages and the content.
Image part eees
in English or eges in German.
Title: Relative logarithmic colorimetric variables
as logarithmic and linear function of Y;
lightness, Y-differenz, sensitivity and contrast;
colour spaces CIELAB and TUBJND, see CIE 230
1. Introduction and goals.
2. Equally spaced grey series 1,8 < Y < 180 for 4 display reflections;
Yref=1,8, 3,6, 7,2 and 14,4 with regularity index;
g* according to ISO/IEC 15775:2022.
3. Relative lightness L*/L*u.
4. Relative Y-differenz delta_Y/delta_Yu.
5. Relative sensitivity (delta_Y/Y)/(delta_Yu/Yu).
6. Relative contrast (Y/delta_Y)/(Yu/delta_Yu).
7. Discussion of results for colour vision.
go to the image part eees
to study the 10 image pages and the content.
Image part eefs
in English or egfs in German.
Title: Relative linear colorimetric variables
as logarithmic and linear function of Y;
lightness, Y-differenz, sensitivity and contrast;
colour spaces CIELAB and TUBJND, see CIE 230
1. Introduction and goals.
2. Equally spaced grey series 3,6 < Y < 90 for four display reflections
Yref=0,4, 90, 1,8 and 3,6 with regularity index
g* according to ISO/IEC 15775:2022.
3. Relative lightness L*/L*u.
4. Relative Y-differenz delta_Y/delta_Yu.
5. Relative sensitivity (delta_Y/Y)/(delta_Yu/Yu).
6. Relative contrast (Y/delta_Y)/(Yu/delta_Yu).
7. Discussion of results for colour vision.
go to the image part eefs
to study the 10 image pages and the content.
Image part eegs
in English or eggs in German.
Title: Ostwald optimal colours as surface-colour reference;
Tristimulus values Yu for equal greyness;
Antagonistic receptor functions Fab and derivation F'ab;
Fab as eponential functions of the relative luminance and
the contrast.
1. Introduction and goals.
2. Ostwald optimal colours as surface-colour reference.
3. Tristimulus values Yu for equal greyness
as function of (x,y);
4. Antagonistic receptor functions Fab and derivation F'ab.
5. Fab as exponential functions e^x and 10^x with the
relative luminance x=log(L/Lu).
6. Fab and F'ab as function of the contrast
C=Lw:Ln.
go to the image part eegs
to study the 10 image pages and the content.
Image part eehs
in English or eghs in German.
Title: Three CIE standard illuminants D65, D50, and A
for the calculation of the Ostwald-optimal colours for CIE 02-degree;
complementary optimal colours with antagonistic tristimulues values
X, Y, Z, and Xw-X, Yw-Y, Zw-Z
in the CIE chromaticity diagram (x, y), and
colorimetric chromaticity and chromatic values diagrams.
1. Introduction and goals.
2. Relative sprectral radiation of the 3 illuminants D65, D50, and A.
3. Wavelength ranges of the Ostwald colours for D65, D50, and A.
4. Calculations of tristimulues values
X, Y, Z, and Xw-X, Yw-Y, Zw-Z, as well as
wavelength limits, dominant and complementary wavelength.
5. Alternative starting wavelength limits compared to the
preferred limits.
6. Equal chromatic values for the antagonistic colour pairs
R-C, Y-B und G-M
in the chromatic value diagram (A2, B2),
and comparison with CIELAB chroma.
go to the image part eehs
to study the 10 image pages and the content.
Image part eeis
in English or egis in German.
Title: Ostwald optimal colours as surface-colour reference;
Tristimulus values Yu for equal greyness.
9 step colour series for gamma optimization for 15 display reflections
according to ISO 9241-306:2018 and ISO/IEC 15775:2022.
Application programs for output linearization of still images and
video.
1. Introduction and goals.
2. Ostwald optimal colours as surface-colour reference.
3. Tristimulus values Yu for equal greyness
as function of (x,y) for CIE standard illuminant A.
4. 9 step colour series for gamma optimization for 15 display reflections
according to ISO 9241-306:2018 and ISO/IEC 15775:2022.
5. Gamma data on one page for 15 or only one value.
6. Application programs for output linearization of still images
and video.
go to the image part eeis
to study the 10 image pages and the content.
Image part eejs
in English or egjs in German.
Title: Achromatic and chromatic thresholds as function of tristimulus
value Y;
Properties and application limits of HDR and SDR displays
Global and local colour management;
TUBJND colour vison model: receptor-response functions Fab
and derivations F'ab for different parameters a,b;
CIELABr- and TUBJNADr- relative (r) colour spaces and colour differences;
logarithmic and linear relative (r) coordinates of lightness L*,
threshold data delta_Y, sensitivity delta_Y/Y,
and contrast Y/delta_Y for the colour spaces CIELABr and TUBJNDr.
1. Introduction and goals.
2. Achromatic and chromatic thresholds as function of tristimulus
value Y.
3. Properties and application limits of HDR and SDR displays.
4. Global and local colour management.
5. TUBJND colour vison model: receptor-response functions Fab and
derivations F'ab for different parameters a,b.
6. Receptor sensitivities R+, G-, Y+ and derivations R+', G-', Y+'.
7. Amplituds modulations (Y+) + (R+'/G-') and (Y+) + (R+/G-).
8. CIELABr- and TUBJNADr- relative (r) colour spaces and colour differences.
9. logarithmic and linear relative (r) coordinates of lightness L*;
threshold data delta_Y, sensitivity delta_Y/Y;
and contrast Y/delta_Y for the colour spaces CIELABr and TUBJNDr.
go to the image part eejs
to study the 10 image pages and the content.
Image part eeks
in English or egks in German.
Title: Equally spaced 9 step grey scales according to CIELAB
for four display reflections
Yref=3,6, 1,8, 0,9, (90, 108, 126, 180, 54) on ten pages
1. Introduction and goals.
2. Five lightness and tristimulus value ranges
between black N and white W.
3. delta L*N to L*W: 22,3_96, 20_103, 18,2_109,3, 14,4_125, 29,4_78,5.
4. delta YN to YW: 3,6_90, 3,0_108, 2,6_126, 1,8_180, 6_54.
5. with regularity index g* according to ISO/IEC 15775:2022,
annex G.
6. Discussion of gamma values for different ranges.
go to the image part eeks
to study the 10 image pages and the content.
Image part eels
in English or egls in German.
Title: Equally spaced 9 step grey scales according to TUBJND1
for four display reflections
Yref=3,6, 1,8, 0,9, 90 on eight pages
1. Introduction and goals.
2. Five lightness and tristimulus value ranges
between black N and white W.
3. delta L*N to L*W: 22,3_96, 20_103, 18,2_109,3, 14,4_125, 29,4_78,5.
4. delta YN to YW: 3,6_90, 3,0_108, 2,6_126, 1,8_180, 6_54.
5. with regularity index g* according to ISO/IEC 15775:2022,
annex G.
6. Discussion of gamma values for different ranges.
go to the image part eels
to study the 10 image pages and the content.
Image part eems
in English or egms in German.
Title: Application software and links to the digital ISO-test charts
according to ISO 9241-306:2018 and ISO/IEC 15775:2022.
9 step colour series for gamma optimization for 15 display reflections.
Application programs for output linearization of still images and
video.
1. Introduction and goals.
2. Application software for the ergonomic display output with
gamma optimization for still images and video.
3. Links to the digital ISO-test charts for the ergonomic
display output according to ISO 9241-306:2018 and ISO/IEC 15775:2022.
4. 9 step colour series for gamma optimization for 15 display reflections
according to ISO 9241-306:2018 and ISO/IEC 15775:2022.
5. Gamma data on one page for 15 values or only one value.
go to the image part eems
to study the 10 image pages and the content.
Image part eens
in English or egns in German.
Title: TUBJND colour vision model for scaling, threshold, adaptation,
and presentation time;
Antagonistic receptor responses for achromatic and chromatic colours;
Amplitude modulation of achromatic and chromatic differences on
achromatic responses
1. Introduction and goals.
2. Receptor-response function of Richter (1995),
see http://color.li.tu-berlin.de/BUA4BF.PDF, and as function with tanh.
3. Threshold, contrast L/delta_L, and lightness L*
with internal attribute relations.
4. Line element, contrast, and lightness according to Weber-Fechner,
Stiles, and Walraven.
5. TUBJND-colour-vision model for scaling, threshold, and presentation time.
6. Psycho-physical models as function of the relative luminance
x=log(L/Lu) and adaptation Lu.
7. Antagonistic receptor responses for achromatic and chromatic colours.
8. Amplitude modulation of achromatic and chromatic differences on
achromatic responses.
go to the image part eens
to study the 10 image pages and the content.
Image part eeos
in English or egos in German.
Title: Colour metrics for light and colour as function of the
relative luminance L/Lu (Lu=surround luminance)
Experimental data and model functions Q/Fab(xr).
1. Introduction and goals.
2. Experimental data from a book for xr=log(L/Lu);
3. Response functions Q/Fab[e^(xr/a) or 10^(xr/a')] with
a'=a ln(10).
4. Deviations of the response functions for luminance discrimination.
5. Antichromatic models of colour vision.
6. Receptor sensitivity for achromatic colours.
7. Logarithmic and linear models for combinations of the sensitivities.
for further information and discussion,
see DEAI.
go to the image part eeos
to study the 10 image pages and the content.
Image part eeps
in English or egps in German.
Title: Equally spaced 9 step grey scales according to CIELAB
for four display reflections
Yref=3,6, 0,4, 0,9, 1,8 on ten pages
1. Introduction and goals.
2. Five lightness and tristimulus value ranges
between black N and white W.
3. delta L*N to L*W: 22,3_96, 4_96, 8,1_96, 14,4_96, 18_96.
4. delta YN to YW: 3,6_90, 0,4_90, 0,9_90, 1,8_90, 2,5_90.
5. with regularity index g* according to ISO/IEC 15775:2022,
annex G.
6. Discussion of gamma values for different ranges.
go to the image part eeps
to study the 10 image pages and the content.
Image part eeqs
in English or egqs in German.
Title: Equally spaced 9 step grey scales according to CIELAB
for four display reflections
Yref=2,5, 10, 20, 90 on ten pages
1. Introduction and goals.
2. Five lightness and tristimulus value ranges
between black N and white W.
3. delta L*N to L*W: 22,3_96, 4_96, 8,1_96, 14,4_96, 18_96.
4. delta YN to YW: 3,6_90, 0,4_90, 0,9_90, 1,8_90, 2,5_90.
5. with regularity index g* according to ISO/IEC 15775:2022,
annex G.
6. Discussion of gamma values for different ranges.
go to the image part eeqs
to study the 10 image pages and the content.
Image part eers
in English or egrs in German.
Title: Colour metrics for light and colour as function of the
relative luminance L/Lu (Lu=surround luminance)
Experimental data and model functions Fab(xr) and Fcb(xr).
1. Introduction and goals.
2. Experimental data of Lingelbach for xr=log(L/Lu);
3. Two functions Fab for xr<=0 and Fcb for xr>=0;
4. under development.
for further information and discussion,
see DEAI.
go to the image part eers
to study the 10 image pages and the content.
Image part eess
in English or egss in German.
Title:
Colour metrik for 5 surround luminances Lu between 0,1 and 1000 cd/m^2,
Thresholds delta_L (0,4s), contrast and lightness,
experimental data of Lingelbach and Richter.
1. Introduction and goals.
2. Colour metrik for 5 surround luminances Lu between 0,1 and 1000 cd/m^2;
3. Thresholds delta_L (0,4s), contrast and lightness;
4. experimental data of Lingelbach and Richter;
5. All data as function of the central field luminance x=log(L)
for 5 surround luminances Lu.
go to the image part eess
to study the 10 image pages and the content.
Image part eets
in English or egts in German.
Title: Chromatic hue circle, values and wavelength limits of the
Ostwald-optimal
colours for 8 illuminants Pxx and Dxx.
1. Introduction and goals.
2. Antagonistic colour circles, hue planes and chromatic values of the
Ostwald-optimal colours for 4 illuminants and 4 contrasts.
3. Ostwald-optimal colours for 8 illuminants Pxx and Dxx;
normalization 0 <= Y <= 100, and 3,6 <= Y <= 90.
4. Chromatic values (A1,B1) and (A2,B2) of the Ostwald-optimal colours;
normalization 0 <= Y <= 100, and 3,6 <= Y <= 90;
5. Wavelength limits of the Ostwald-colour halfs.
go to the image part eets
to study the 10 image pages and the content.
Image part eeus
in English or egus in German.
Title: Chromatic values and wavelength limits of the Ostwald-optimal
colours for 6 illuminants D65, D50, A, P65, P50 und P30.
1. Introduction and goals.
2. Ostwald-optimal colours for six illuminants
D65, D50, A, P65, P50, and P30;
normalization 3,6 <= Y <= 90
3. Data CIE_XYZxy and TUB_YABCh2 of Ostwald optimal colours;
normalization 3,6 <= Y <= 90.
4. Data CIE-Yo and TUB_cab,2 of the Ostwald colours as function
of hue angle TUB_hab,2,
and dominant wavelenght lamdad.
go to the image part eeus
to study the 10 image pages and the content.
Image part eevs
in English or egvs in German.
Title: Antagonistic colorimetric properties of the Ostwald-optimal
colours, CIE & TUB-colour metric and cone sensitivities
1. Introduction and goals.
2. Ostwald-optimal colours for 2 illuminants and 2 observers.
3. TUB-model: linear and logarithmic sesitivities and saturation for L
and M cones.
4. Linear and logarithmic sesitivities for L and M
cones according to CIE 15 and CIE 170.
5. Three set of display colours in (x, y) and (A2, B2) for colours of
Ostwald, sRGB, WCGa according to ISO 22028-5
for Yw=100 and 90.
6. Table data CIEXYZxy, CIELAB, TUBLAB2 for colours of
Ostwald, sRGB, WCGa according to ISO 22028-5
for Yw=100 and 90.
7. Discussion.
go to the image part eevs
to study the 10 image pages and the content.
Image part eews
in English or egws in German.
Title: Special figures of the antagonistic TUB colour vision model
for chromatic and luminance adaptation;
usually 4x4 figures are combined for an easy comparison
1. Introduction and goals.
2. Spectral and antagonistic colour properties.
3. Cone sensitivities according to CIE 170 and application in the TUB model.
4. Colorimetric coordinates based on Ostwald colours.
5. Chromatic adaptation and colour constancy based on
Ostwald colours.
6. Antagonistic spectra, chromatic values, hue discrimination, and contrast
of Ostwald and optimal colours.
go to the image part eews
to study the 10 image pages and the content.
Image part eexs
in English or egxs in German.
Title: TUB-LMS colour-vision model, lin[threshold]=0 & 0,04 & 0,10;
lin[sensitivity] and lin[ratio]
1. Introduction and goals.
2. Cone ratio L:M:S, saturation V;
3. Sensitivities LMV->L/V & M/V and OLM->O/L & M/L;
4. Four adaptations: 620,570,520,470 and 595,570,545,520;
5. Sensitivity 557,457,507, VNg->V/g & N/g, WN-antigonisme;
6. Sensitivity 570,470,520, LBG->L/G & B/G, YB-antigonisme.
go to the image part eexs
to study the 10 image pages and the content.
Image part eeys
in English or egys in German.
Title: TUB-LMS colour-vision model, lin[threshold]=0 & 0,04 & 0,10;
log[sensitivity] and log[ratio]
1. Introduction and goals.
2. Cone ratio L:M:S, saturation V;
3. Sensitivities LMV->L/V & M/V and OLM->O/L & M/L;
4. Four adaptations: 620,570,520,470 and 595,570,545,520;
5. Sensitivity 557,457,507, VNg->V/g & N/g, WN-antigonisme;
6. Sensitivity 570,470,520, LBG->L/G & B/G, YB-antigonisme.
go to the image part eeys
to study the 10 image pages and the content.
Image part eezs
in English or egzs in German.
Title: Test with frame and image sizes;
Wavelength ranges of Ostwald colours
of equal blackness N*,
reflections for the contrast C=25:1, and
antagonistic physiological +-signals.
1. Introduction and goals.
2. Wavelength ranges of six Ostwald colours;
3. Eigen (e) and antagonistic (a) Ostwald colours;
4. Standard reflection R, relative reflection Rr=R/0,180
(index r=relative), and Rs=log(Rr) (index s=sensation);
5. Triangle lightness T*TUB, Blackness N* (index n), and
Whiteness W* (index w);
6. Antagonistic reflections of Ostwald colours for the contrast
C=25:1;
7. Antagonistic physiological +-signals and colour attributes.
go to the image part eezs
to study the 10 image pages and the content.
-------
For the start TUB web site (not archive), see
index.html in English,
indexDE.html in German.
For the archive information (2000-2009) of the BAM server
"www.ps.bam.de" (2000-2018)
about colour test charts, colorimetric calculations,
standards, and publications, see
indexAE.html in English,
indexAG.html in German.