Figure eej0l0n1.jpg: Output in format A6 of the file eej0l0np.pdf, see
eej0l0n1. ps / txt / pdf / jpg
240215 1L2L0X0F_K2710.KTS/YEjlEIN.KTS, http://farbe.li.tu-berlin.de/eejs.htm or http://color.li.tu-berlin.de/eejs.htm
For links to the
Section 2, Chapter E
Colour Metrics, Differences, and Appearance (2023),
see
For this image page with 10 colour series, see
eejs in English,
egjs in German.
For the previous image page, see
eeis in English,
egis in German.
For the next image page, see
eeks in English,
egks in German.
For the first image page of the previous chapter D, see
DEAS in English,
DGAS in German.
For the first image page of the next chapter F (under work), see
feas in English,
fgas in German.
Content list of chapter E:
eea_i in English or
ega_i in German.
Summary of chapter E:
eea_s in English or
ega_s in German.
For the large image page of chapter E with 260 colour series, see
ee2s in English or
eg2s in German.
Section 2, Chapter E
Colour Metrics, Differences, and Appearance (2023),
Image part eejs
The following ten pages eej0 to eej9 of this chapter
show the content with links to the single figures
in up to six formats.
Figure eej0l0n1.jpg: Output in format A6 of the file
eej0l0np.pdf, see
eej0l0n1.
ps /
txt /
pdf /
jpg
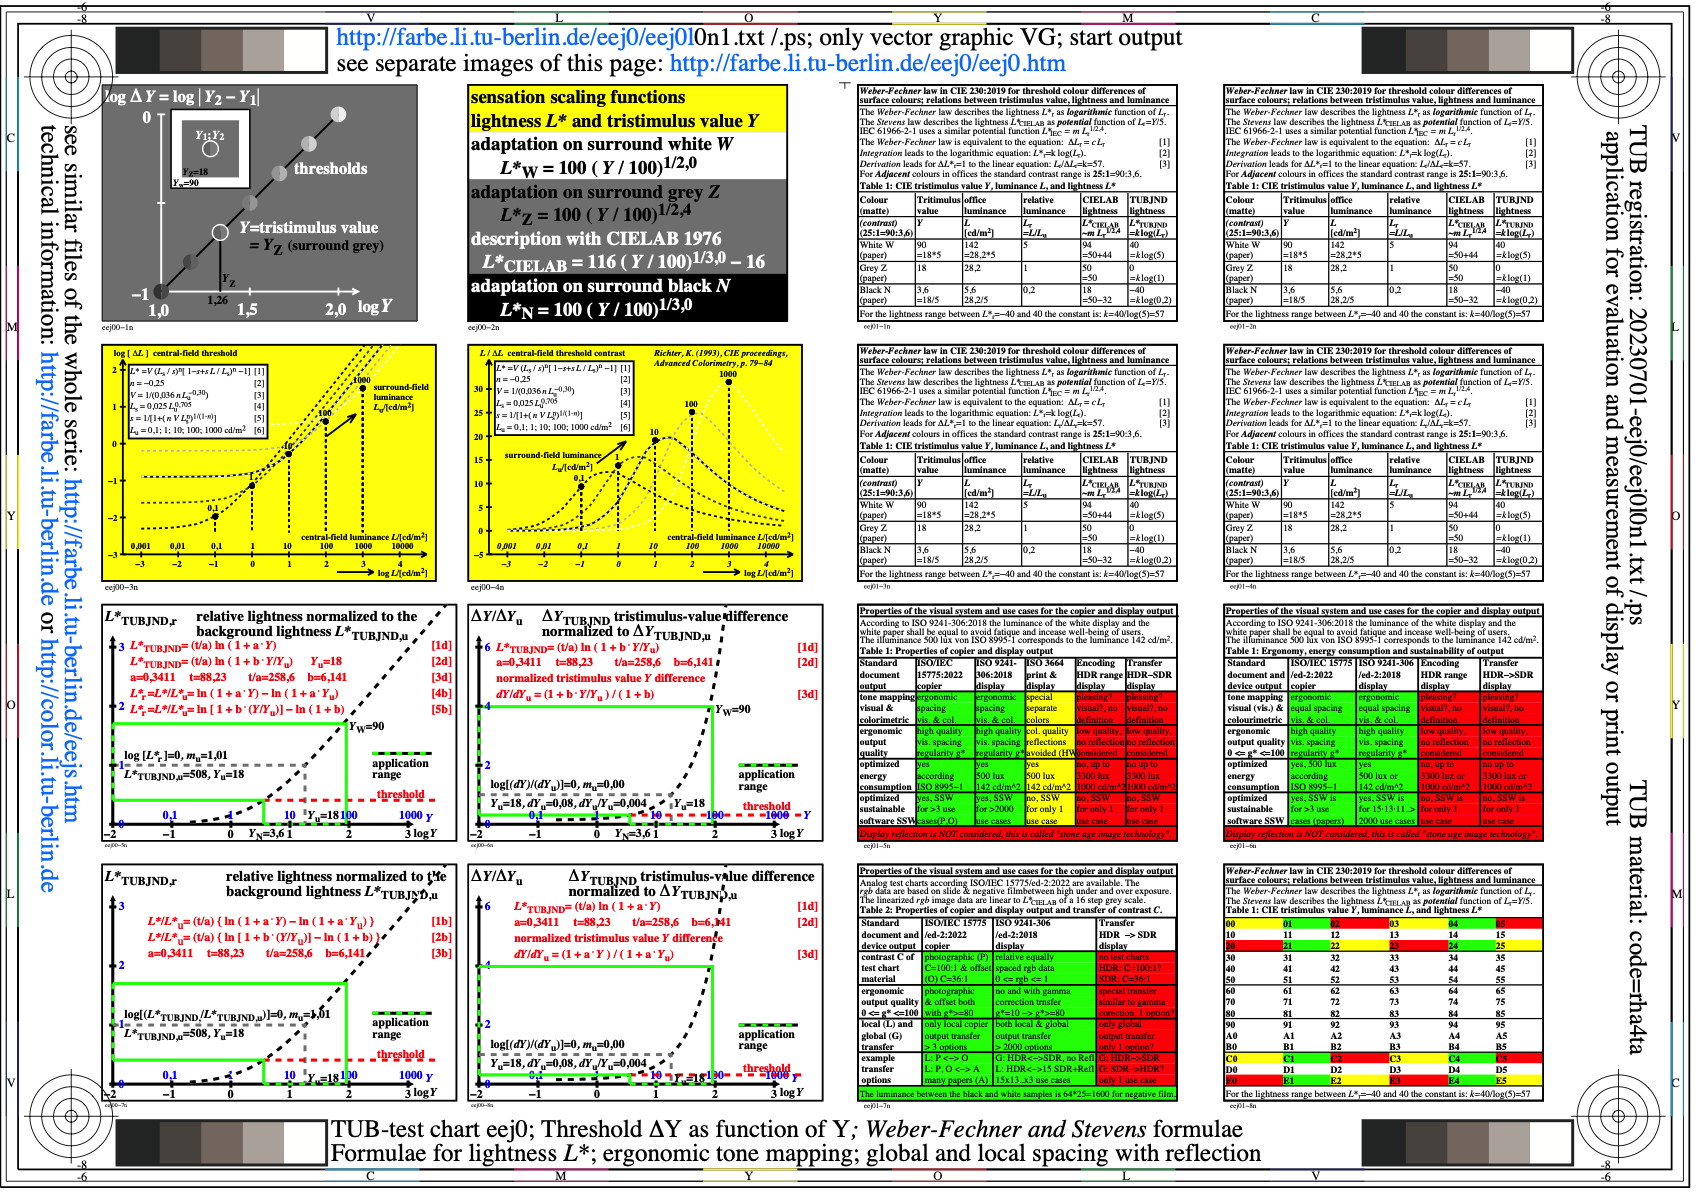
eej0: TUB-test chart eej0; Thresholds delta_Y as function of Y
Weber-Fechner and Stevens-formulae for colour differences
HDR and SDR displays, global and local colour management
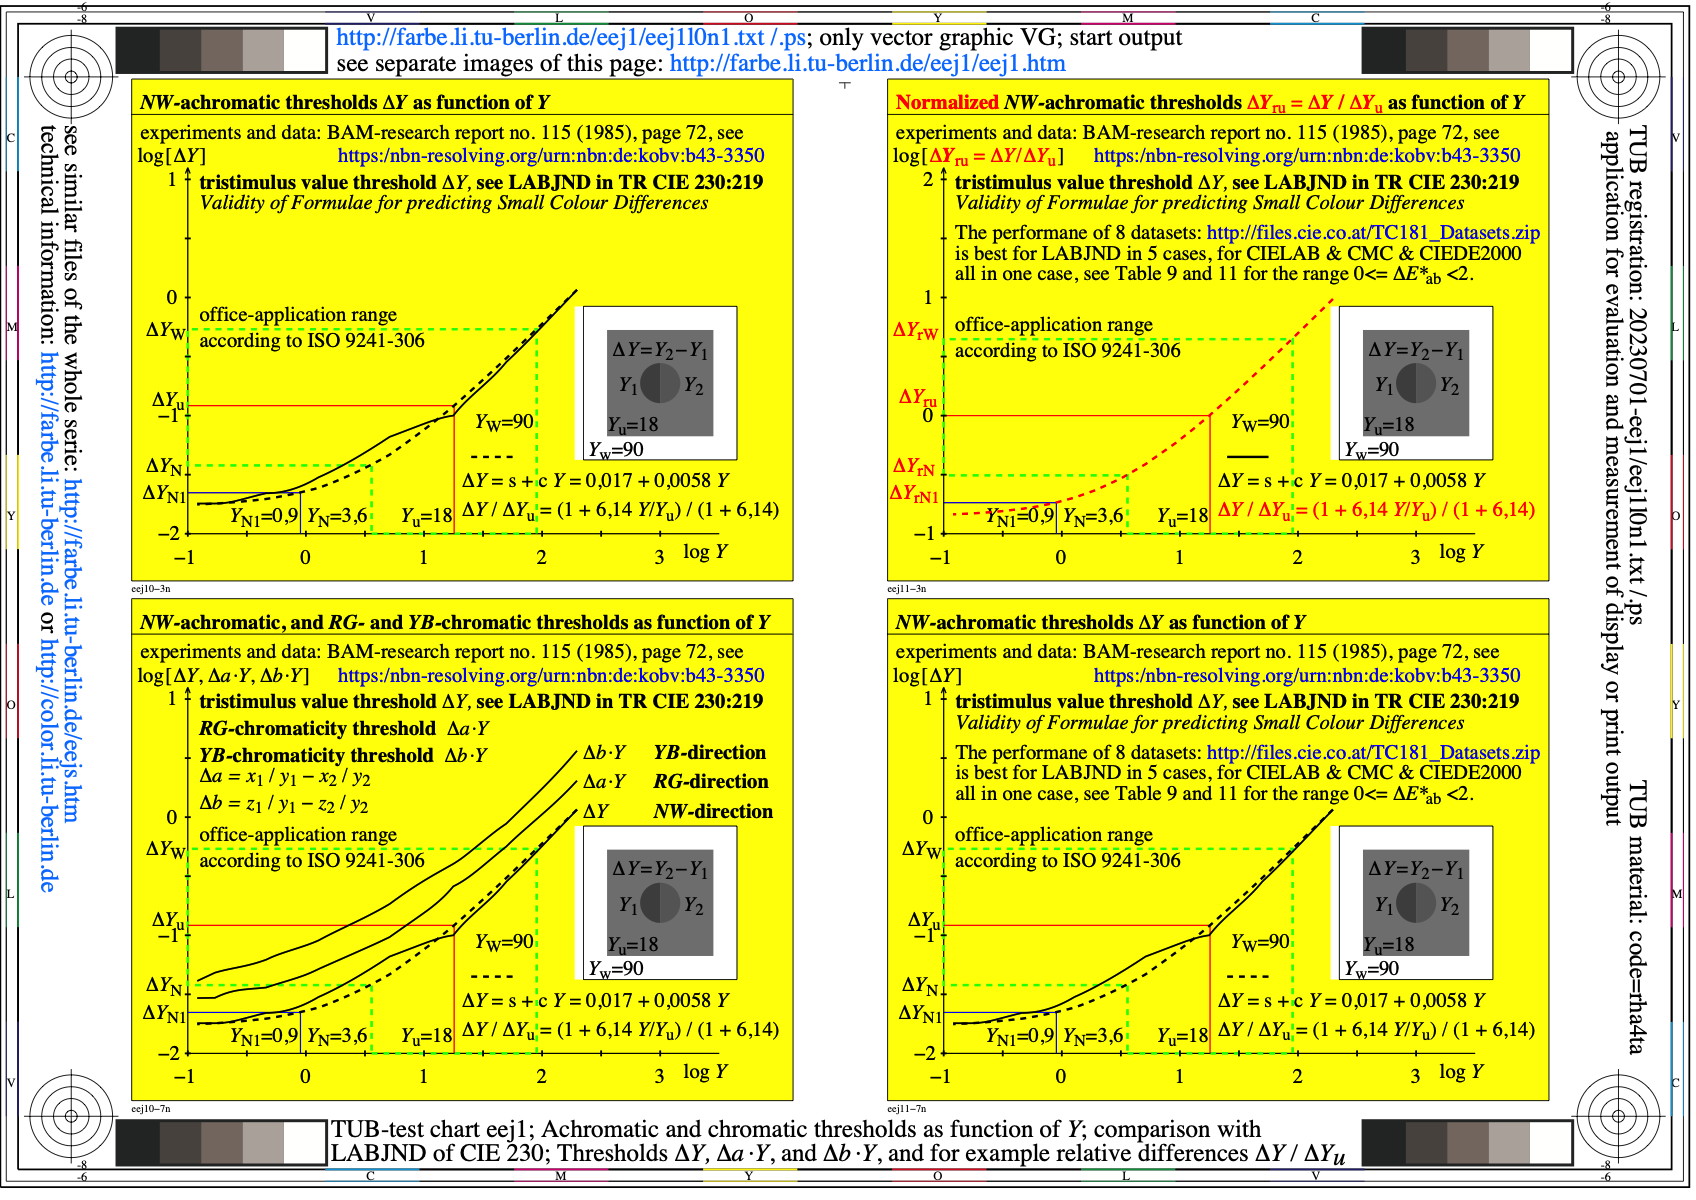
Figure eej1l0n1.jpg: Output in format A6 of the file
eej1l0np.pdf, see
eej1l0n1.
ps /
txt /
pdf /
jpg
eej1: TUB-test chart eej1; Achromatic and chromatic thresholds
Aplication in CIE 230:2019; Threshold delta_Y
and relative differences delta_Y/delta_Yu as function of Y
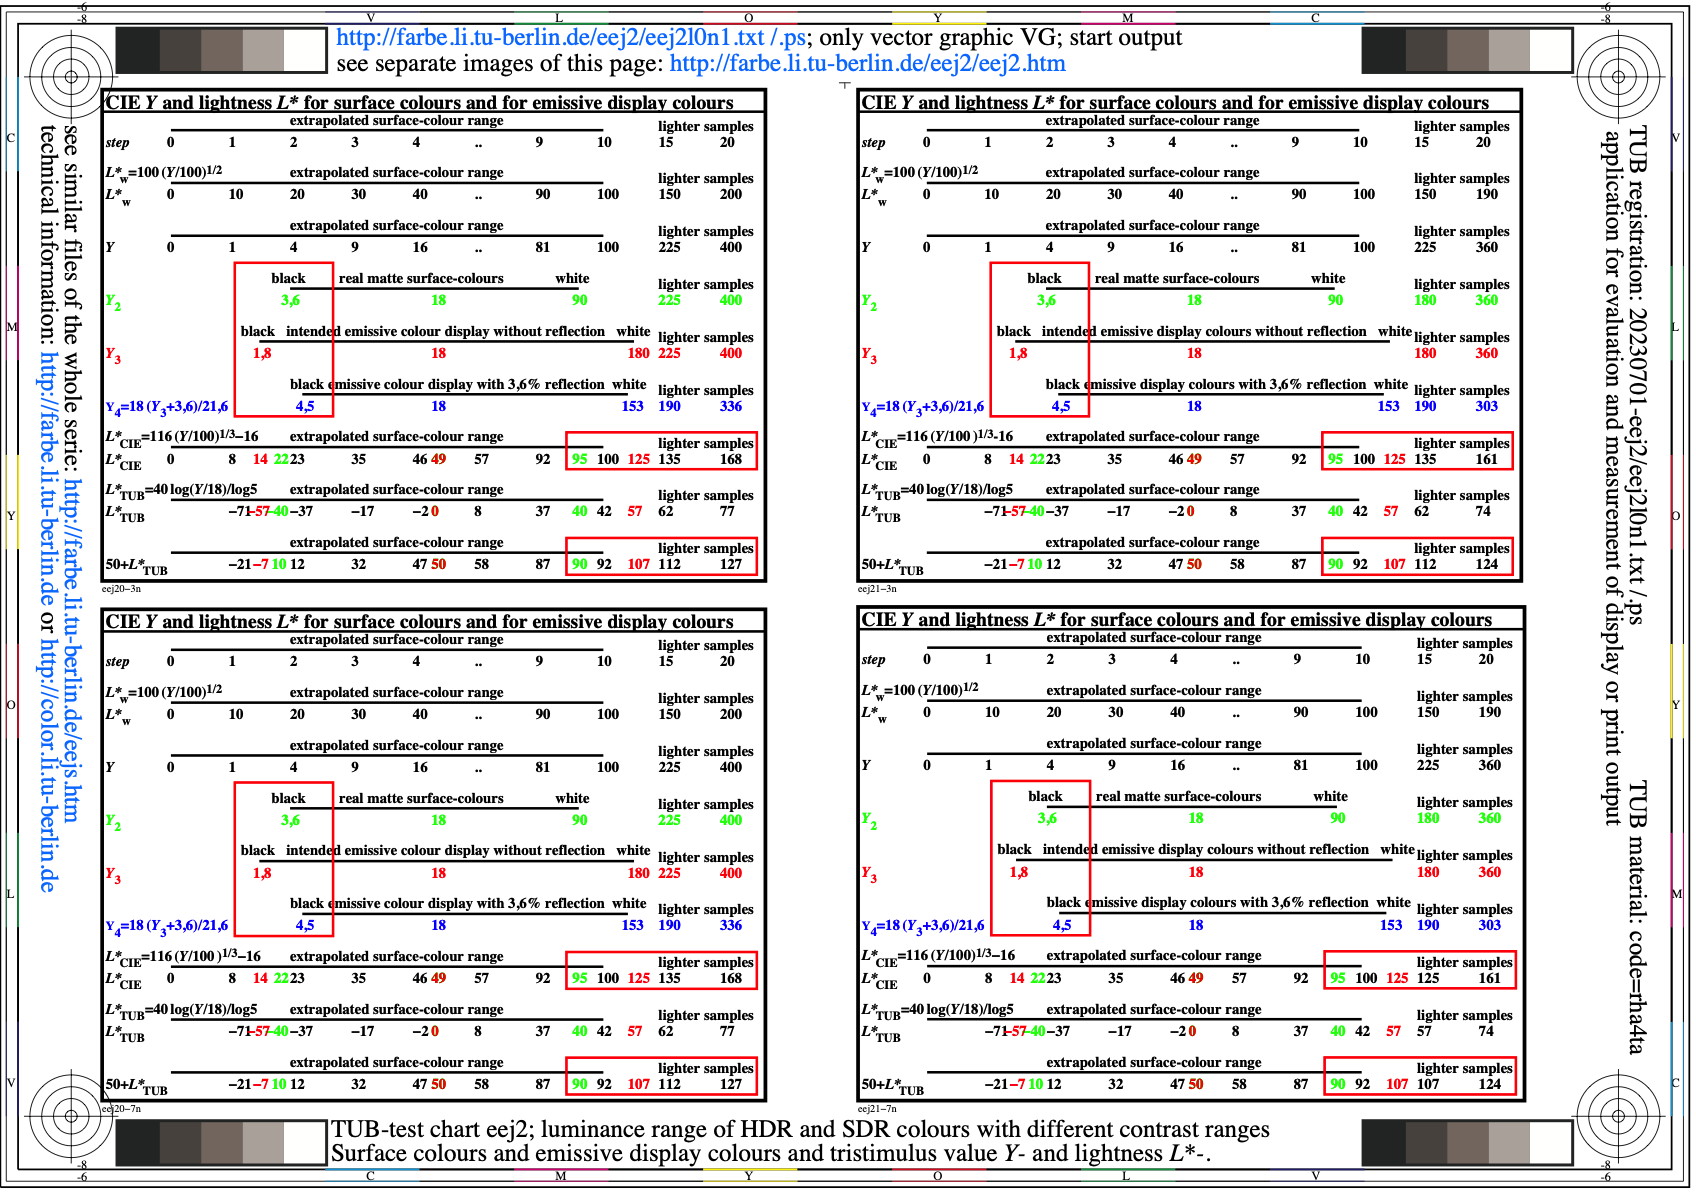
Figure eej2l0n1.jpg: Output in format A6 of the file
eej2l0np.pdf, see
eej2l0n1.
ps /
txt /
pdf /
jpg
eej2: TUB-test chart eej2; luminance range of HDR and SDR displays
TitleB2
für Körperfarben und emissive Displays
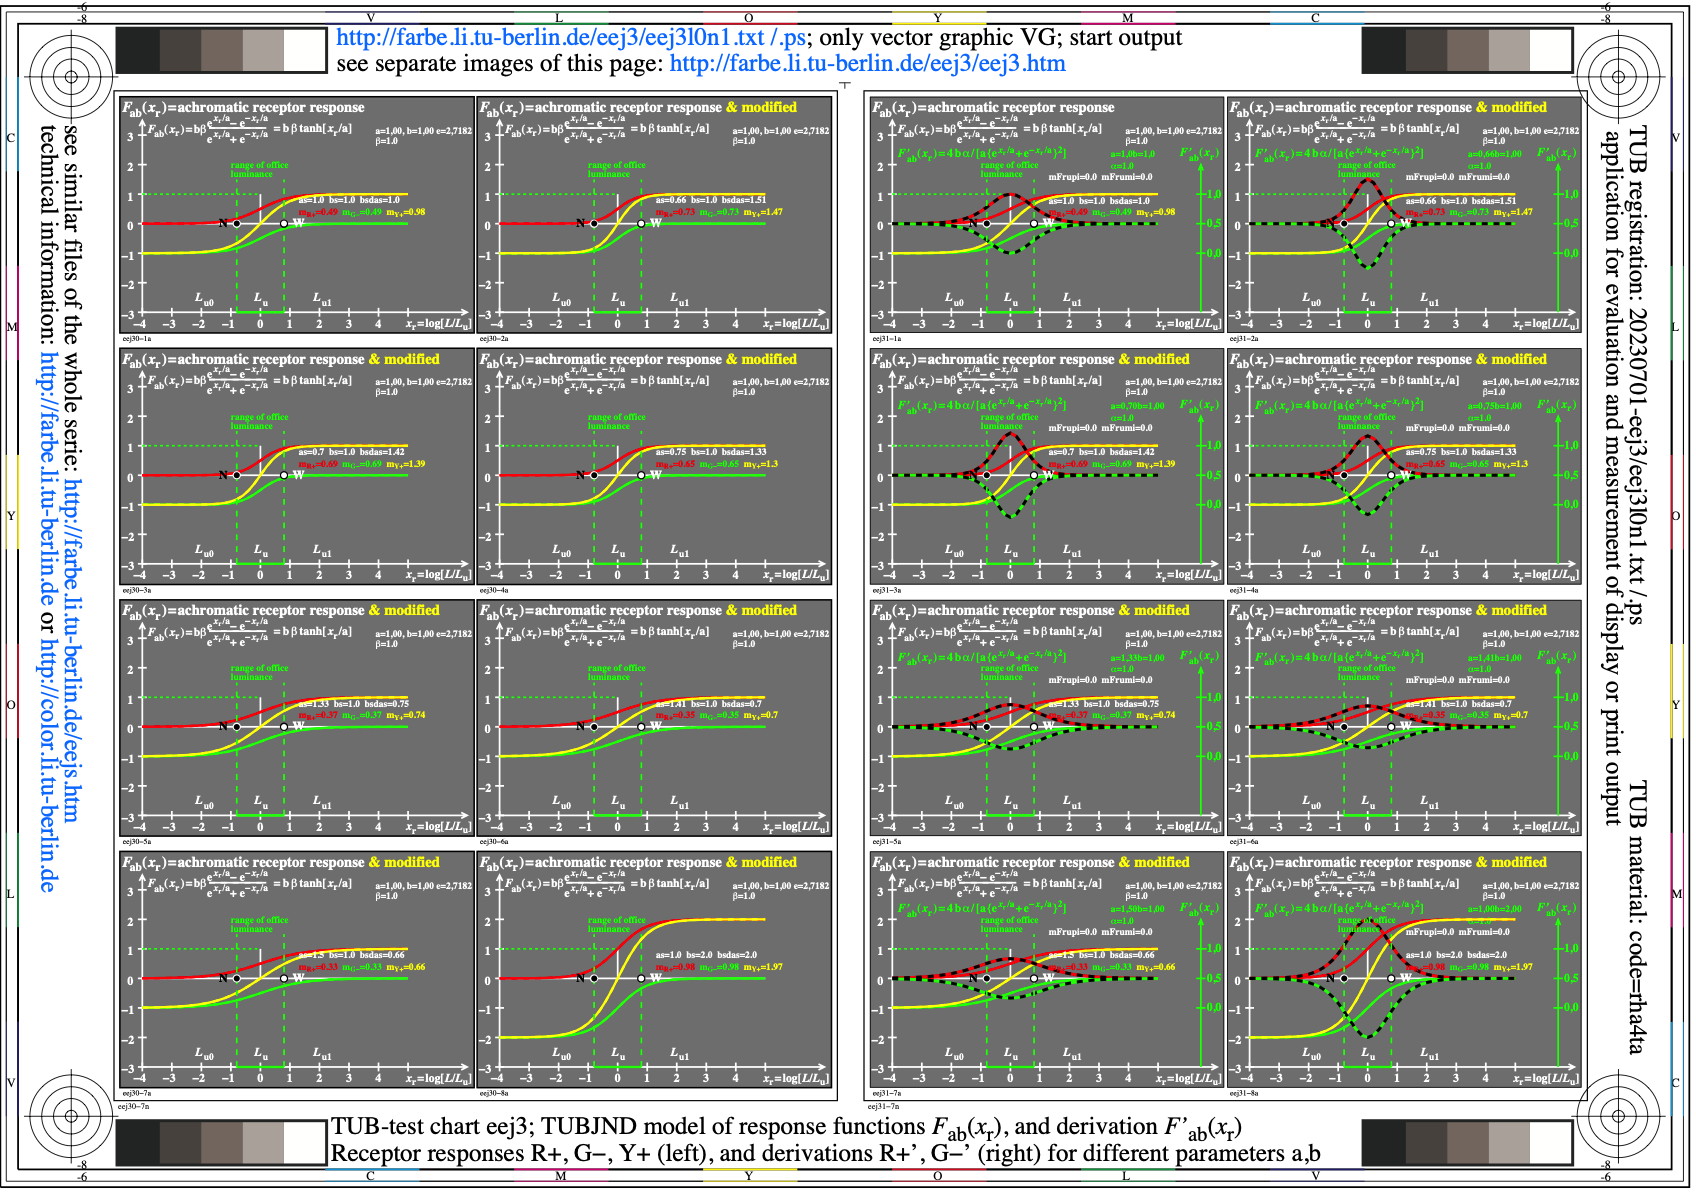
Figure eej3l0n1.jpg: Output in format A6 of the file
eej3l0np.pdf, see
eej3l0n1.
ps /
txt /
pdf /
jpg
eej3: TUB-test chart eej3; TUBJND model with functions Fab, F'ab
Receptor responses R+, G-, Y+ (left & right), and derivations
R+', G-' (right) for diferent parameters a,b
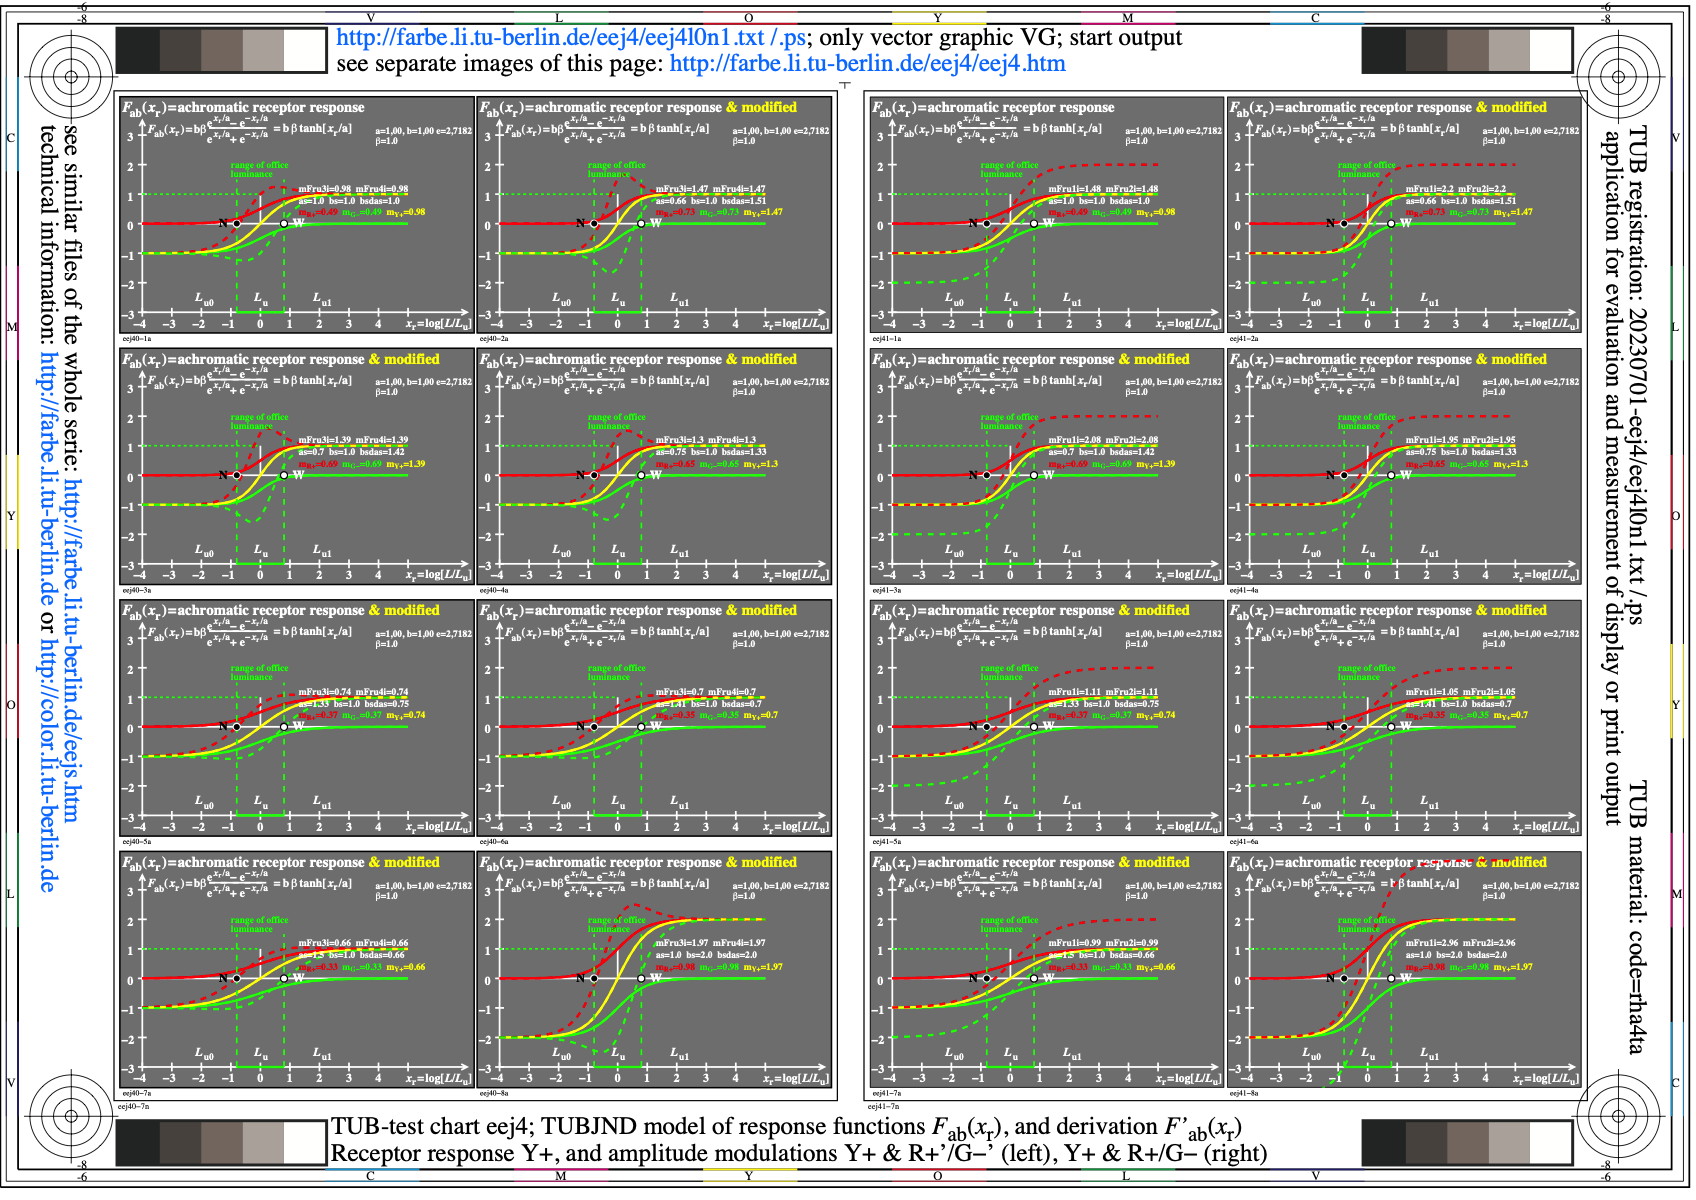
Figure eej4l0n1.jpg: Output in format A6 of the file
eej4l0np.pdf, see
eej4l0n1.
ps /
txt /
pdf /
jpg
eej4: TUB-test chart eej4; TUBJND model with functions Fab, F'ab
Receptor responses R+, G-, Y+ (left & right) and amplitude
modulations Y+ & R+'/G-' (left), Y+ & R+/G- (right) for a,b
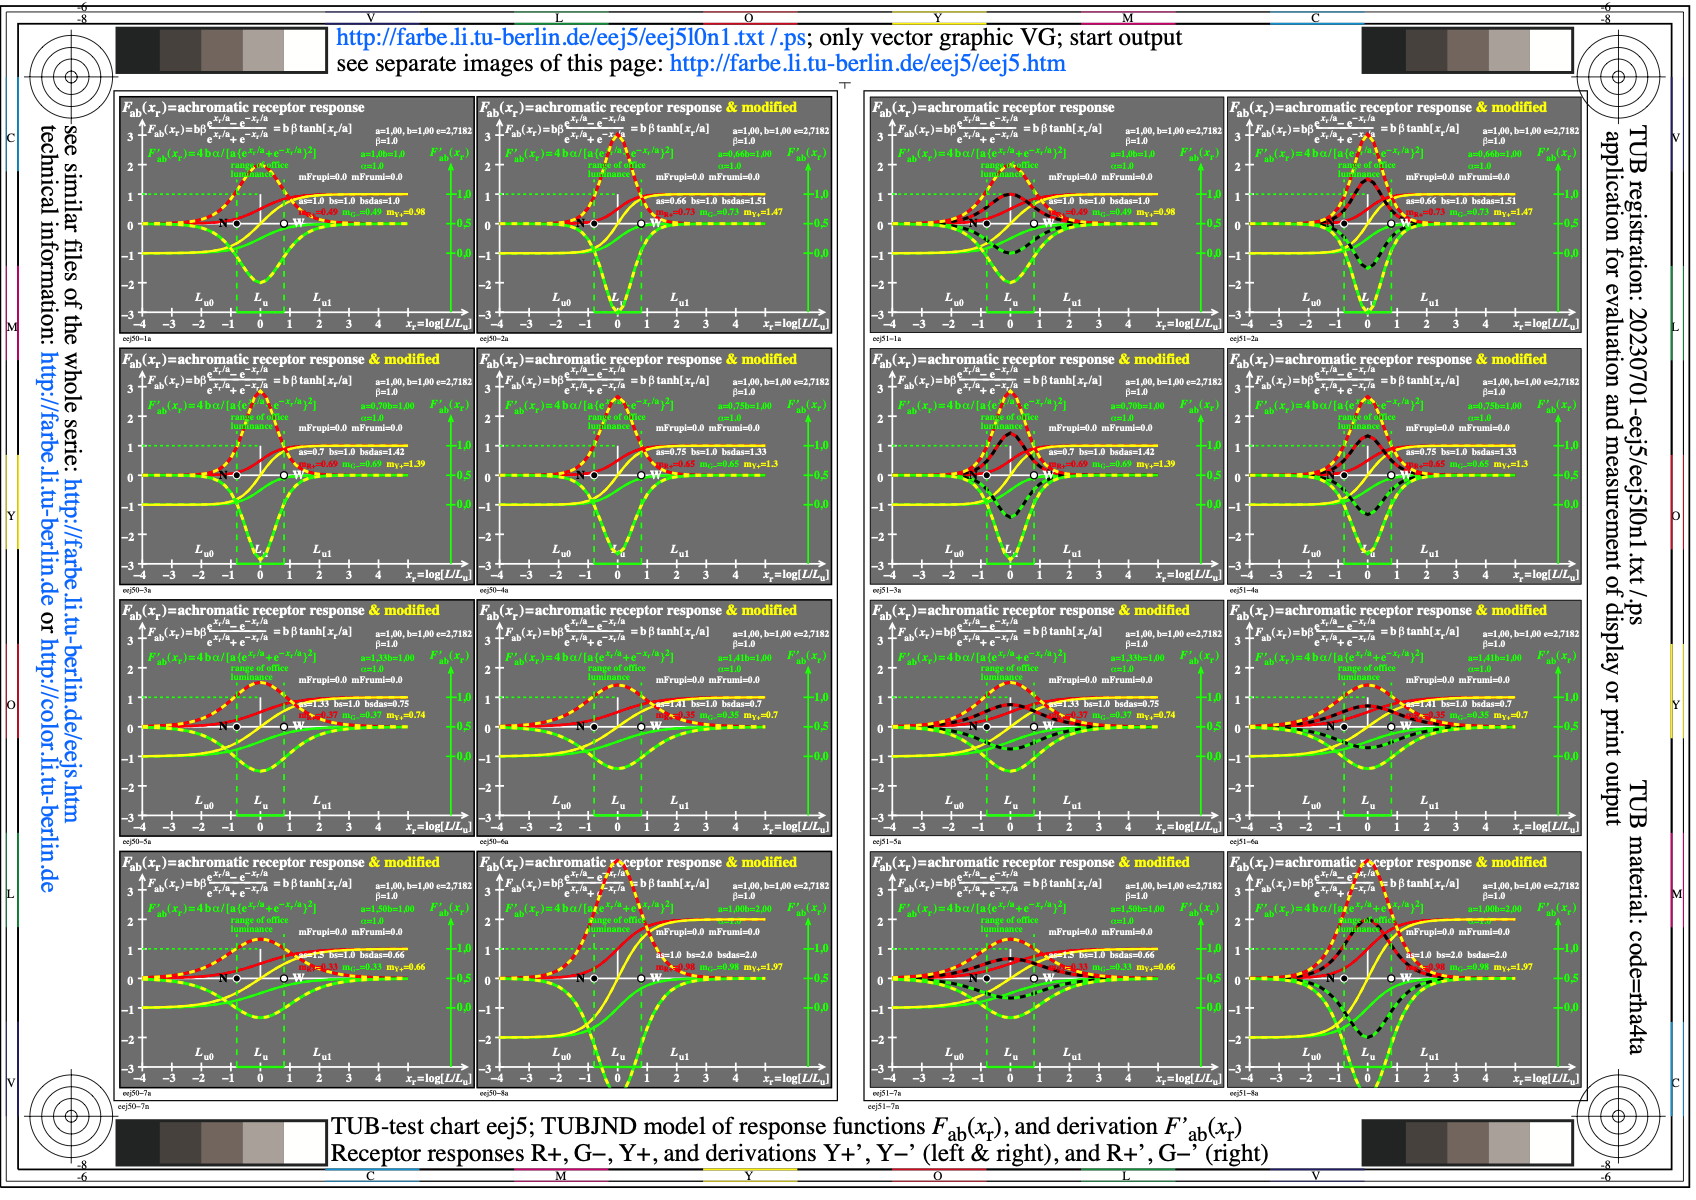
Figure eej5l0n1.jpg: Output in format A6 of the file
eej5l0np.pdf, see
eej5l0n1.
ps /
txt /
pdf /
jpg
eej5: TUB-test chart eej5; TUBJND model with functions Fab, F'ab
Receptor responses R+, G-, Y+ (left & right), and derivations
Y+', Y-' (left & right), and R+'/G-' (right) for a,b
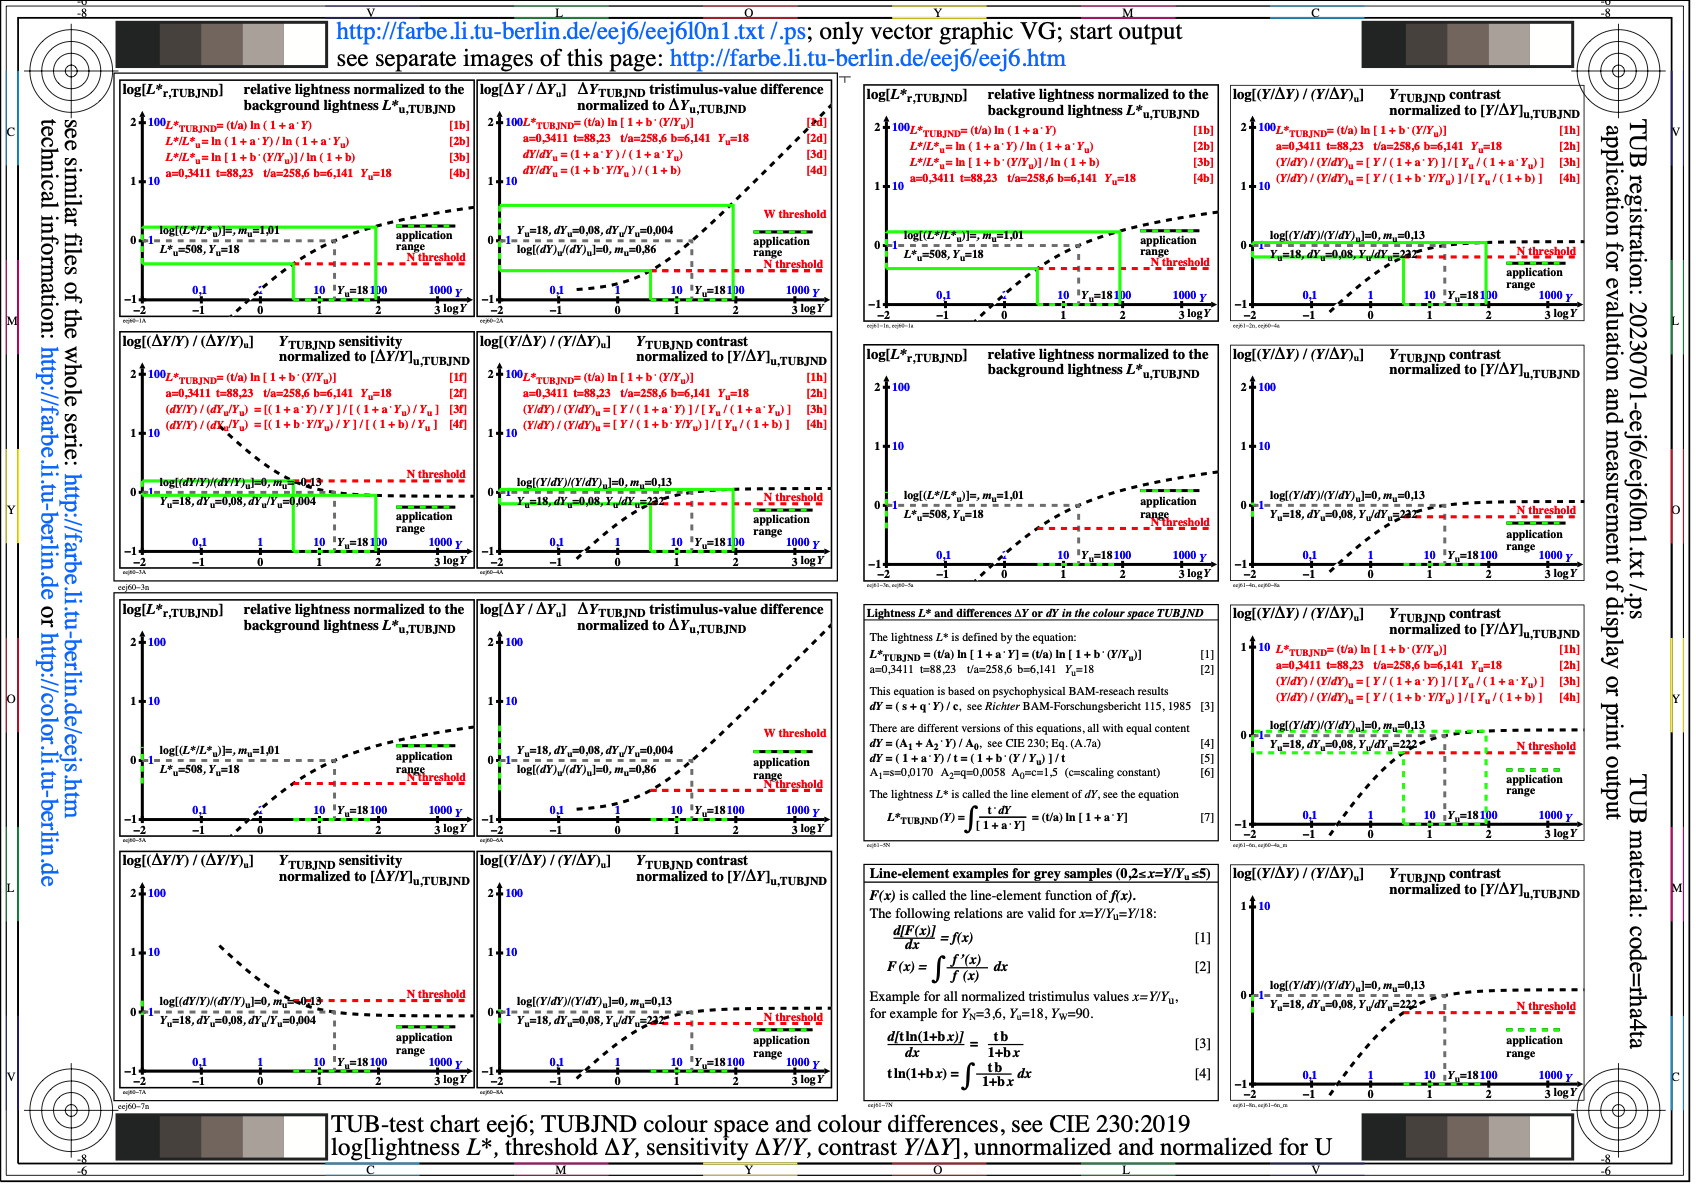
Figure eej6l0n1.jpg: Output in format A6 of the file
eej6l0np.pdf, see
eej6l0n1.
ps /
txt /
pdf /
jpg
eej6: TUB-test chart eej6; TUBJNDr-colour space & differences
log[lightness L*, threshold delta Y, sensitivity
(delta Y)/Y & contrast Y/(delta Y)]=f[log(Y)]
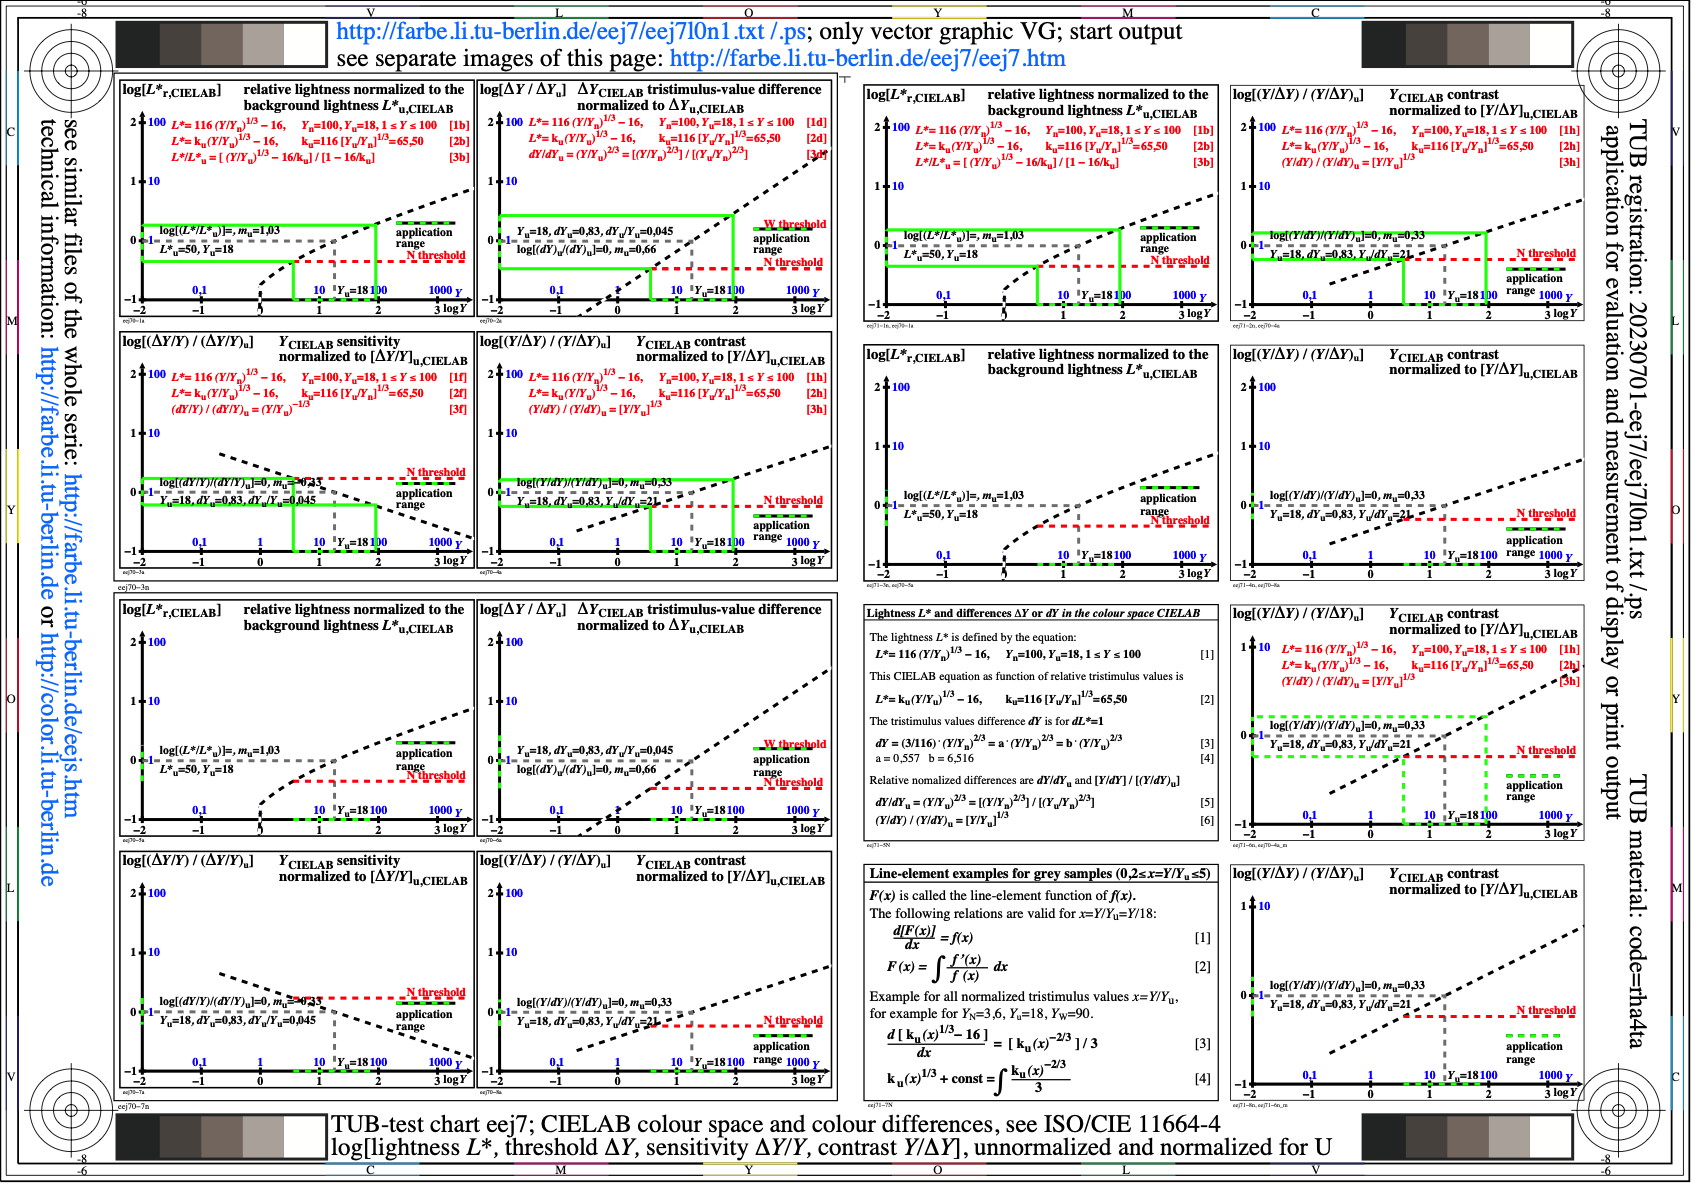
Figure eej7l0n1.jpg: Output in format A6 of the file
eej7l0np.pdf, see
eej7l0n1.
ps /
txt /
pdf /
jpg
eej7: TUB-test chart eej7; CIELABr-colour space & differences
log[lightness L*, threshold delta Y, sensitivity
(delta Y)/Y & contrast Y/(delta Y)]=f[log(Y)]

Figure eej8l0n1.jpg: Output in format A6 of the file
eej8l0np.pdf, see
eej8l0n1.
ps /
txt /
pdf /
jpg
eej8: TUB-test chart eej8; TUBJNDr-colour space & differences
lightness L*, threshold delta Y, sensitivity
(delta Y)/Y & contrast Y/(delta Y)=f[log(Y)]
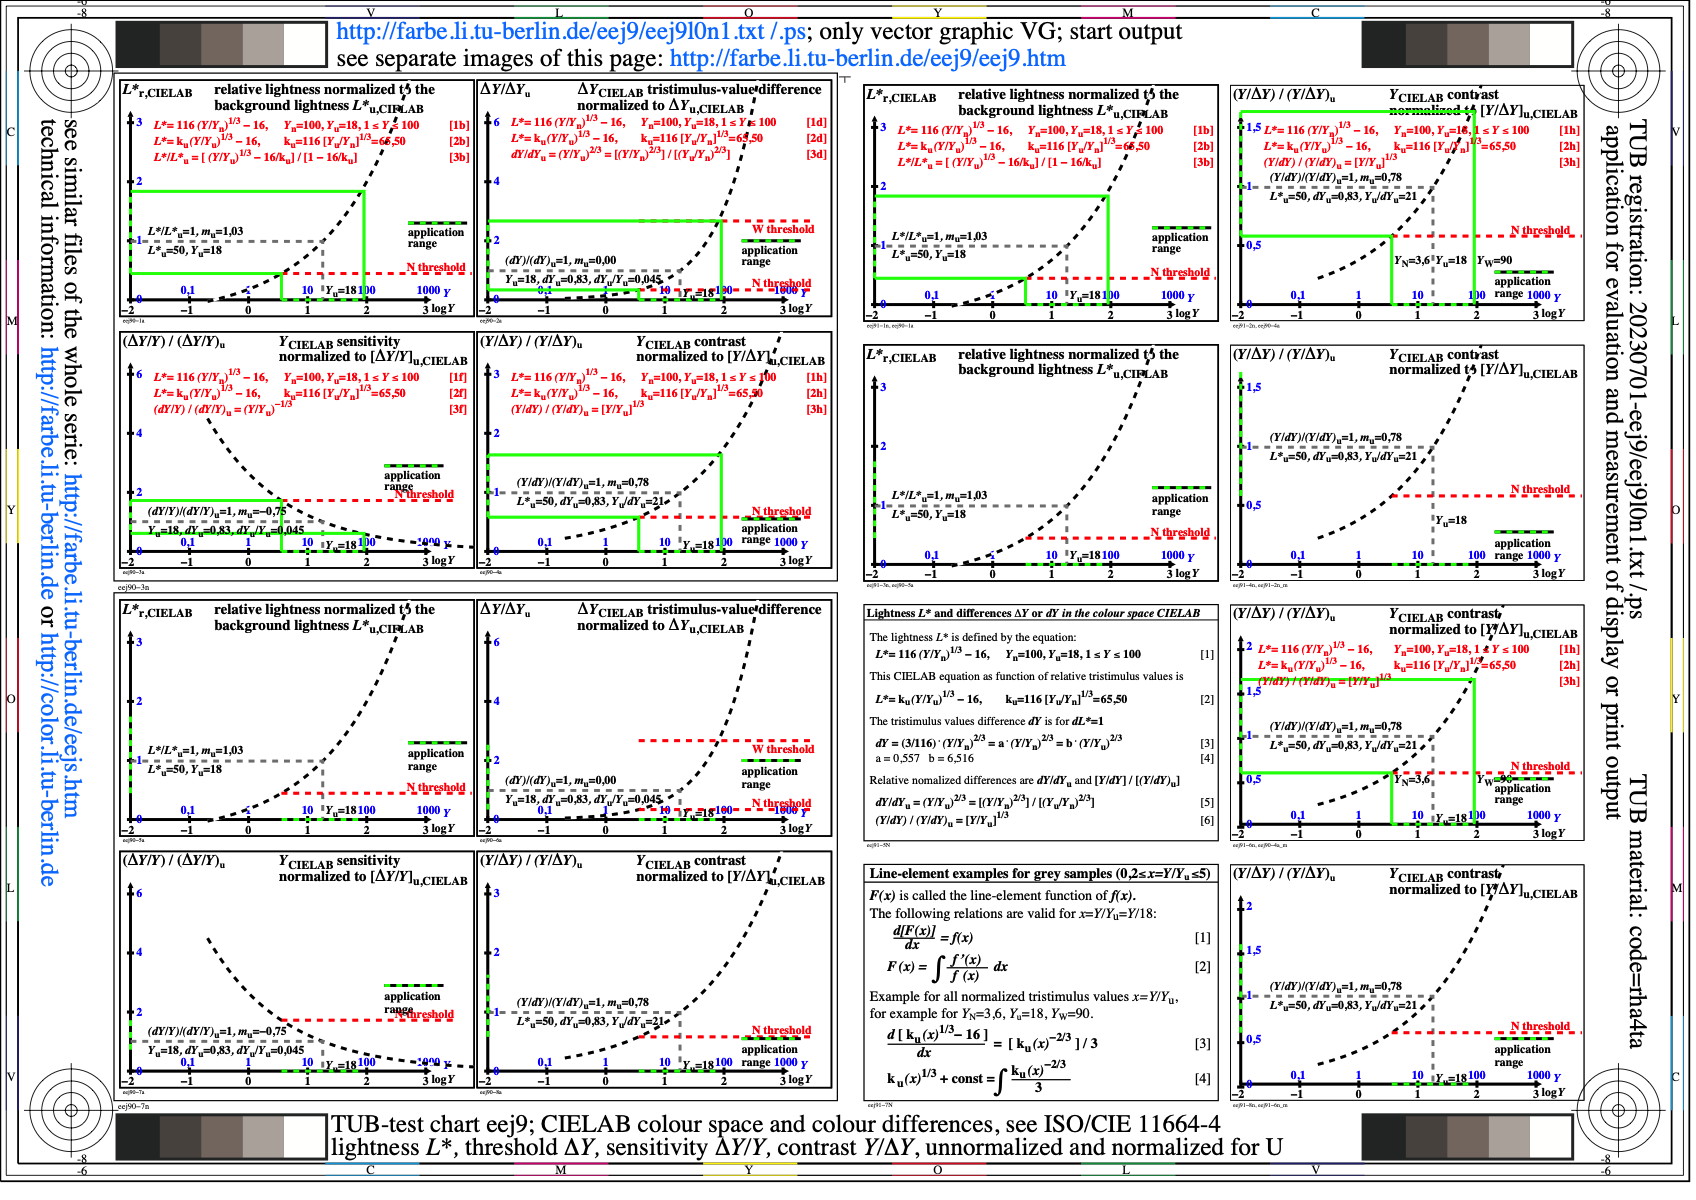
Figure eej9l0n1.jpg: Output in format A6 of the file
eej9l0np.pdf, see
eej9l0n1.
ps /
txt /
pdf /
jpg
eej9: TUB-test chart eej9; CIELABr-colour space & differences
lightness L*, threshold delta Y, sensitivity
(delta Y)/Y & contrast Y/(delta Y)=f[log(Y)]
-------
For the archive information (2000-2009) of the BAM server "www.ps.bam.de"
(2000-2018)
about colour test charts, colorimetric calculations,
standards, and publications, see
indexAE.html in English,
indexAG.html in German.
Back to the main page of this TUB web site (NOT archive), see
index.html in English,
indexDE.html in German.