Figure eei0l0n1.jpg: Output in format A6 of the file eei0l0np.pdf, see
eei0l0n1. ps / txt / pdf / jpg
240215 1L2L0X0F_K2710.KTS/YEilEIN.KTS, http://farbe.li.tu-berlin.de/eeis.htm or http://color.li.tu-berlin.de/eeis.htm
For links to the
Section 2, Chapter E
Colour Metrics, Differences, and Appearance (2023),
see
For this image page with 10 colour series, see
eeis in English,
egis in German.
For the previous image page, see
eehs in English,
eghs in German.
For the next image page, see
eejs in English,
egjs in German.
For the first image page of the previous chapter D, see
DEAS in English,
DGAS in German.
For the first image page of the next chapter F (under work), see
feas in English,
fgas in German.
Content list of chapter E:
eea_i in English or
ega_i in German.
Summary of chapter E:
eea_s in English or
ega_s in German.
For the large image page of chapter E with 260 colour series, see
ee2s in English or
eg2s in German.
Section 2, Chapter E
Colour Metrics, Differences, and Appearance (2023),
Image part eeis
The following ten pages eei0 to eei9 of this chapter
show the content with links to the single figures
in up to six formats.
Figure eei0l0n1.jpg: Output in format A6 of the file
eei0l0np.pdf, see
eei0l0n1.
ps /
txt /
pdf /
jpg
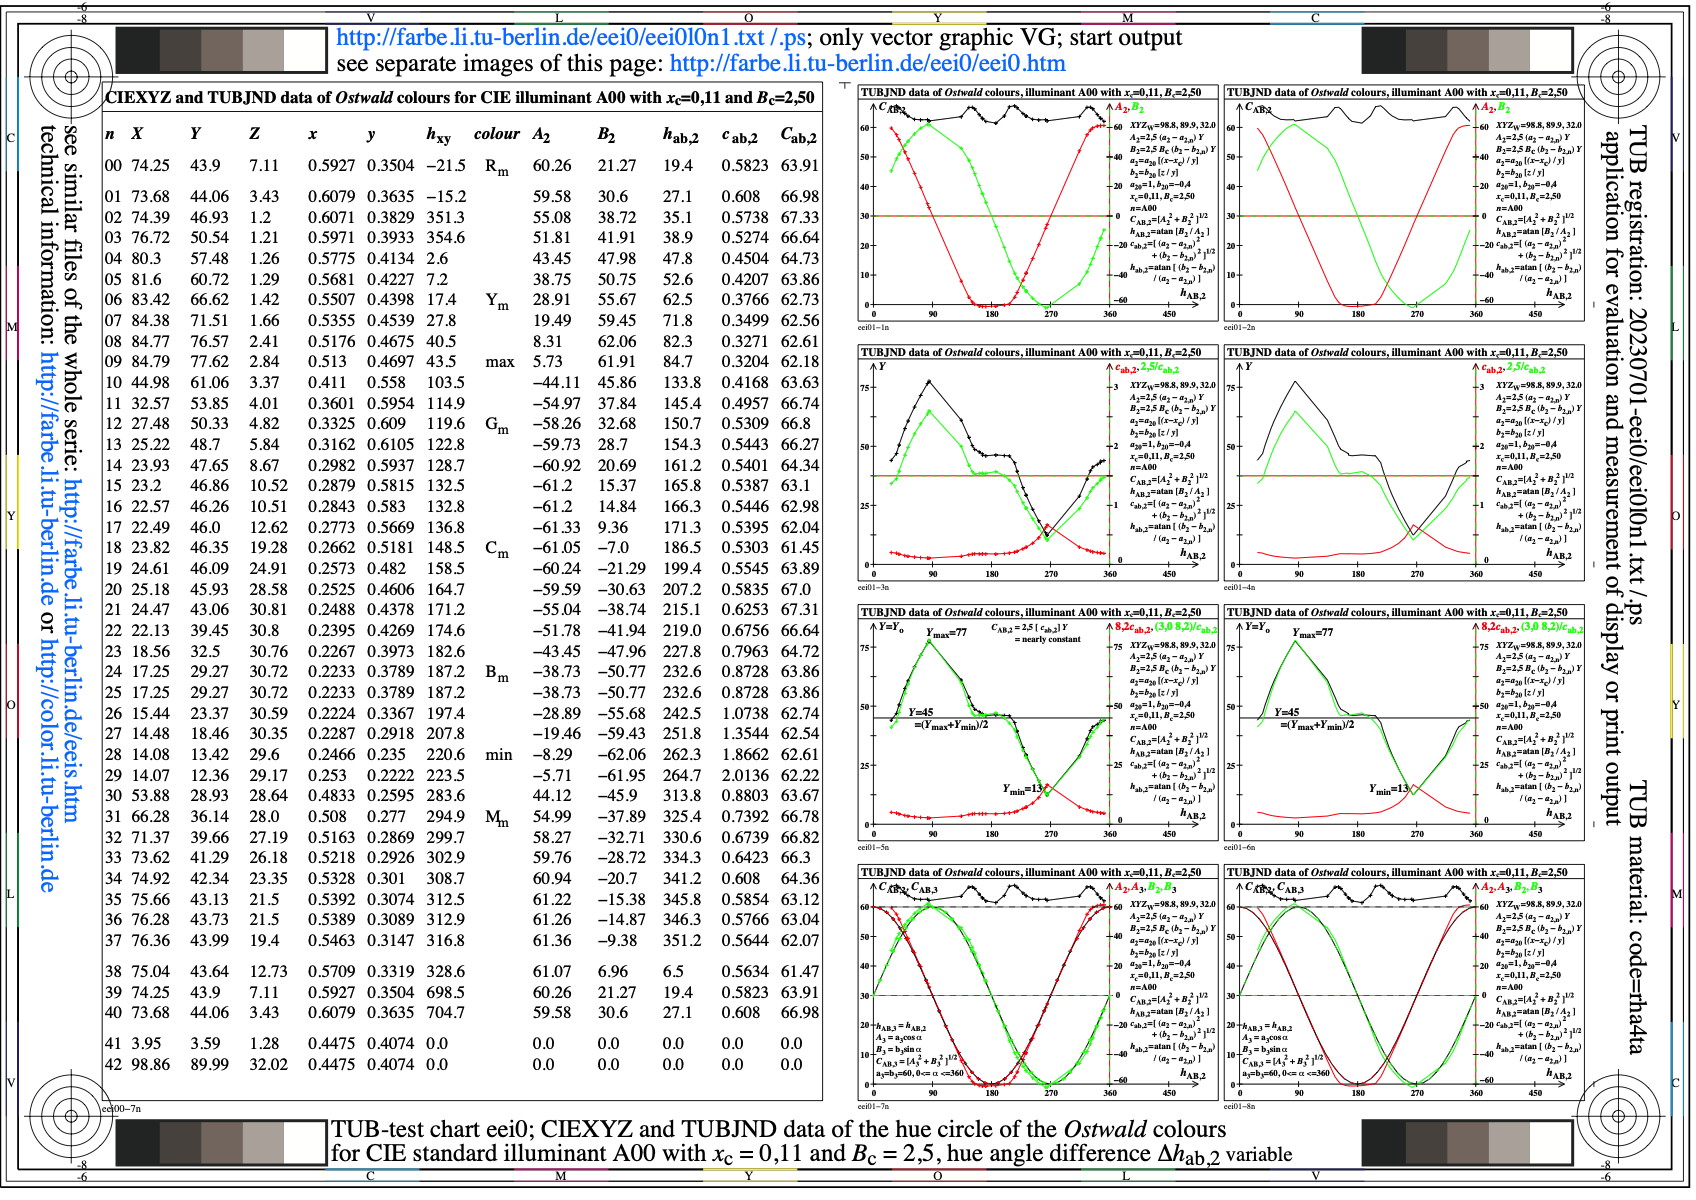
eei0: TUB-test chart eei0; Ostwald optimal colours for A00
Calculation of tristimulus values Yu for equal greyness
as function of CIE chromaticity (x,y), alpha variable
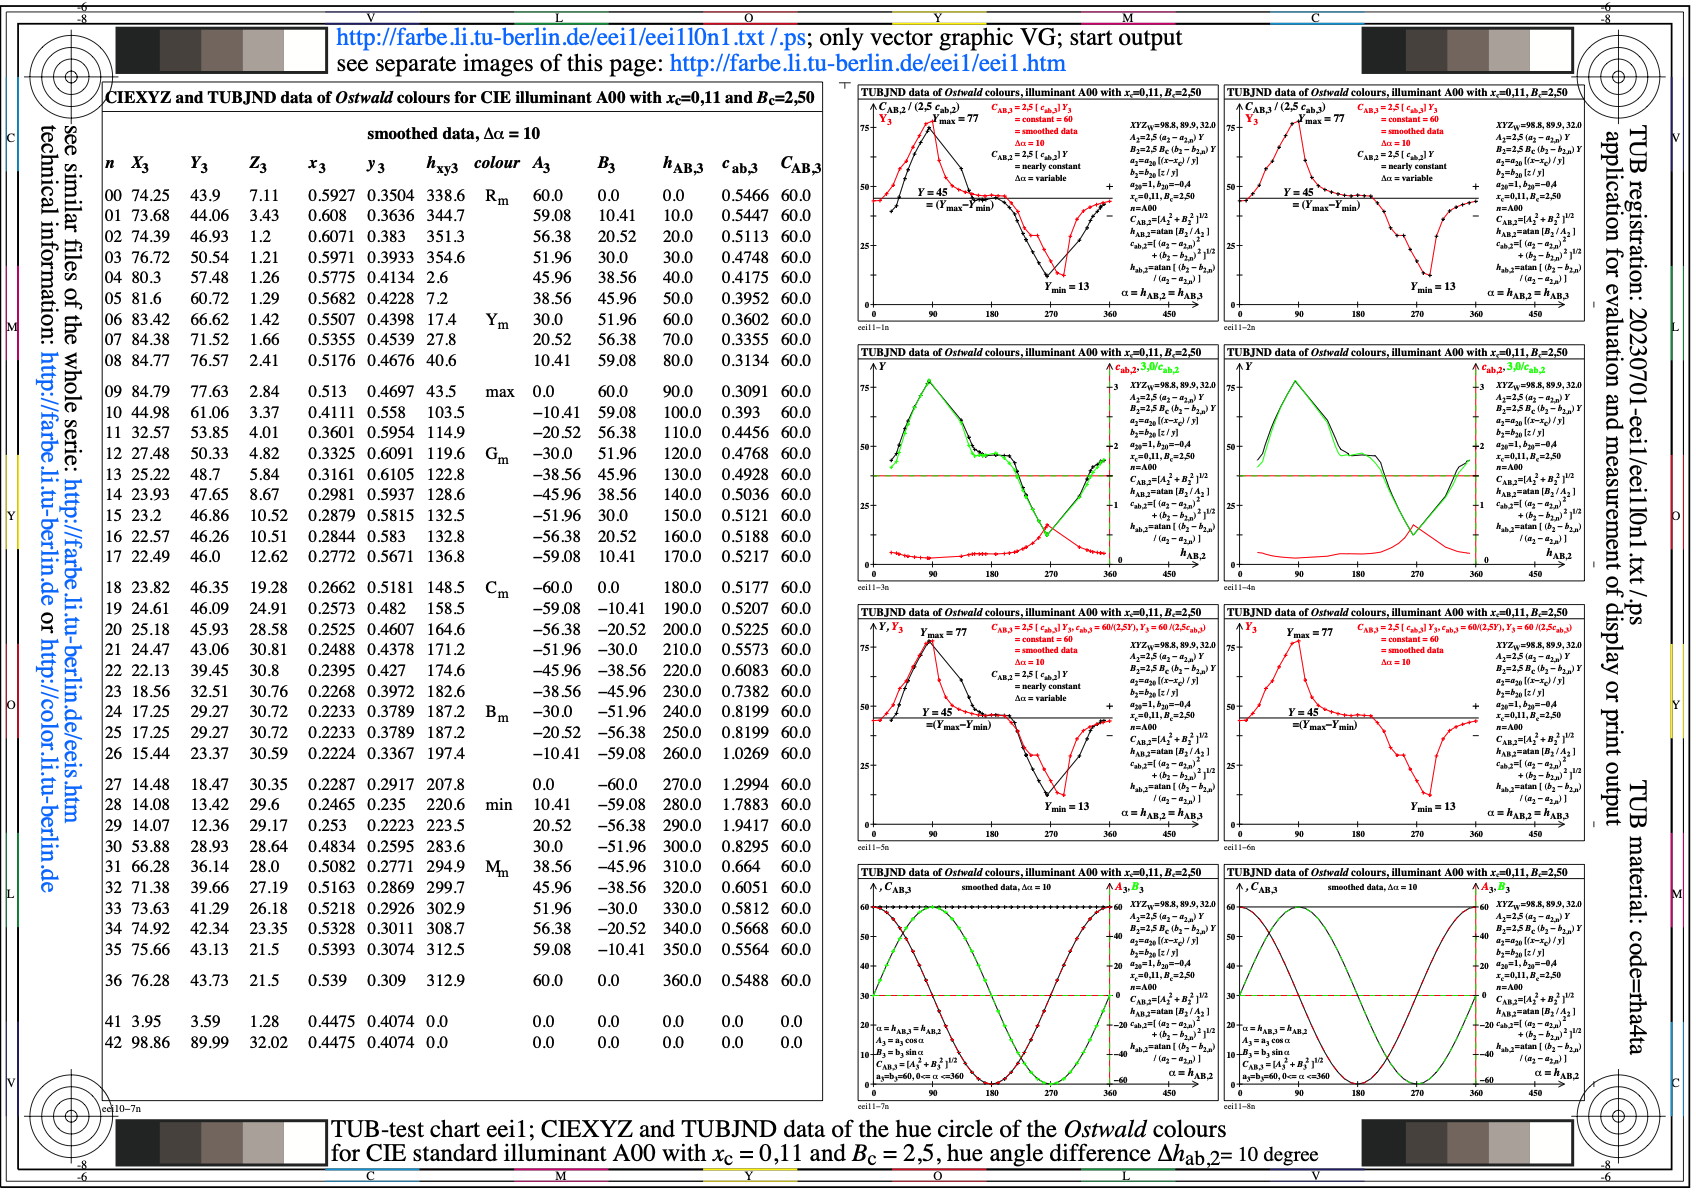
Figure eei1l0n1.jpg: Output in format A6 of the file
eei1l0np.pdf, see
eei1l0n1.
ps /
txt /
pdf /
jpg
eei1: TUB-test chart eei1; Ostwald optimal colours for A00
Calculation of tristimulus values Yu for equal greyness
as function of CIE chromaticity (x,y), alpha=10
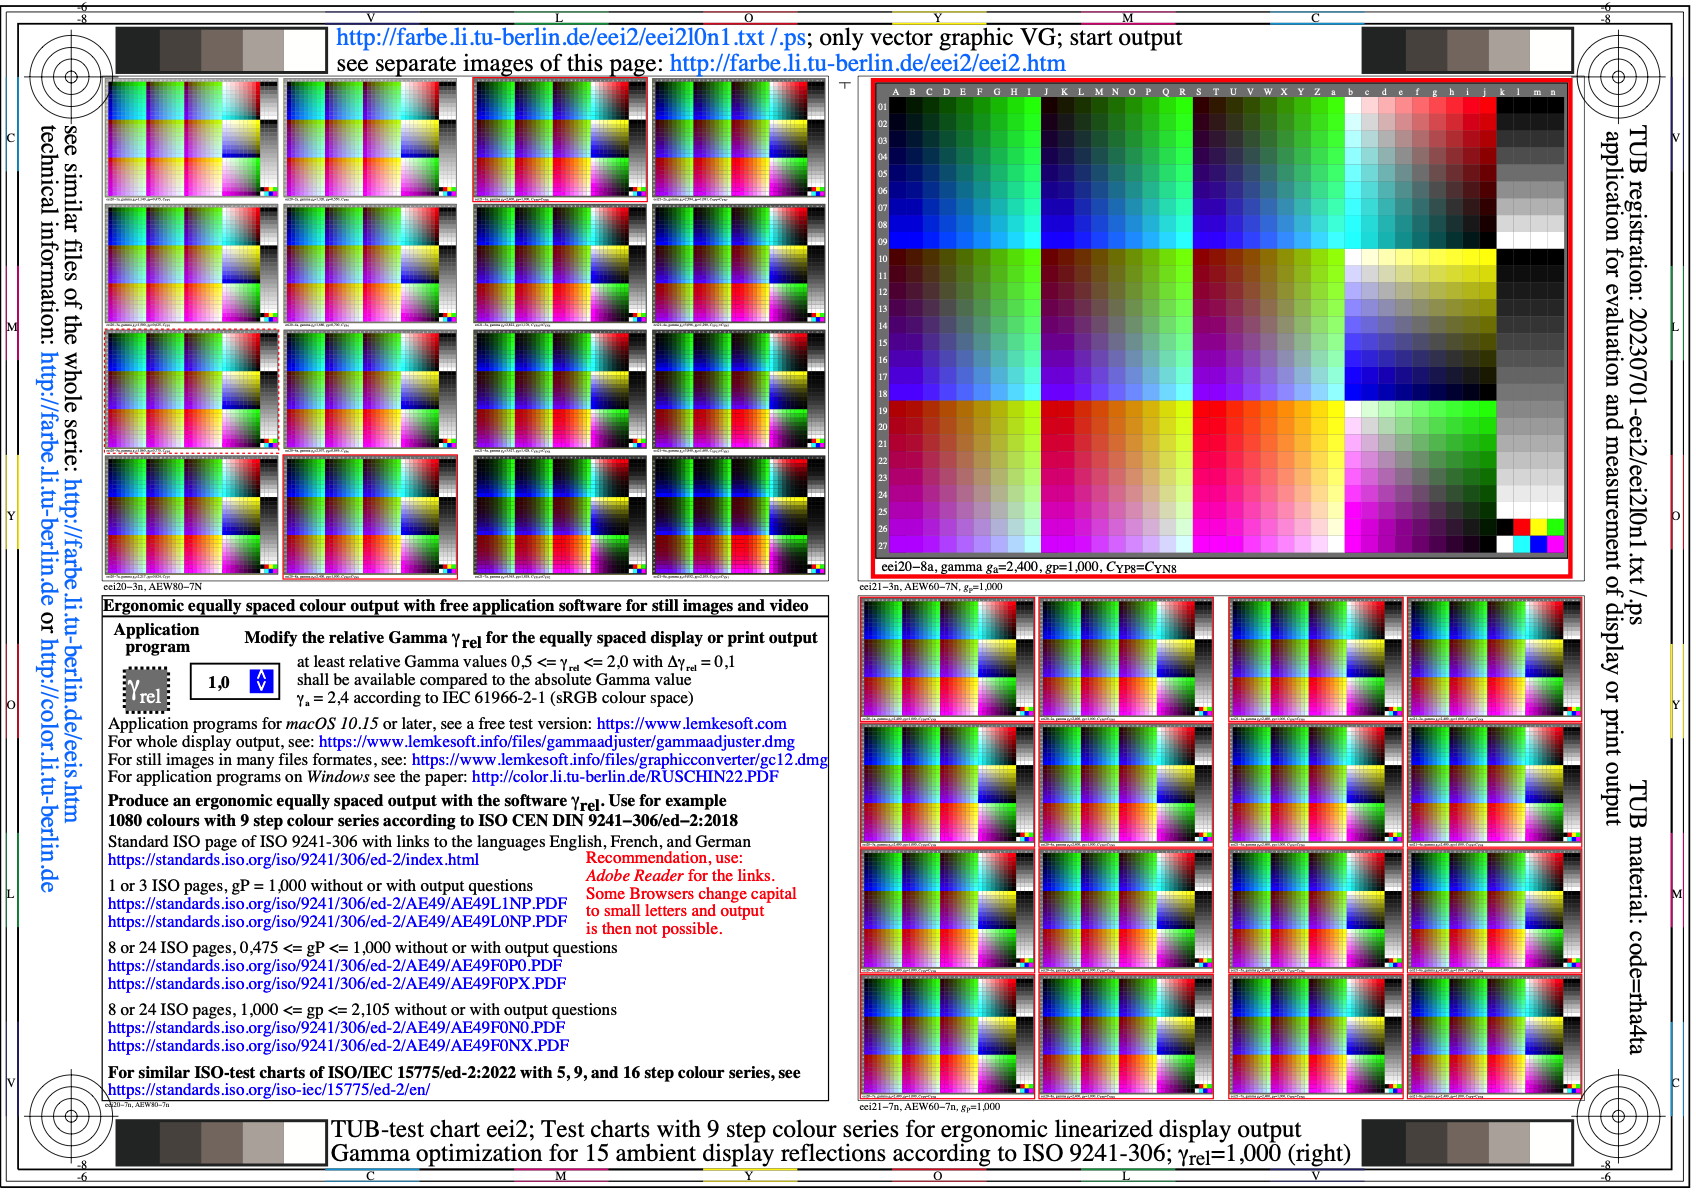
Figure eei2l0n1.jpg: Output in format A6 of the file
eei2l0np.pdf, see
eei2l0n1.
ps /
txt /
pdf /
jpg
eei2: TUB-test chart eei2; 9 step colour series for gamma
optimization for 15 display reflections & contrasts according to
ISO 9241\55306:2018 and ISO/IEC 15775:2022; gamma_rel=1,000
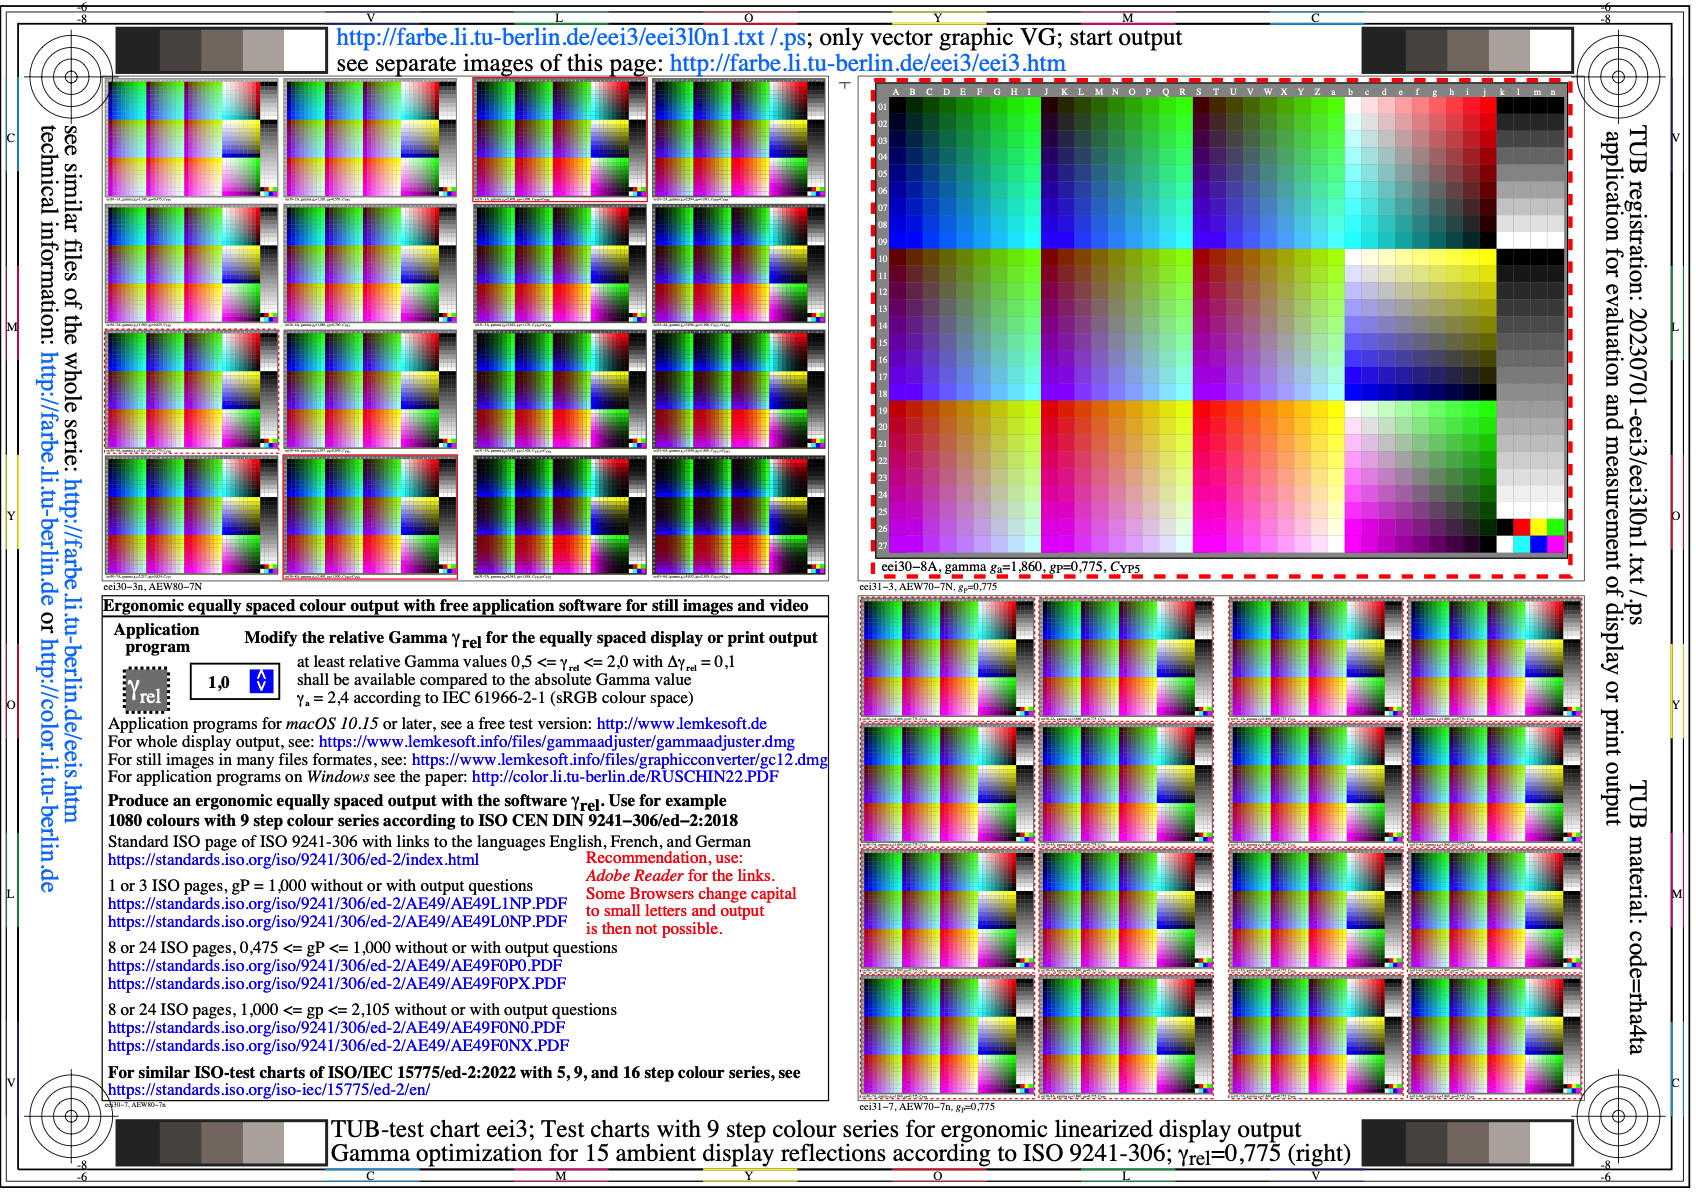
Figure eei3l0n1.jpg: Output in format A6 of the file
eei3l0np.pdf, see
eei3l0n1.
ps /
txt /
pdf /
jpg
eei3: TUB-test chart eei3; 9 step colour series for gamma
optimization for 15 display reflections & contrasts according to
ISO 9241\55306:2018 and ISO/IEC 15775:2022; gamma_rel=0,775
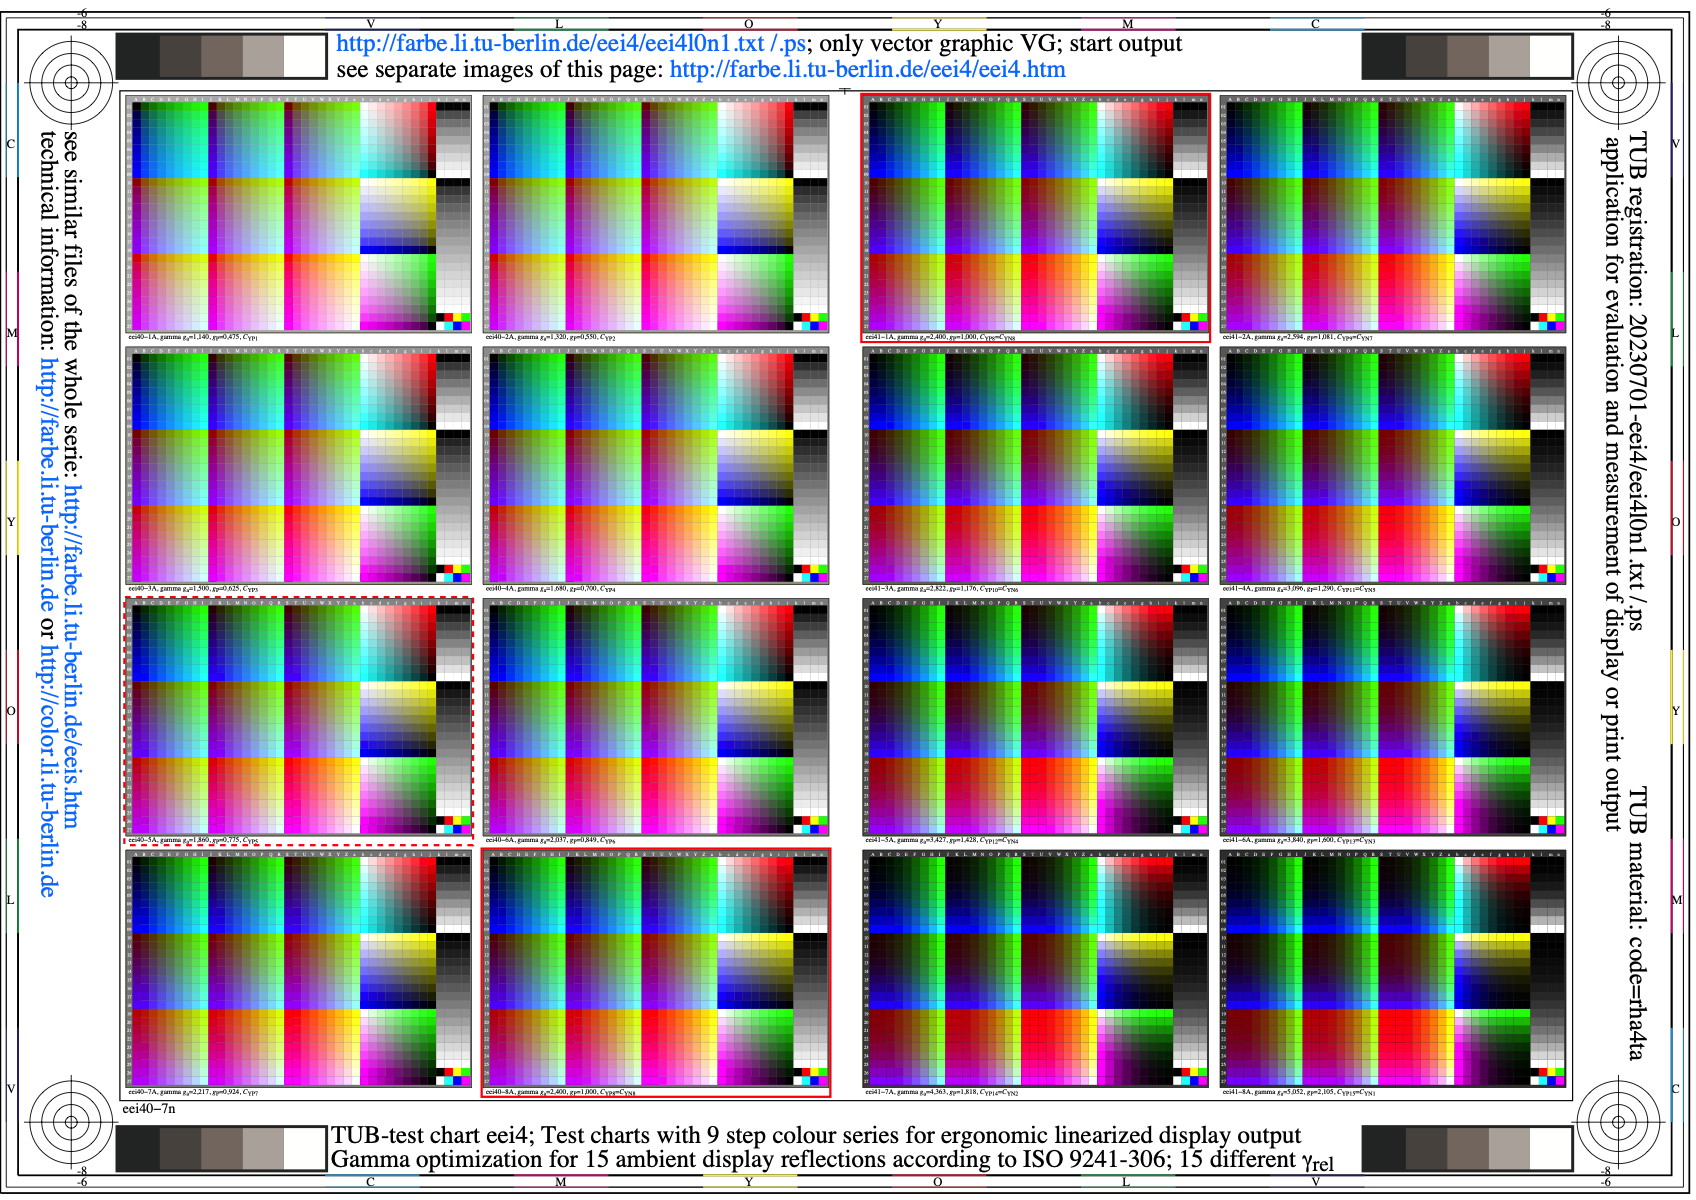
Figure eei4l0n1.jpg: Output in format A6 of the file
eei4l0np.pdf, see
eei4l0n1.
ps /
txt /
pdf /
jpg
eei4: TUB-test chart eei4; 9 step colour series for gamma
optimization for 15 display reflections & contrasts according to
ISO 9241\55306:2018 and ISO/IEC 15775:2022; 15 gamma_rel
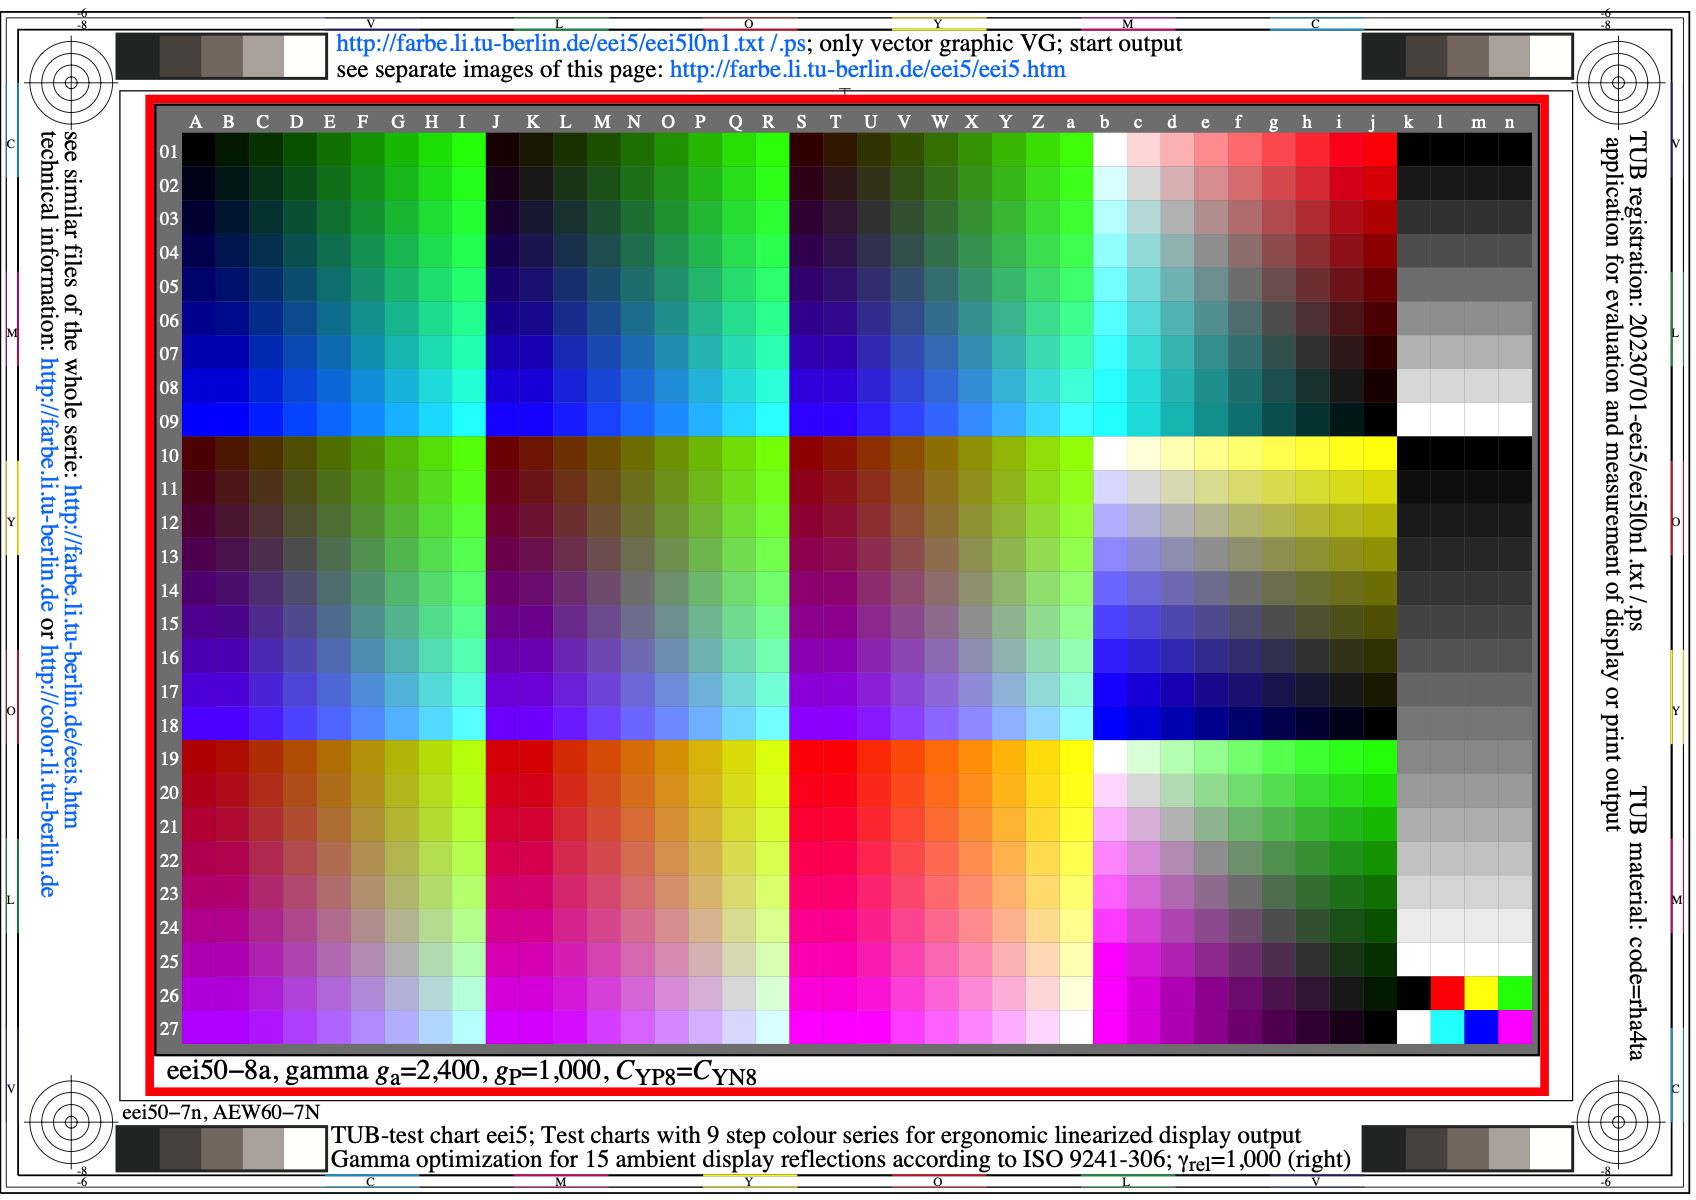
Figure eei5l0n1.jpg: Output in format A6 of the file
eei5l0np.pdf, see
eei5l0n1.
ps /
txt /
pdf /
jpg
eei5: TUB-test chart eei5; 9 step colour series for gamma
optimization for 15 display reflections & contrasts according to
ISO 9241\55306:2018 and ISO/IEC 15775:2022; gamma_rel=1,000
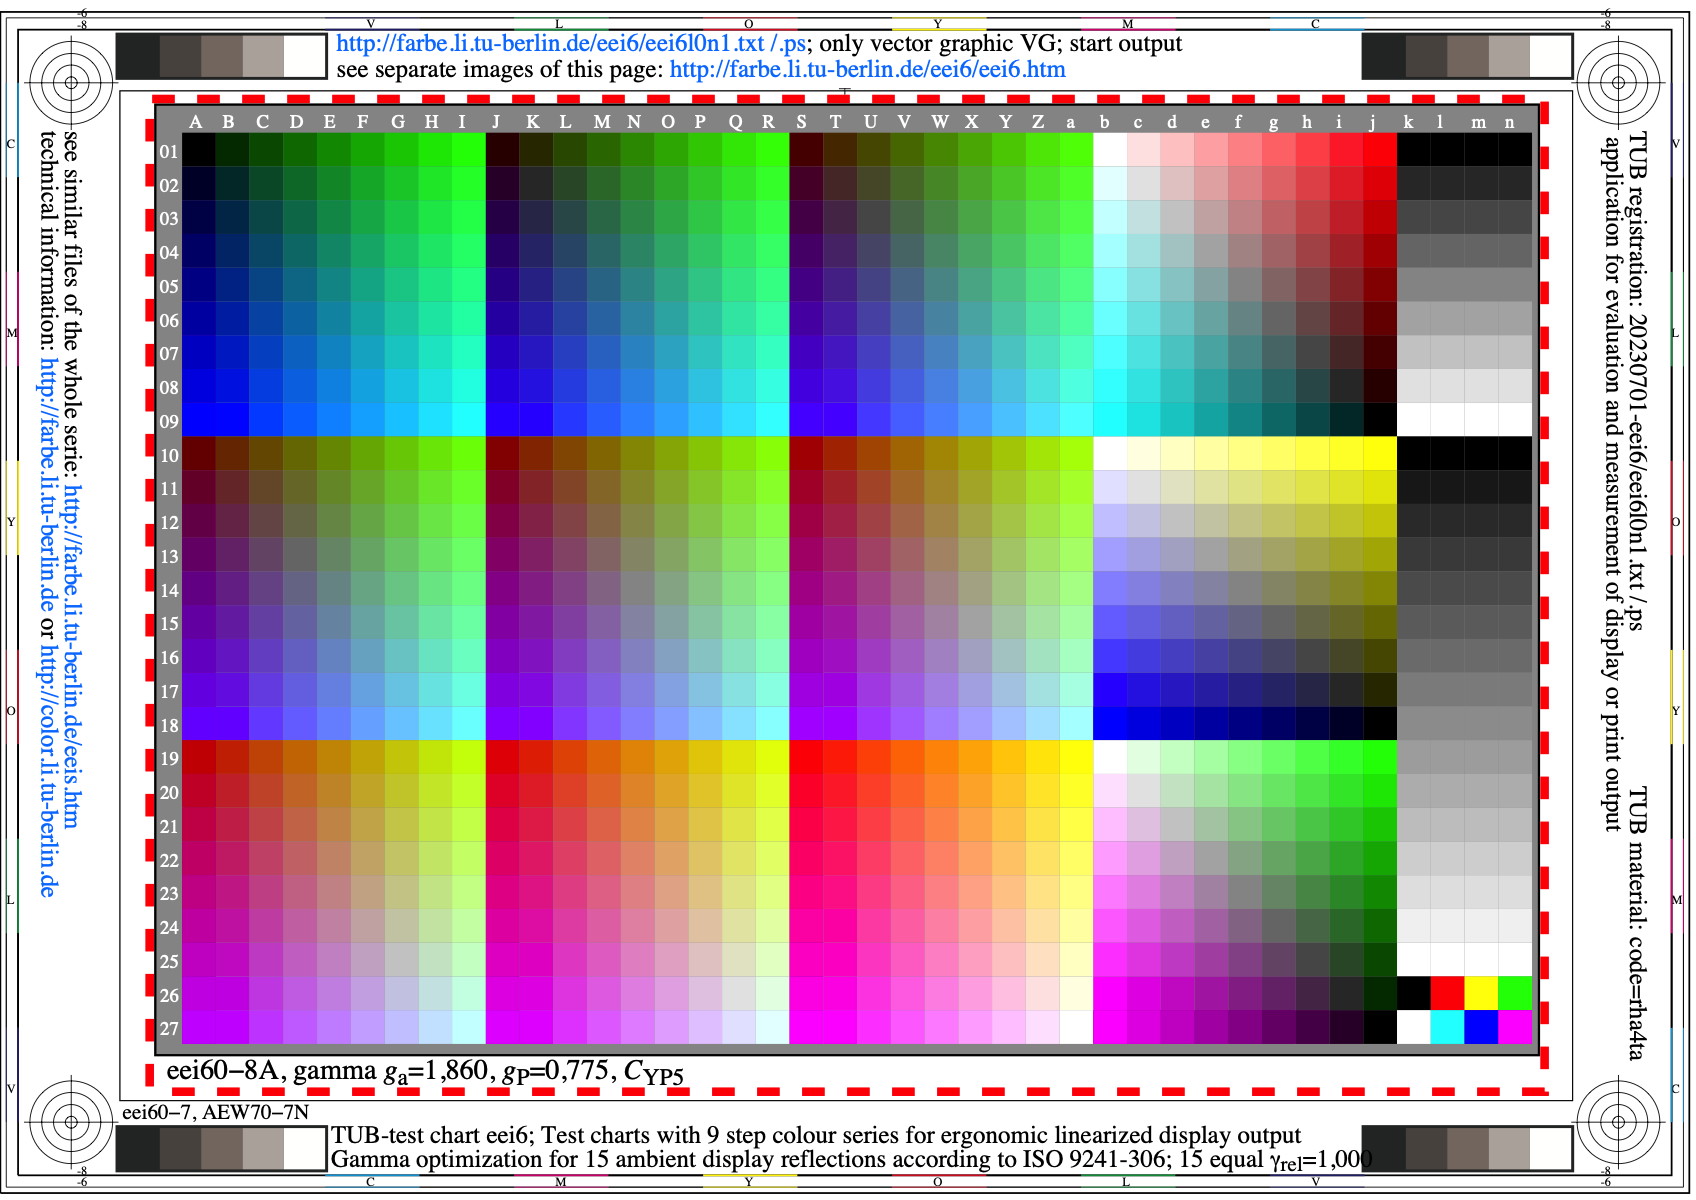
Figure eei6l0n1.jpg: Output in format A6 of the file
eei6l0np.pdf, see
eei6l0n1.
ps /
txt /
pdf /
jpg
eei6: TUB-test chart eei6; 9 step colour series for gamma
optimization for 15 display reflections & contrasts according to
ISO 9241\55306:2018 and ISO/IEC 15775:2022; gamma_rel=0,775
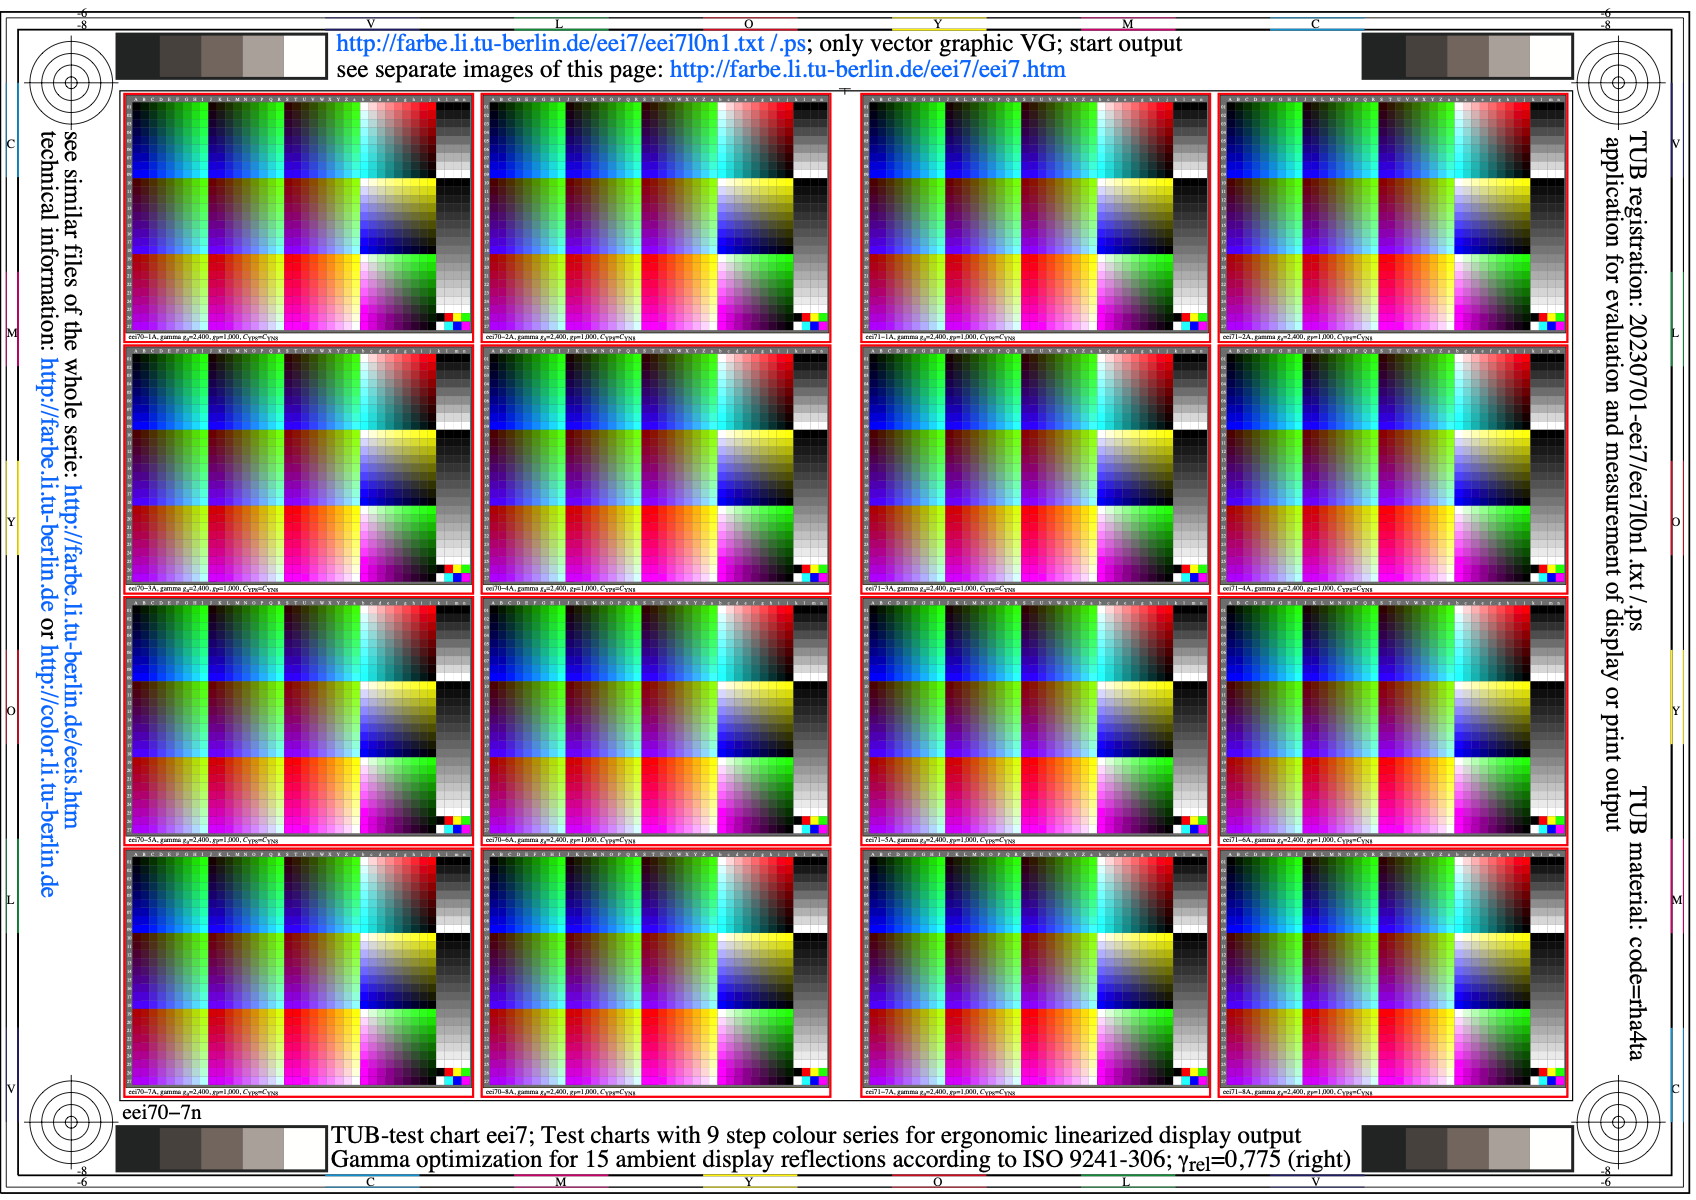
Figure eei7l0n1.jpg: Output in format A6 of the file
eei7l0np.pdf, see
eei7l0n1.
ps /
txt /
pdf /
jpg
eei7: TUB-test chart eei7; 9 step colour series for gamma
optimization for 15 display reflections & contrasts according to
ISO 9241\55306 and ISO/IEC 15775; 15 equal gamma_rel=1,000
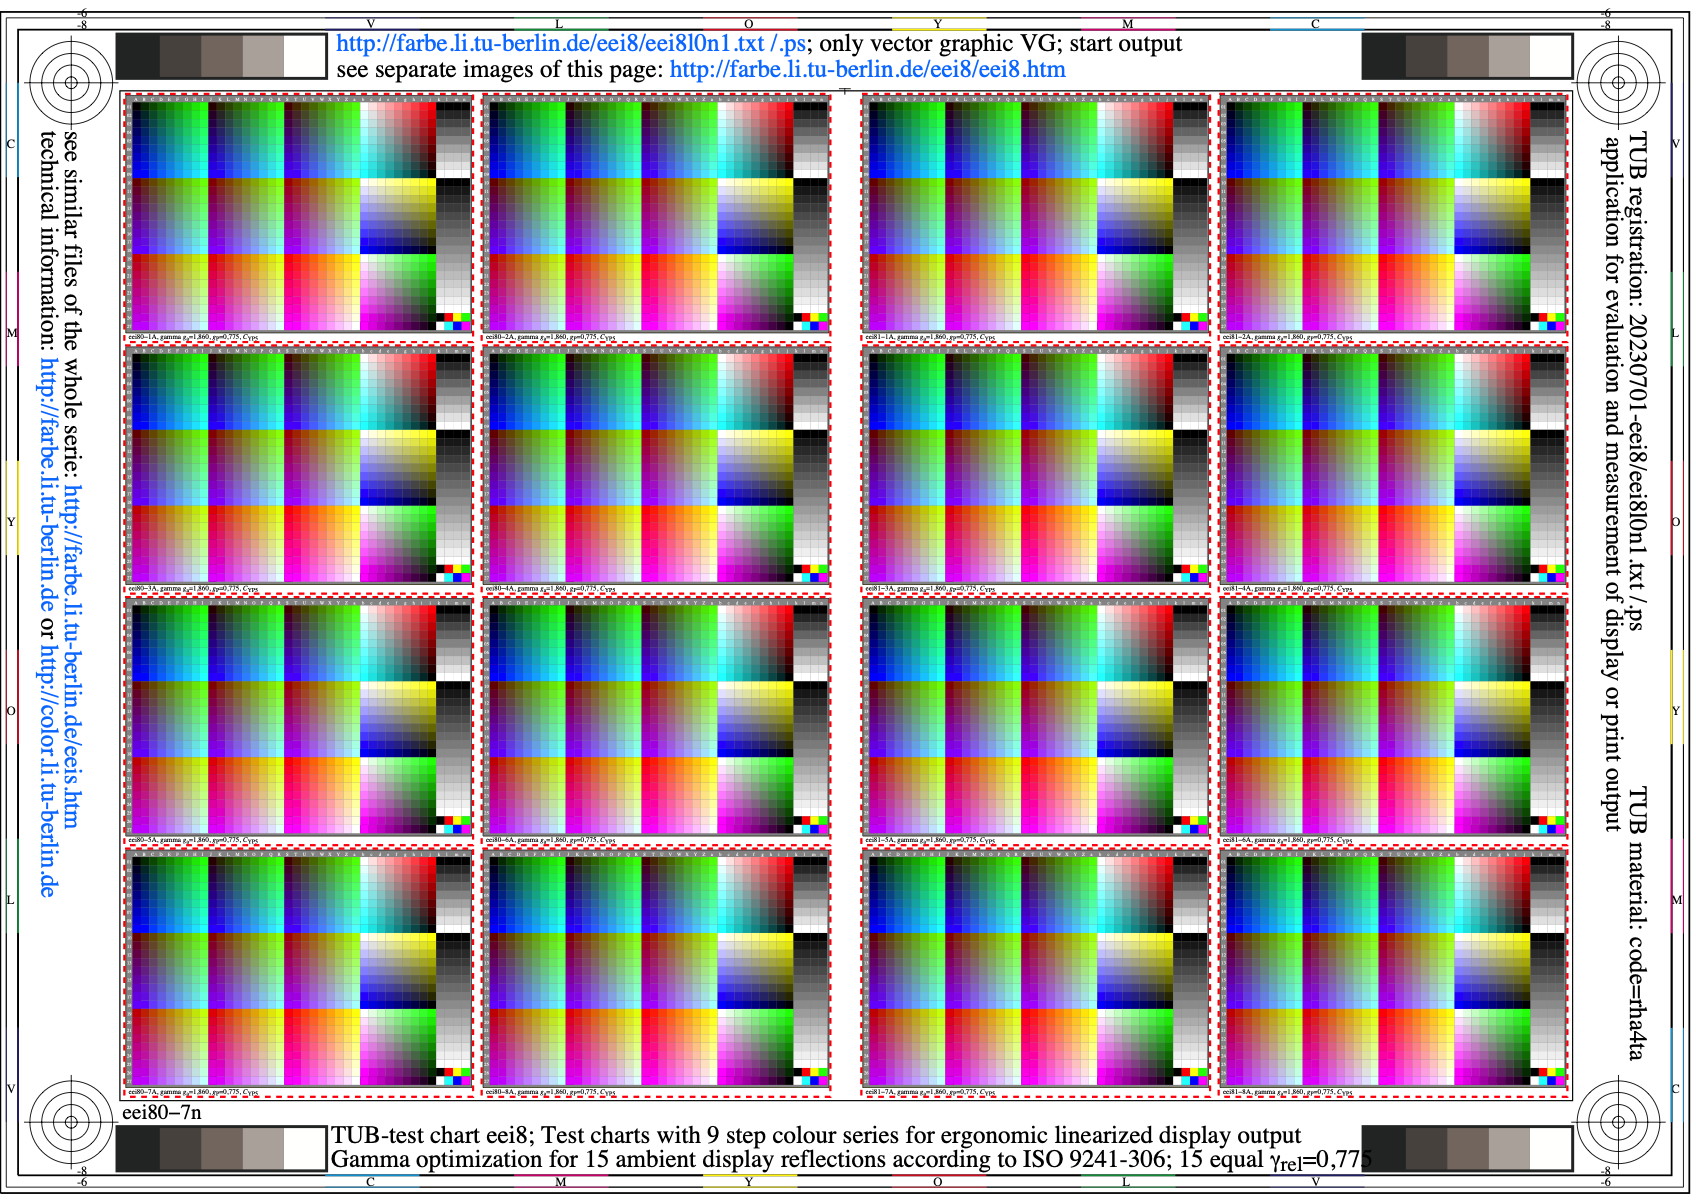
Figure eei8l0n1.jpg: Output in format A6 of the file
eei8l0np.pdf, see
eei8l0n1.
ps /
txt /
pdf /
jpg
eei8: TUB-test chart eei8; 9 step colour series for gamma
optimization for 15 display reflections & contrasts according to
ISO 9241\55306 and ISO/IEC 15775; 15 equal gamma_rel=0,775
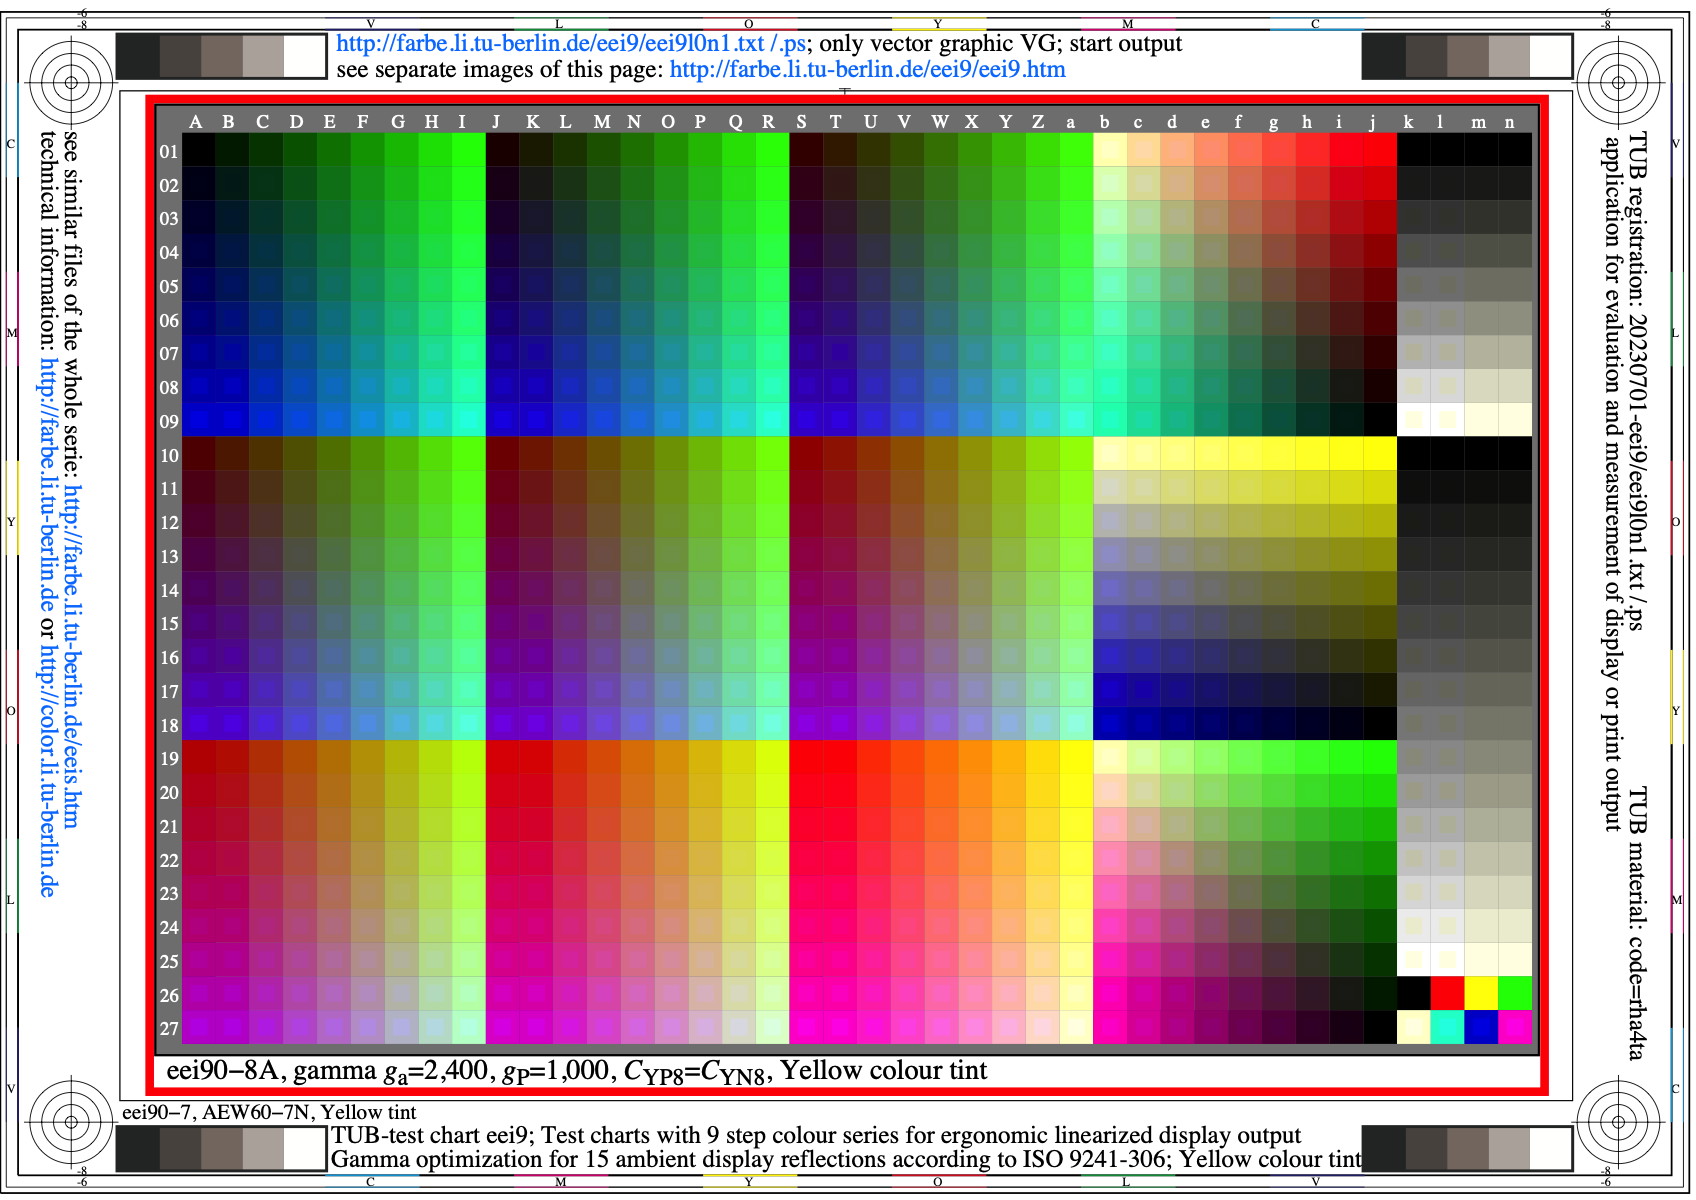
Figure eei9l0n1.jpg: Output in format A6 of the file
eei9l0np.pdf, see
eei9l0n1.
ps /
txt /
pdf /
jpg
eei9: TUB-test chart eei9; 9 step colour series for gamma
optimization for 15 display reflections & contrasts according to
ISO 9241\55306 and ISO/IEC 15775; gamma_rel=1,000, yellow tint
-------
For the archive information (2000-2009) of the BAM server "www.ps.bam.de"
(2000-2018)
about colour test charts, colorimetric calculations,
standards, and publications, see
indexAE.html in English,
indexAG.html in German.
Back to the main page of this TUB web site (NOT archive), see
index.html in English,
indexDE.html in German.