Figure eeh0l0n1.jpg: Output in format A6 of the file eeh0l0np.pdf, see
eeh0l0n1. ps / txt / pdf / jpg
240215 1L2L0X0F_K2710.KTS/YEhlEIN.KTS, http://farbe.li.tu-berlin.de/eehs.htm or http://color.li.tu-berlin.de/eehs.htm
For links to the
Section 2, Chapter E
Colour Metrics, Differences, and Appearance (2023),
see
For this image page with 10 colour series, see
eehs in English,
eghs in German.
For the previous image page, see
eegs in English,
eggs in German.
For the next image page, see
eeis in English,
egis in German.
For the first image page of the previous chapter D, see
DEAS in English,
DGAS in German.
For the first image page of the next chapter F (under work), see
feas in English,
fgas in German.
Content list of chapter E:
eea_i in English or
ega_i in German.
Summary of chapter E:
eea_s in English or
ega_s in German.
For the large image page of chapter E with 260 colour series, see
ee2s in English or
eg2s in German.
Section 2, Chapter E
Colour Metrics, Differences, and Appearance (2023),
Image part eehs
The following ten pages eeh0 to eeh9 of this chapter
show the content with links to the single figures
in up to six formats.
Figure eeh0l0n1.jpg: Output in format A6 of the file
eeh0l0np.pdf, see
eeh0l0n1.
ps /
txt /
pdf /
jpg
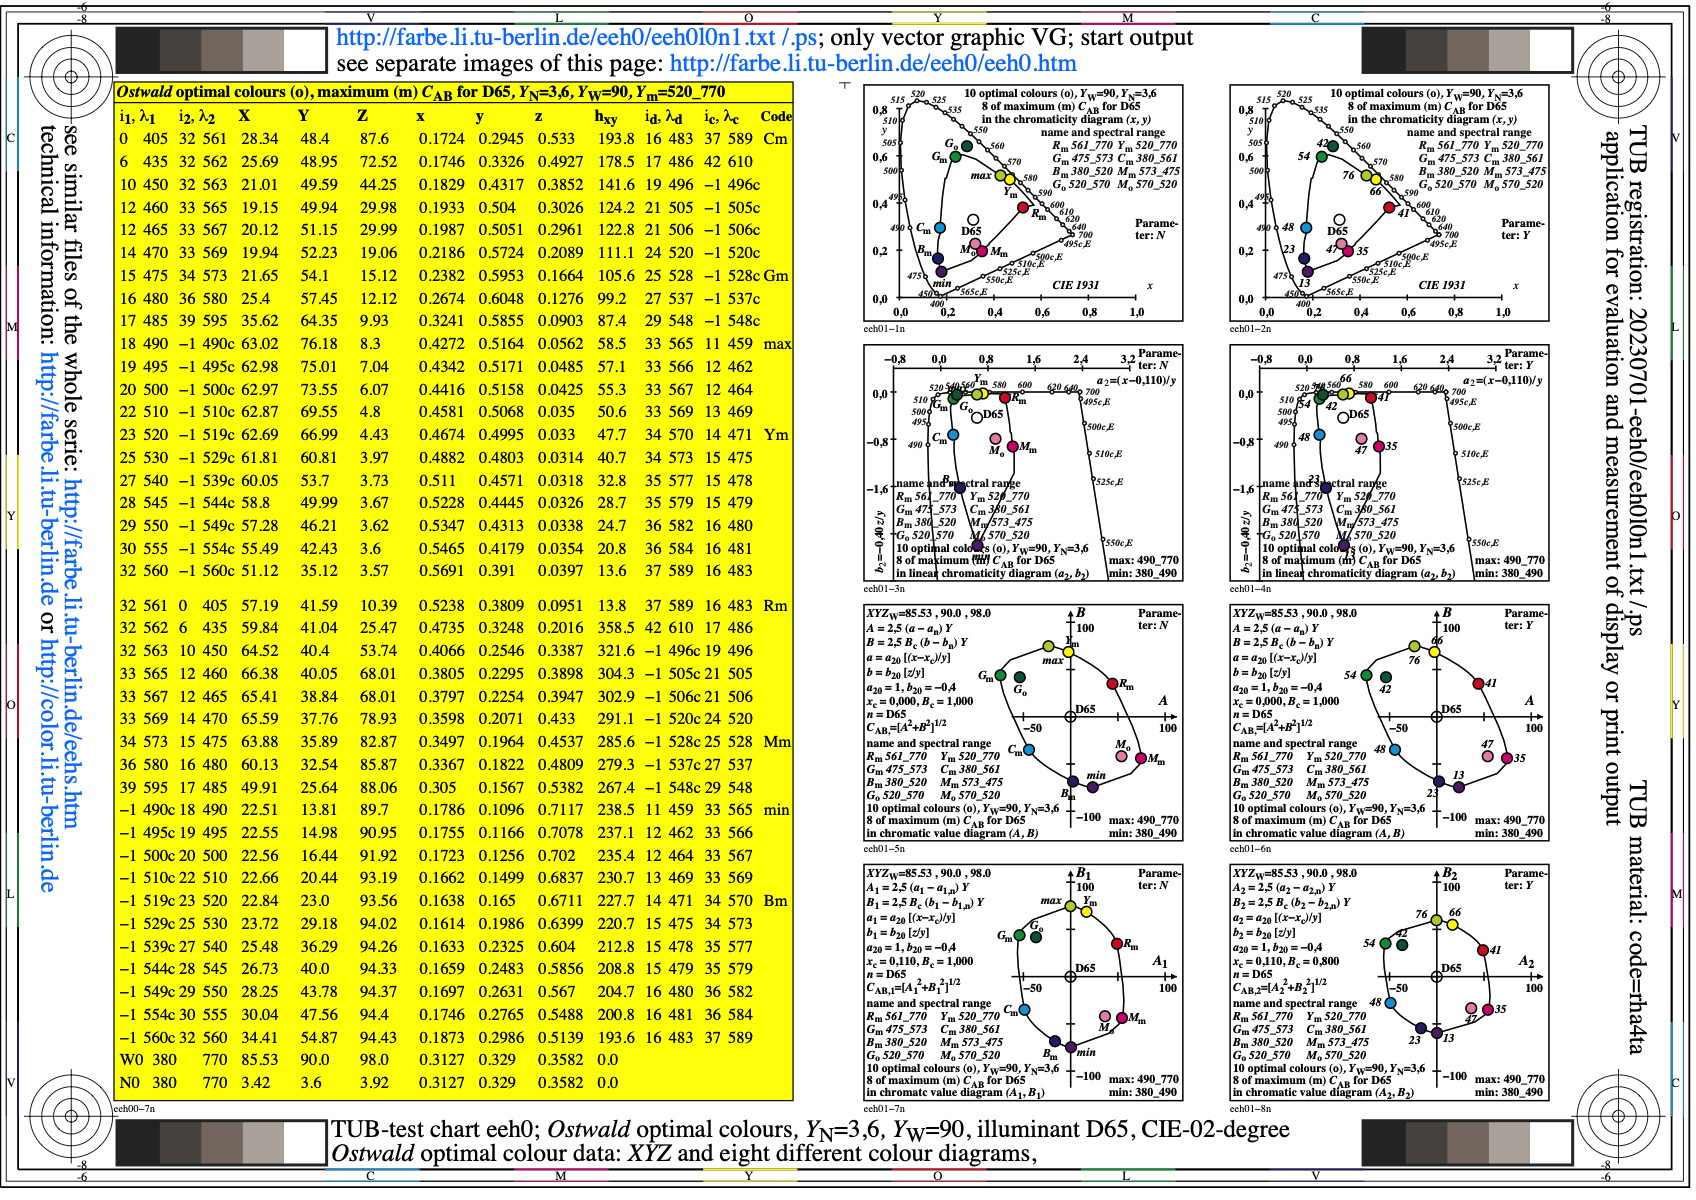
eeh0: TUB-test chart eeh0; Ostwald-optimal colours
YN=3,6, YW=90, CIE illuminant D65, CIE 02 degree
XYZ data, wavelength limits, and 8 colour diagrams
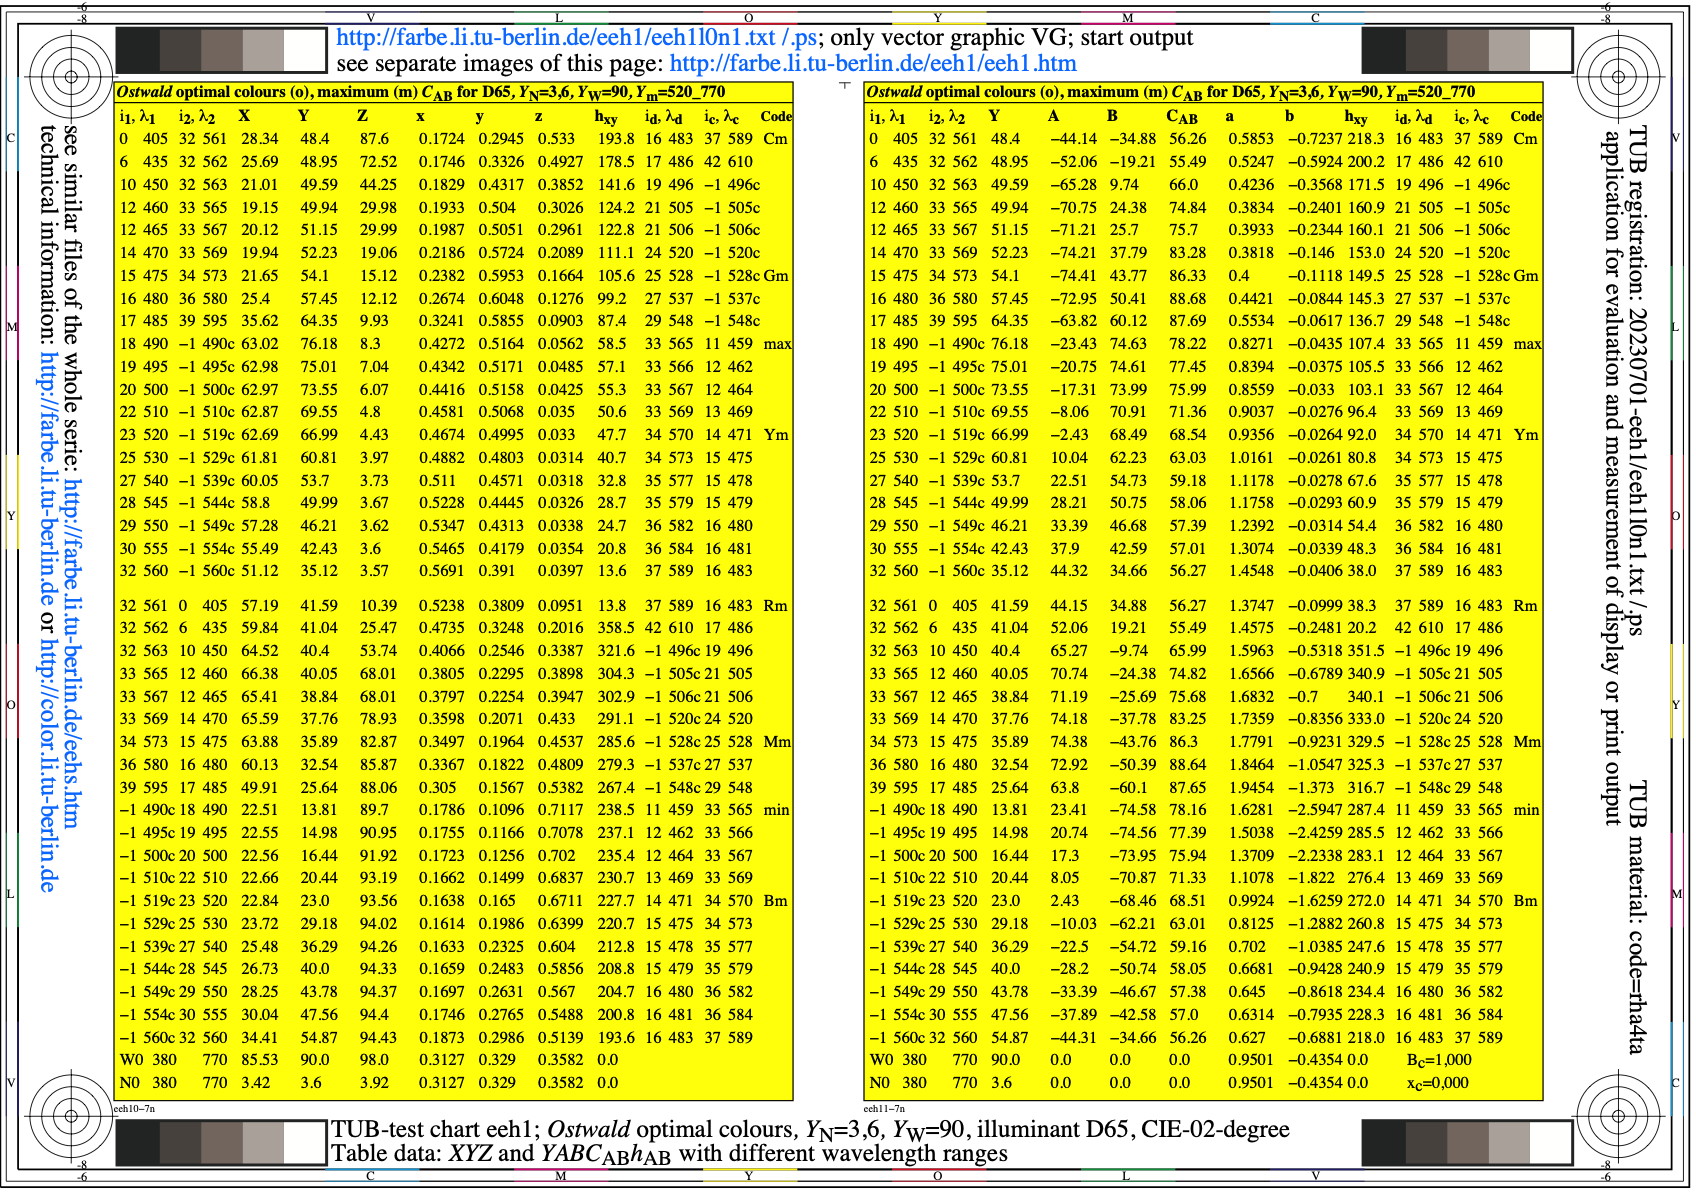
Figure eeh1l0n1.jpg: Output in format A6 of the file
eeh1l0np.pdf, see
eeh1l0n1.
ps /
txt /
pdf /
jpg
eeh1: TUB-test chart eeh1; Ostwald-optimal colours
YN=3,6, YW=90, CIE illuminant D65, CIE 02 degree
Table data XYZ and YABCh with wavelength limits
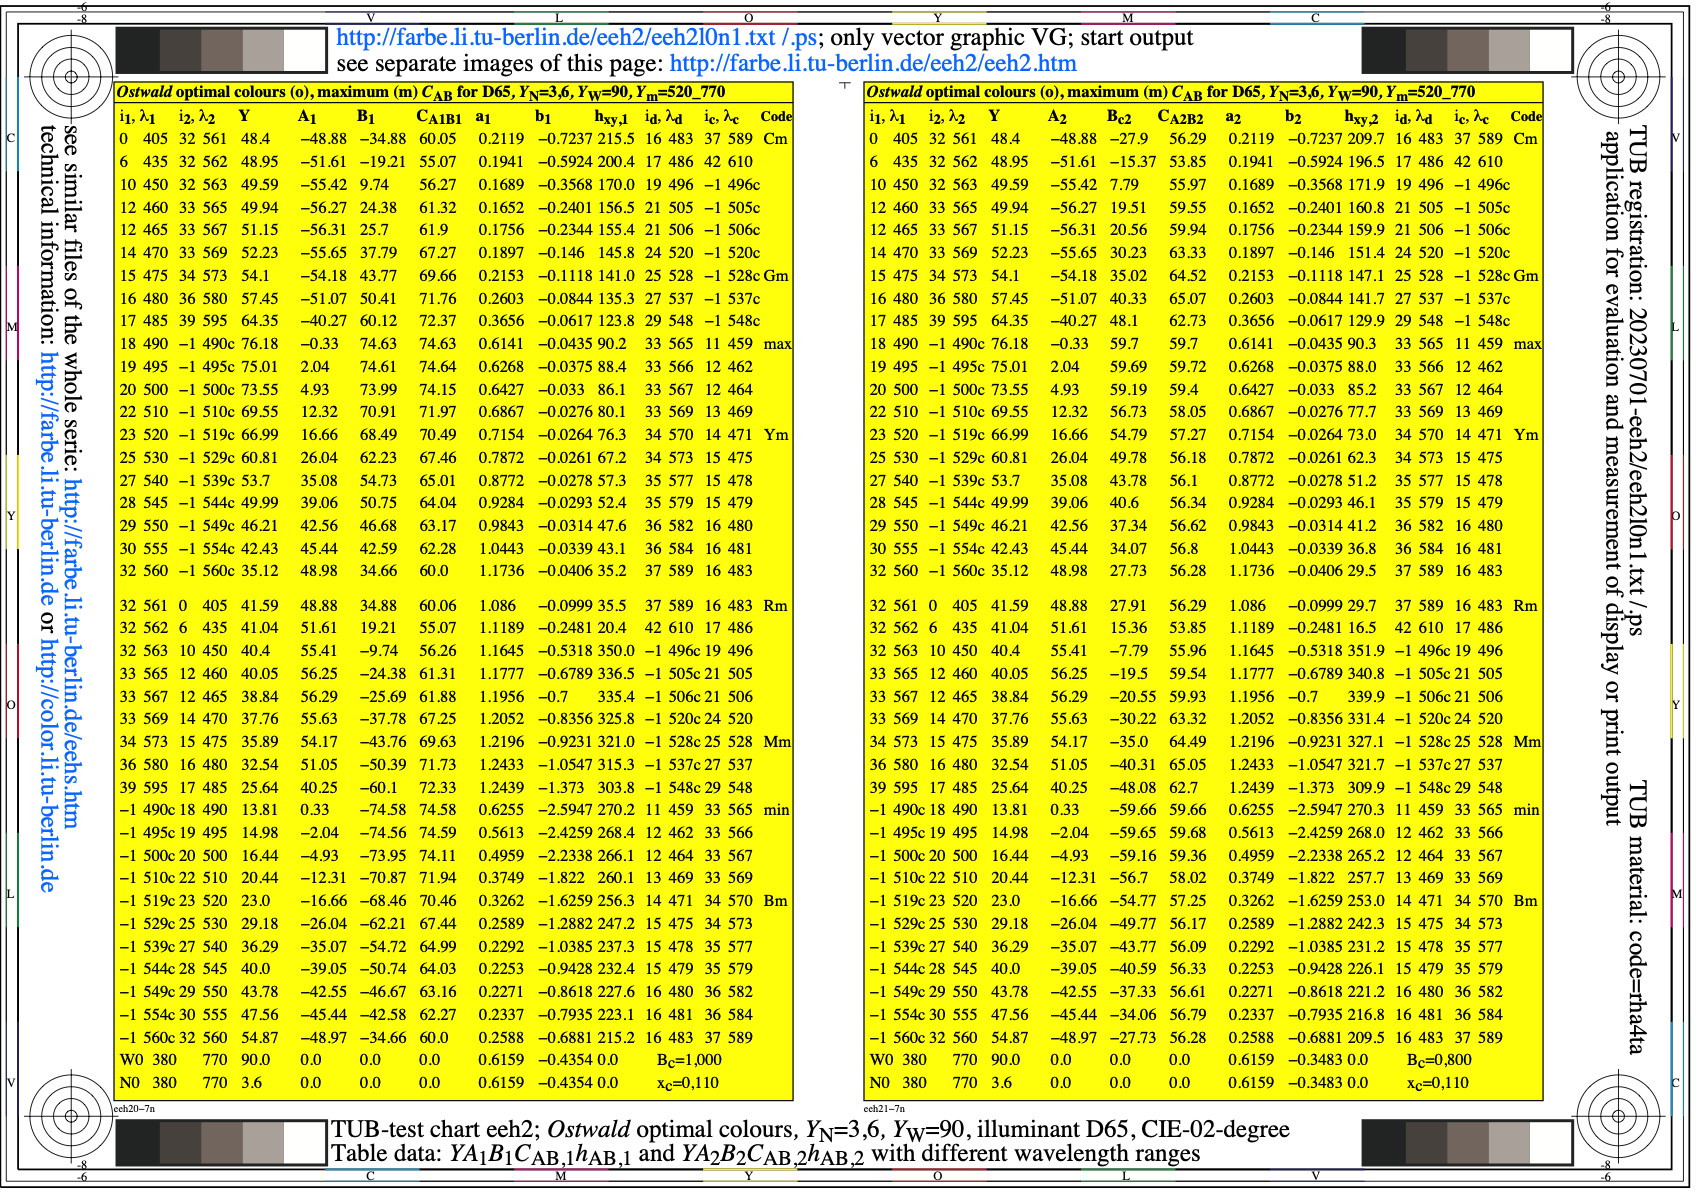
Figure eeh2l0n1.jpg: Output in format A6 of the file
eeh2l0np.pdf, see
eeh2l0n1.
ps /
txt /
pdf /
jpg
eeh2: TUB-test chart eeh2; Ostwald-optimal colours
YN=3,6, YW=90, CIE illuminant D65, CIE 02 degree
Table data YABCh1 and YABCh2 with wavelength limits
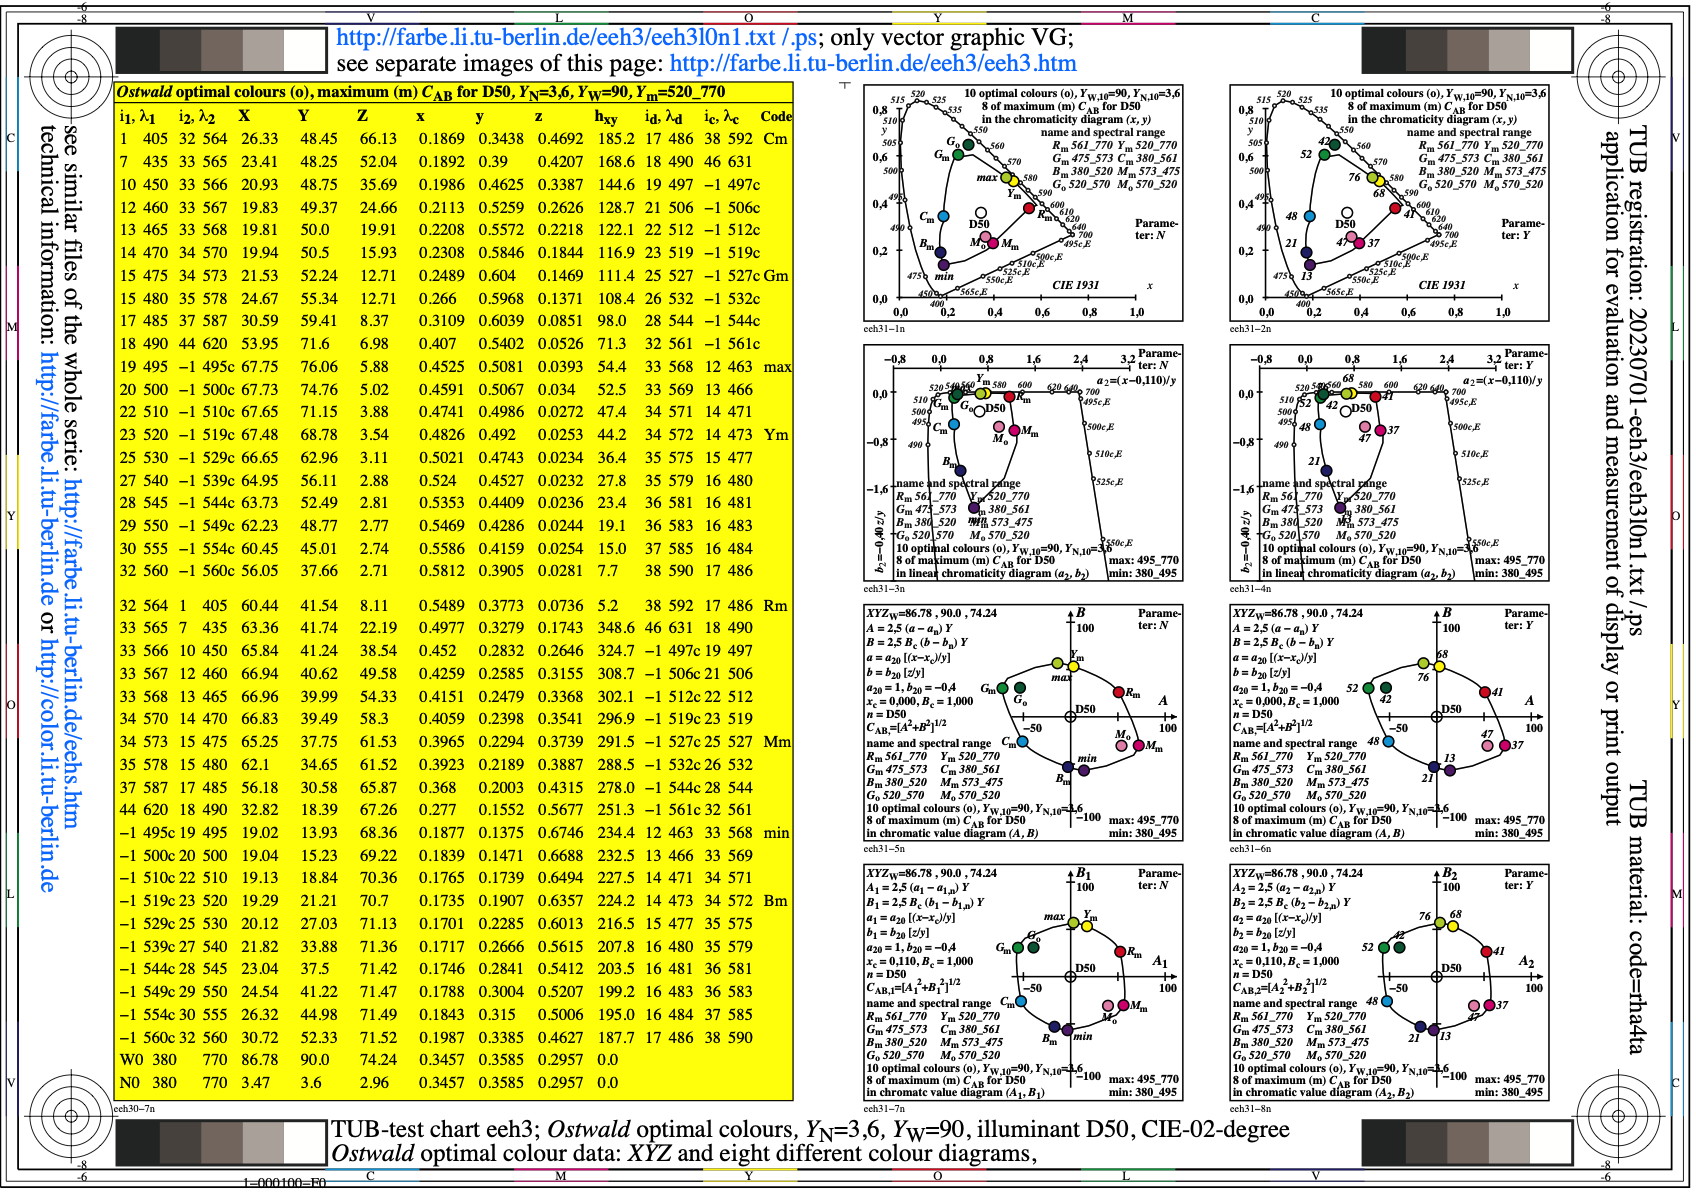
Figure eeh3l0n1.jpg: Output in format A6 of the file
eeh3l0np.pdf, see
eeh3l0n1.
ps /
txt /
pdf /
jpg
eeh3: TUB-test chart eeh3; Ostwald-optimal colours
YN=3,6, YW=90, CIE illuminant D50, CIE 02 degree
XYZ data, wavelength limits, and 8 colour diagrams
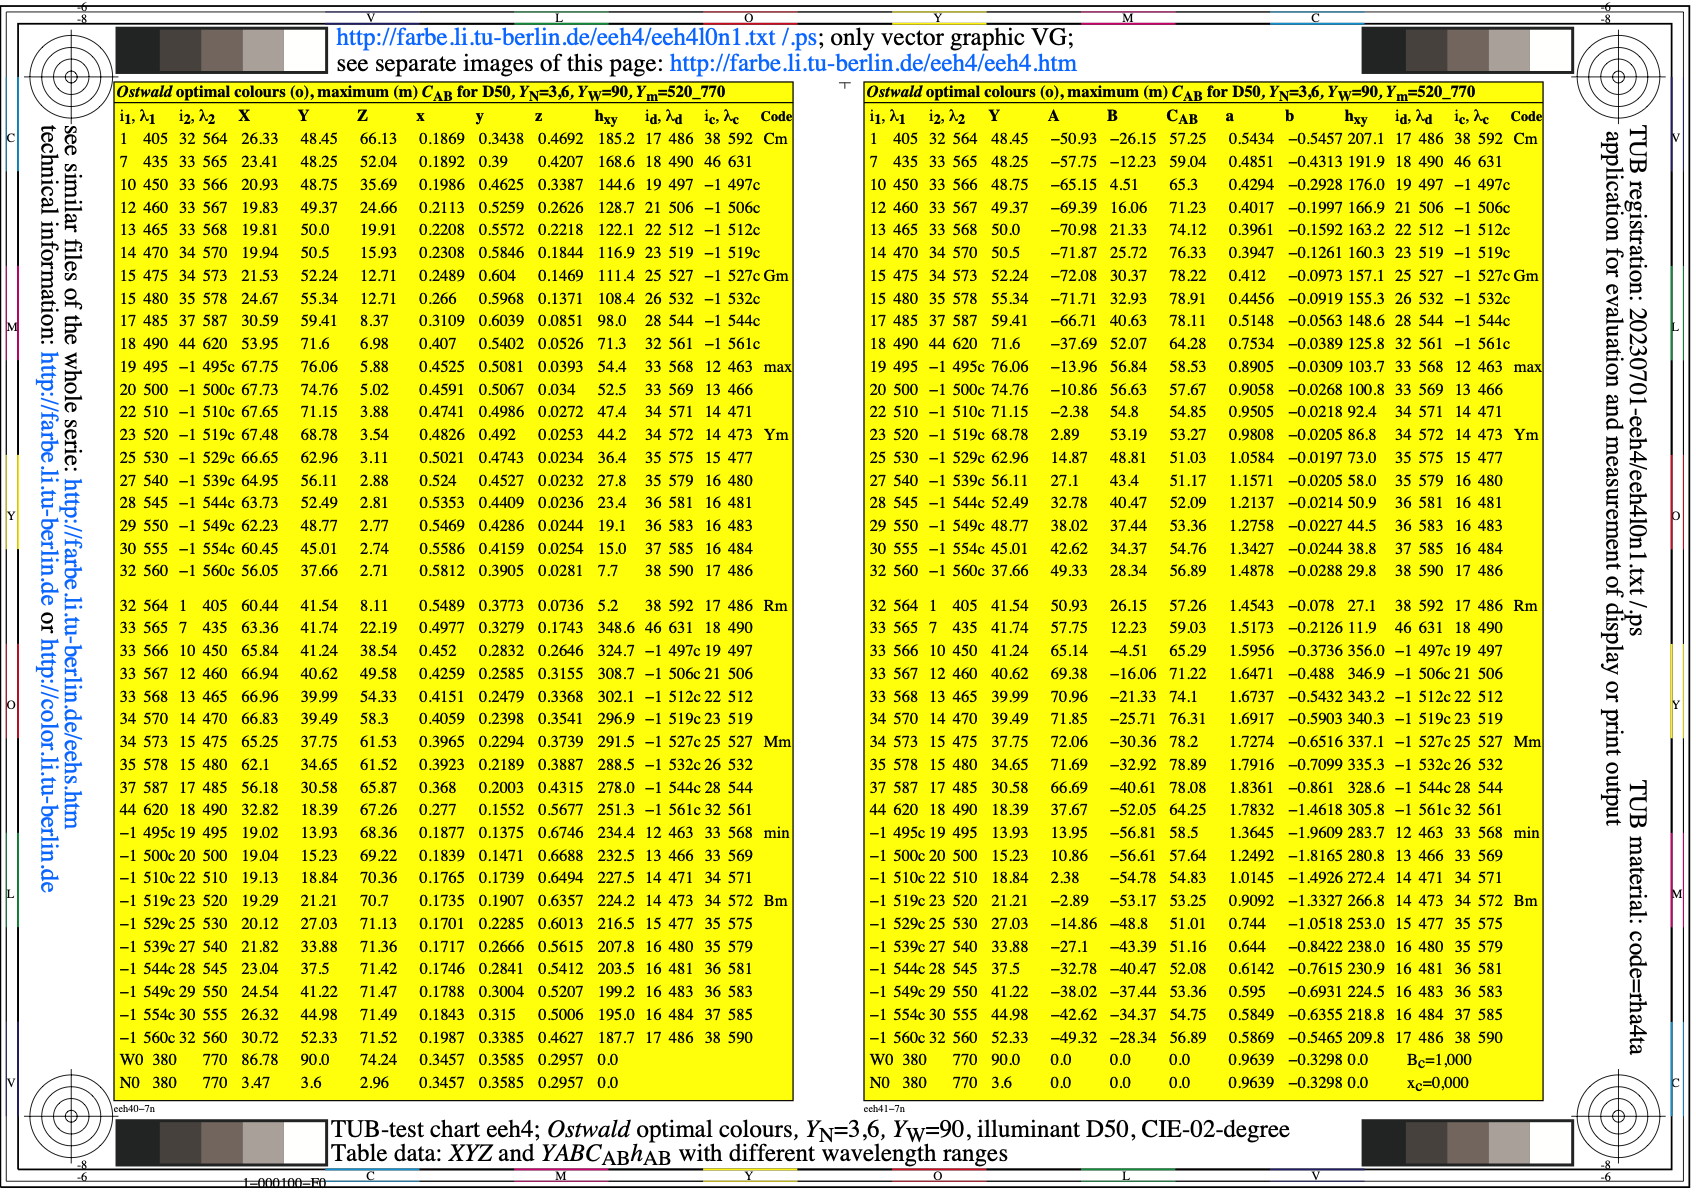
Figure eeh4l0n1.jpg: Output in format A6 of the file
eeh4l0np.pdf, see
eeh4l0n1.
ps /
txt /
pdf /
jpg
eeh4: TUB-test chart eeh4; Ostwald-optimal colours
YN=3,6, YW=90, CIE illuminant D50, CIE 02 degree
Table data XYZ and YABCh with wavelength limits

Figure eeh5l0n1.jpg: Output in format A6 of the file
eeh5l0np.pdf, see
eeh5l0n1.
ps /
txt /
pdf /
jpg
eeh5: TUB-test chart eeh5; Ostwald-optimal colours
YN=3,6, YW=90, CIE illuminant D50, CIE 02 degree
Table data YABCh1 and YABCh2 with wavelength limits
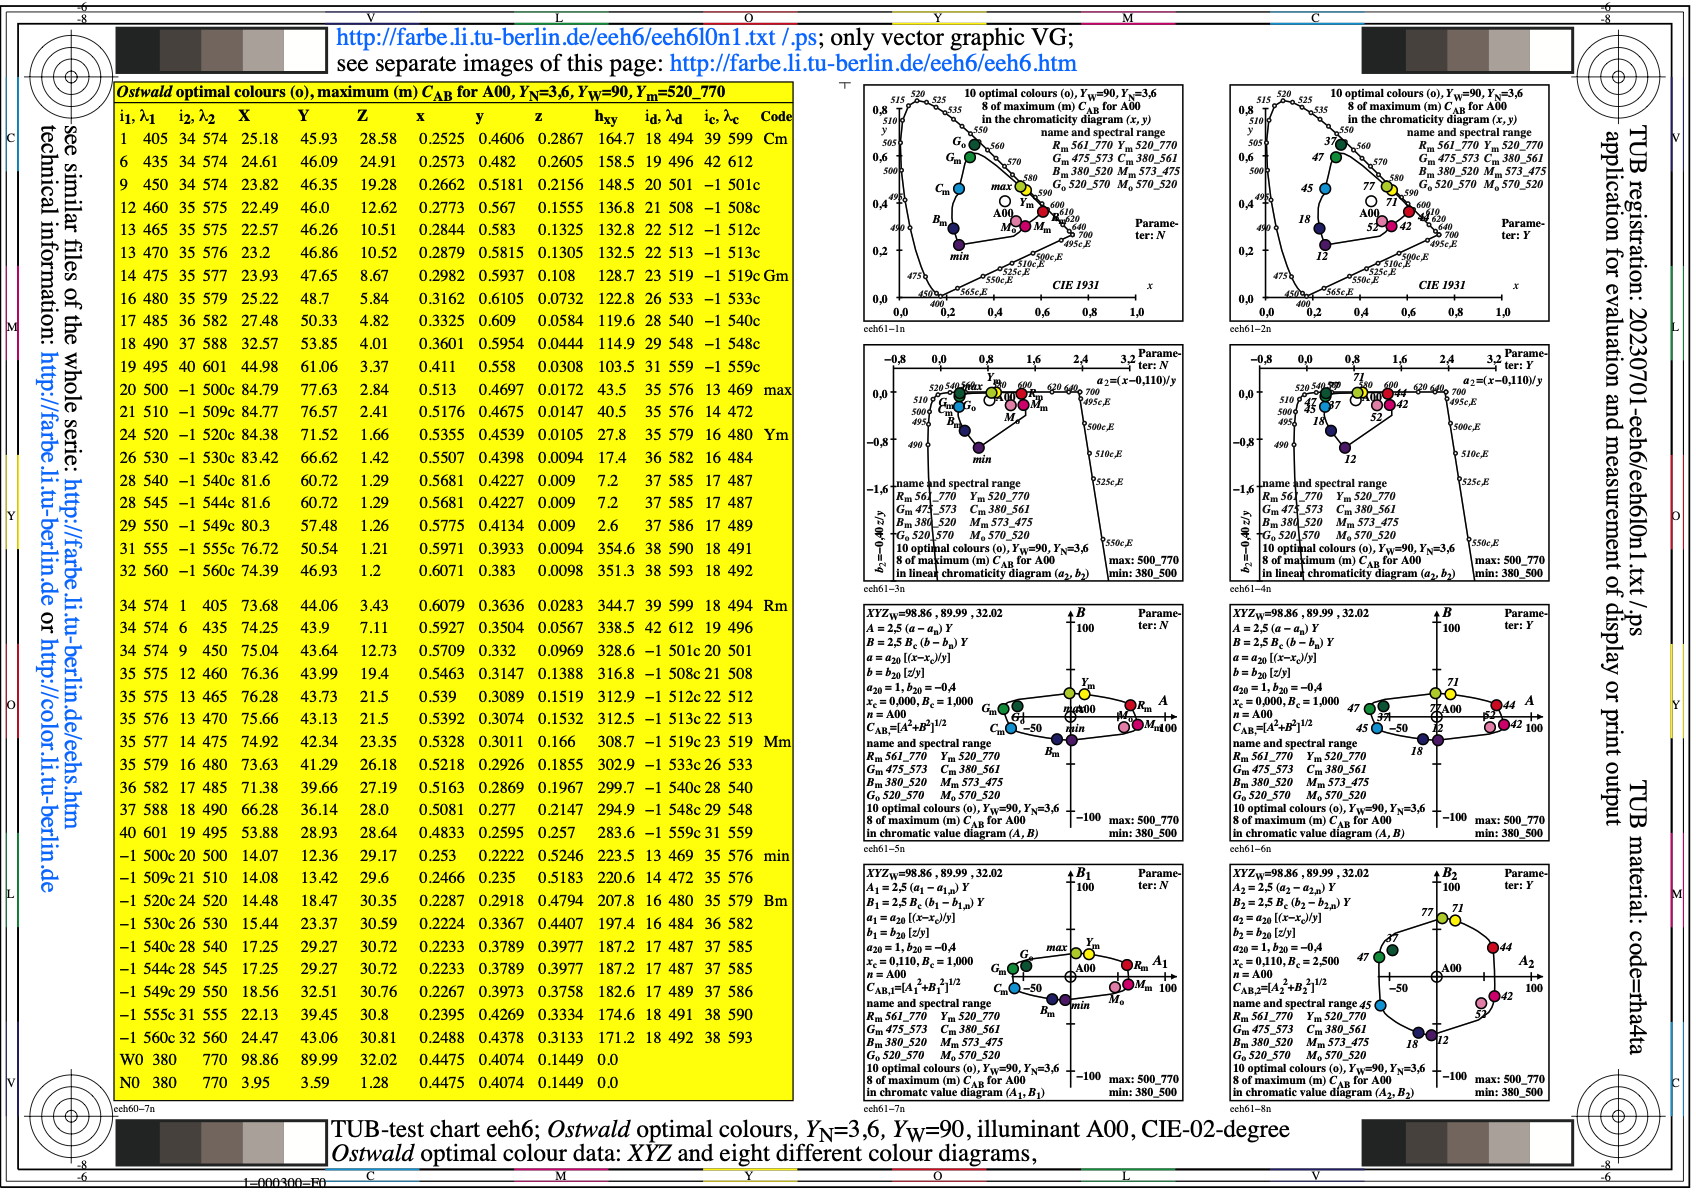
Figure eeh6l0n1.jpg: Output in format A6 of the file
eeh6l0np.pdf, see
eeh6l0n1.
ps /
txt /
pdf /
jpg
eeh6: TUB-test chart eeh6; Ostwald-optimal colours
YN=3,6, YW=90, CIE illuminant A, CIE 02 degree
XYZ data, wavelength limits, and 8 colour diagrams
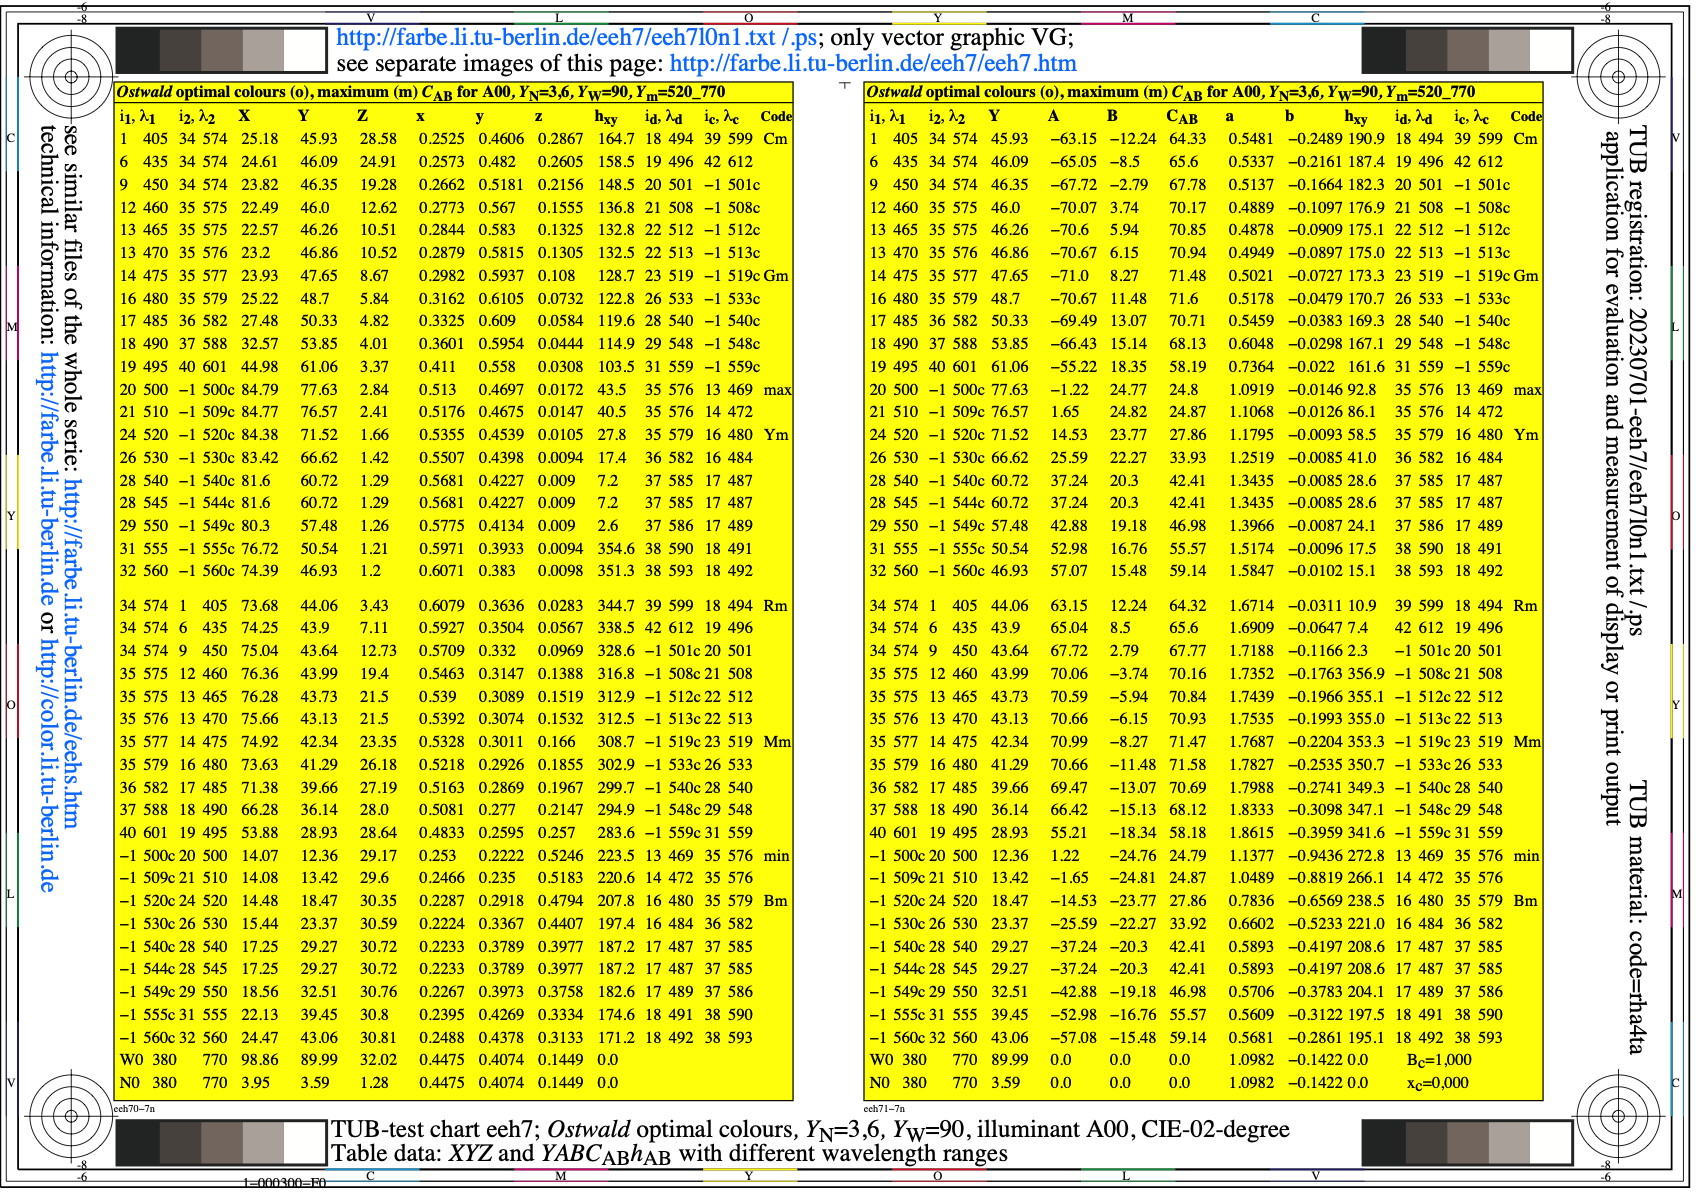
Figure eeh7l0n1.jpg: Output in format A6 of the file
eeh7l0np.pdf, see
eeh7l0n1.
ps /
txt /
pdf /
jpg
eeh7: TUB-test chart eeh7; Ostwald-optimal colours
YN=3,6, YW=90, CIE illuminant A, CIE 02 degree
Table data XYZ and YABCh with wavelength limits
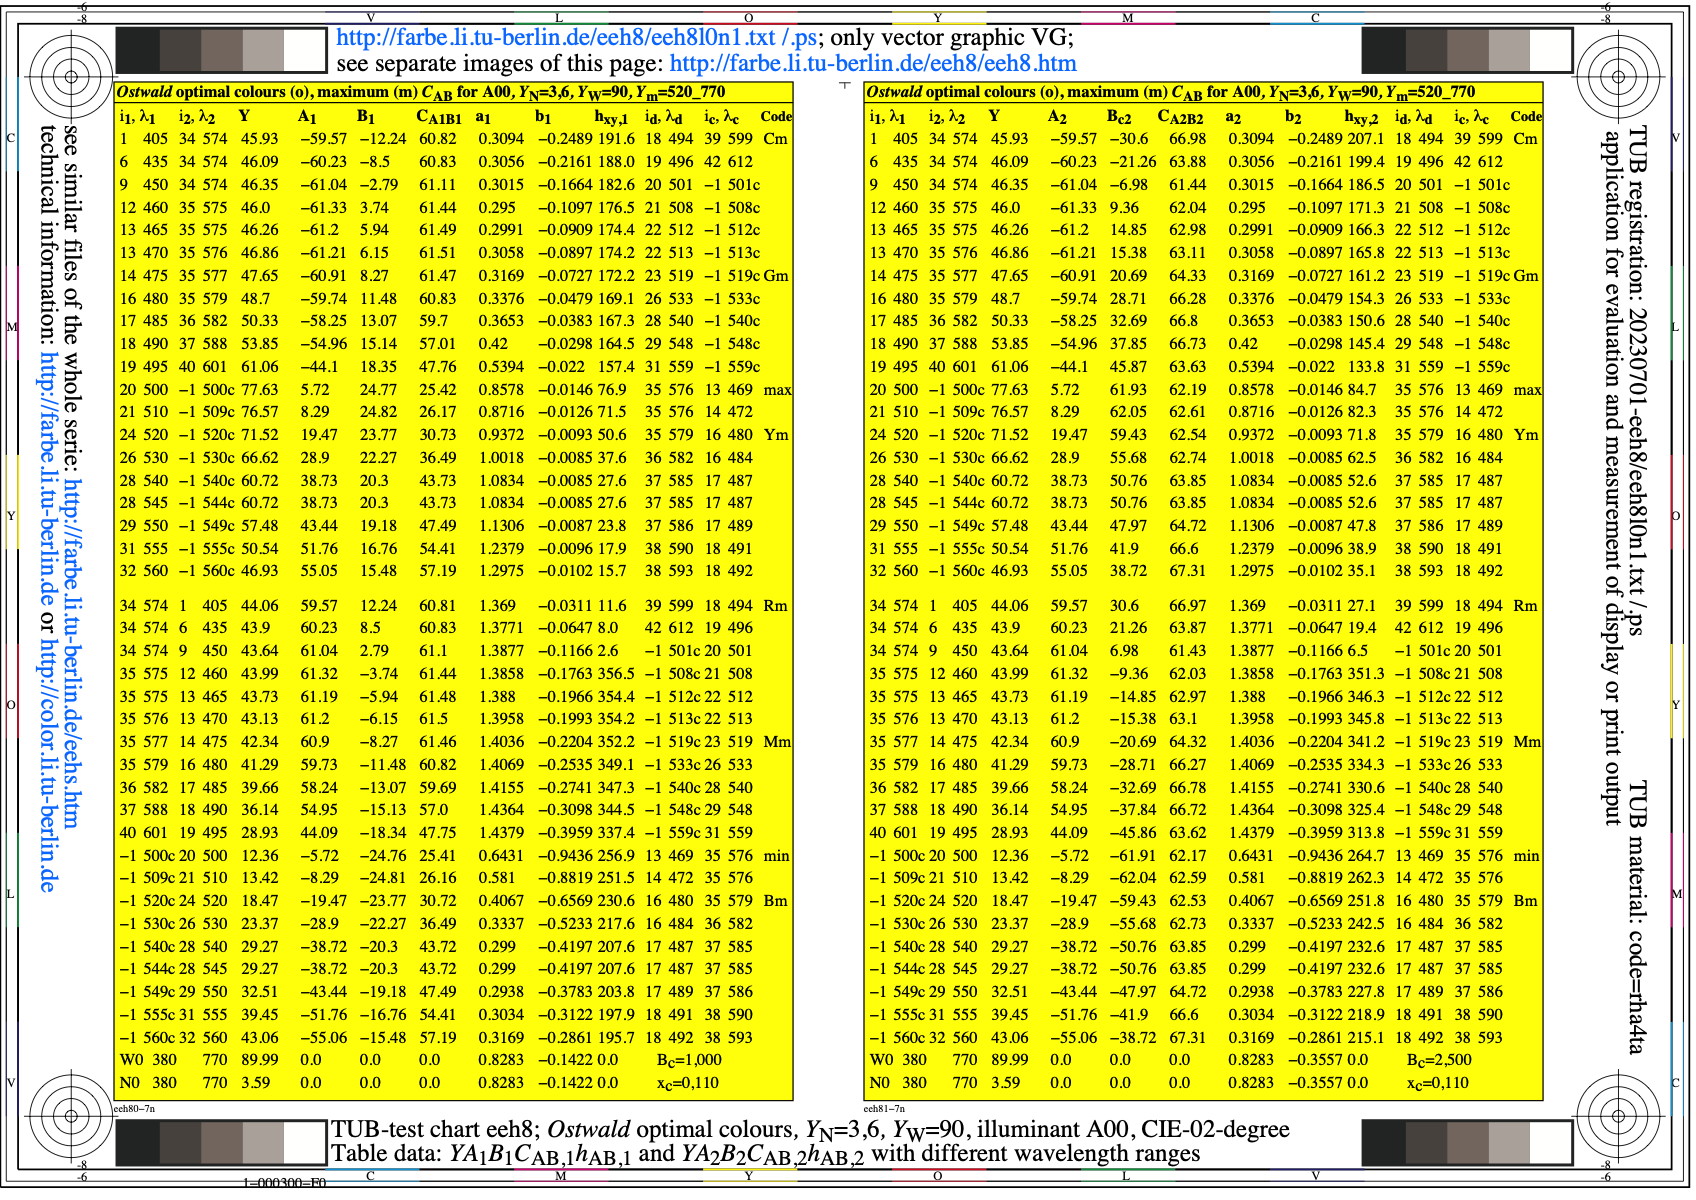
Figure eeh8l0n1.jpg: Output in format A6 of the file
eeh8l0np.pdf, see
eeh8l0n1.
ps /
txt /
pdf /
jpg
eeh8: TUB-test chart eeh8; Ostwald-optimal colours
YN=3,6, YW=90, CIE illuminant A, CIE 02 degree
Table data YABCh1 and YABCh2 with wavelength limits
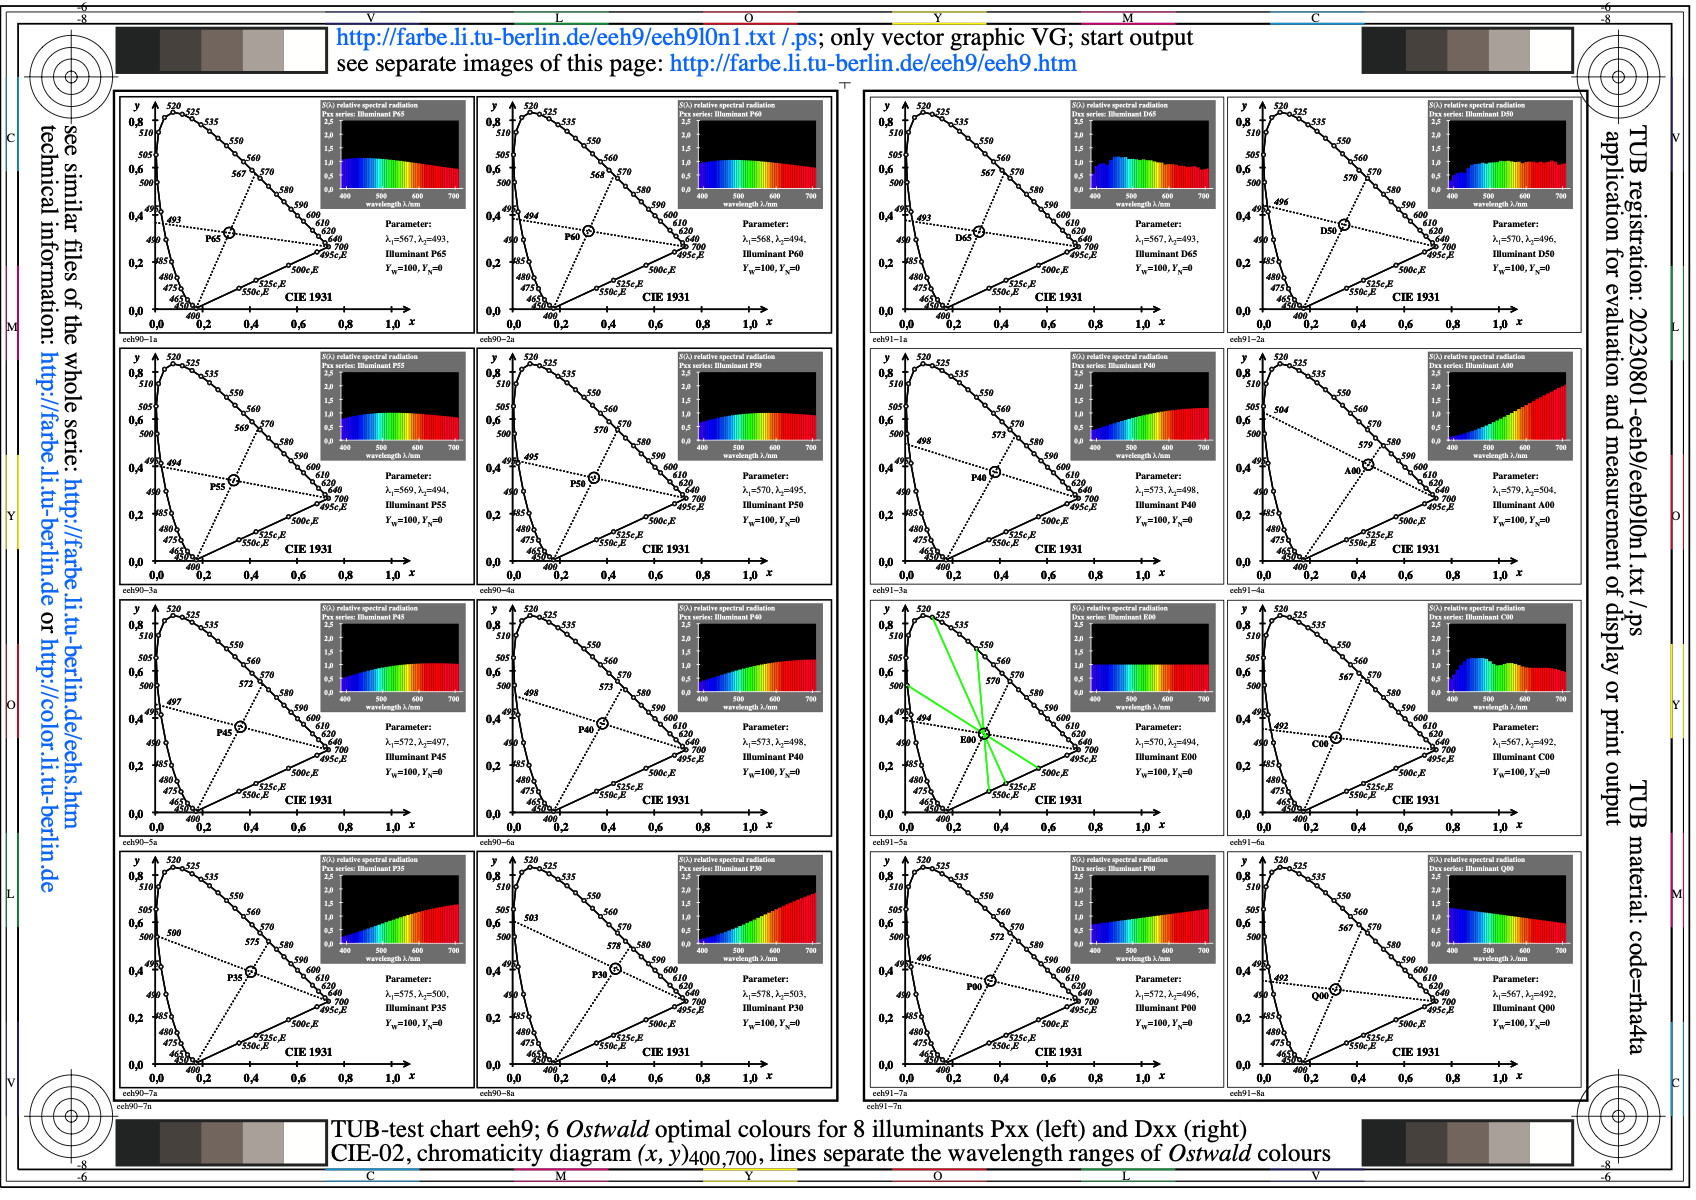
Figure eeh9l0n1.jpg: Output in format A6 of the file
eeh9l0np.pdf, see
eeh9l0n1.
ps /
txt /
pdf /
jpg
eeh9: TUB-test chart eeh9; 8 spectral radiations of Pxx and Dxx
and Dxx for calculation of Ostwald optimal colours;
wavelength limits by (x,y)400,700; CIE 02-degree observer
-------
For the archive information (2000-2009) of the BAM server "www.ps.bam.de"
(2000-2018)
about colour test charts, colorimetric calculations,
standards, and publications, see
indexAE.html in English,
indexAG.html in German.
Back to the main page of this TUB web site (NOT archive), see
index.html in English,
indexDE.html in German.