Figure een0l0n1.jpg: Output in format A6 of the file een0l0np.pdf, see
een0l0n1. ps / txt / pdf / jpg
240215 1L2L0X0F_K2710.KTS/YEnlEIN.KTS, http://farbe.li.tu-berlin.de/eens.htm or http://color.li.tu-berlin.de/eens.htm
For links to the
Section 2, Chapter E
Colour Metrics, Differences, and Appearance (2023),
see
For this image page with 10 colour series, see
eens in English,
egns in German.
For the previous image page, see
eems in English,
egms in German.
For the next image page, see
eeos in English,
egos in German.
For the first image page of the previous chapter D, see
DEAS in English,
DGAS in German.
For the first image page of the next chapter F (under work), see
feas in English,
fgas in German.
Content list of chapter E:
eea_i in English or
ega_i in German.
Summary of chapter E:
eea_s in English or
ega_s in German.
For the large image page of chapter E with 260 colour series, see
ee2s in English or
eg2s in German.
Section 2, Chapter E
Colour Metrics, Differences, and Appearance (2023),
Image part eens
The following ten pages een0 to een9 of this chapter
show the content with links to the single figures
in up to six formats.
Figure een0l0n1.jpg: Output in format A6 of the file
een0l0np.pdf, see
een0l0n1.
ps /
txt /
pdf /
jpg
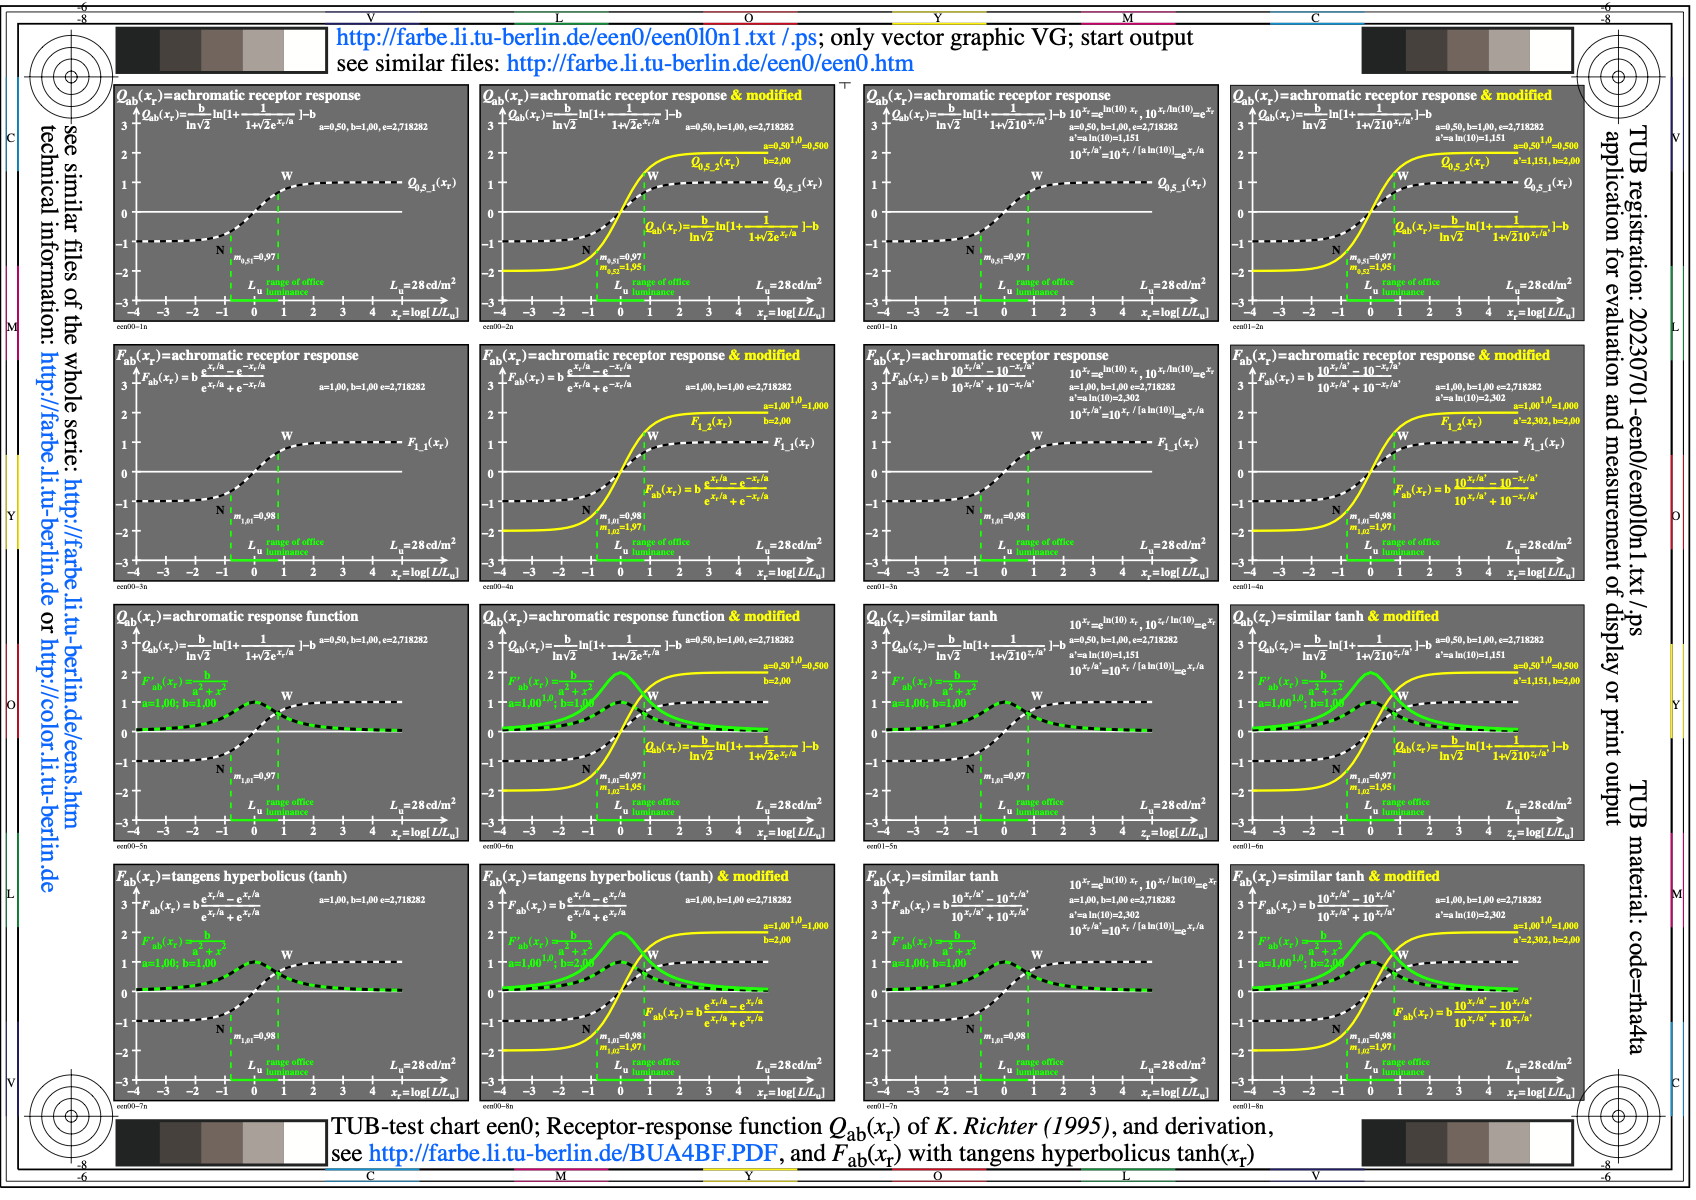
een0: TUB-test chart een0; Receptor-response function of Richter
(1995), see http://color.li.tu-berlin.de/BUA4BF.PDF
and function with tanh, both functions with derivation
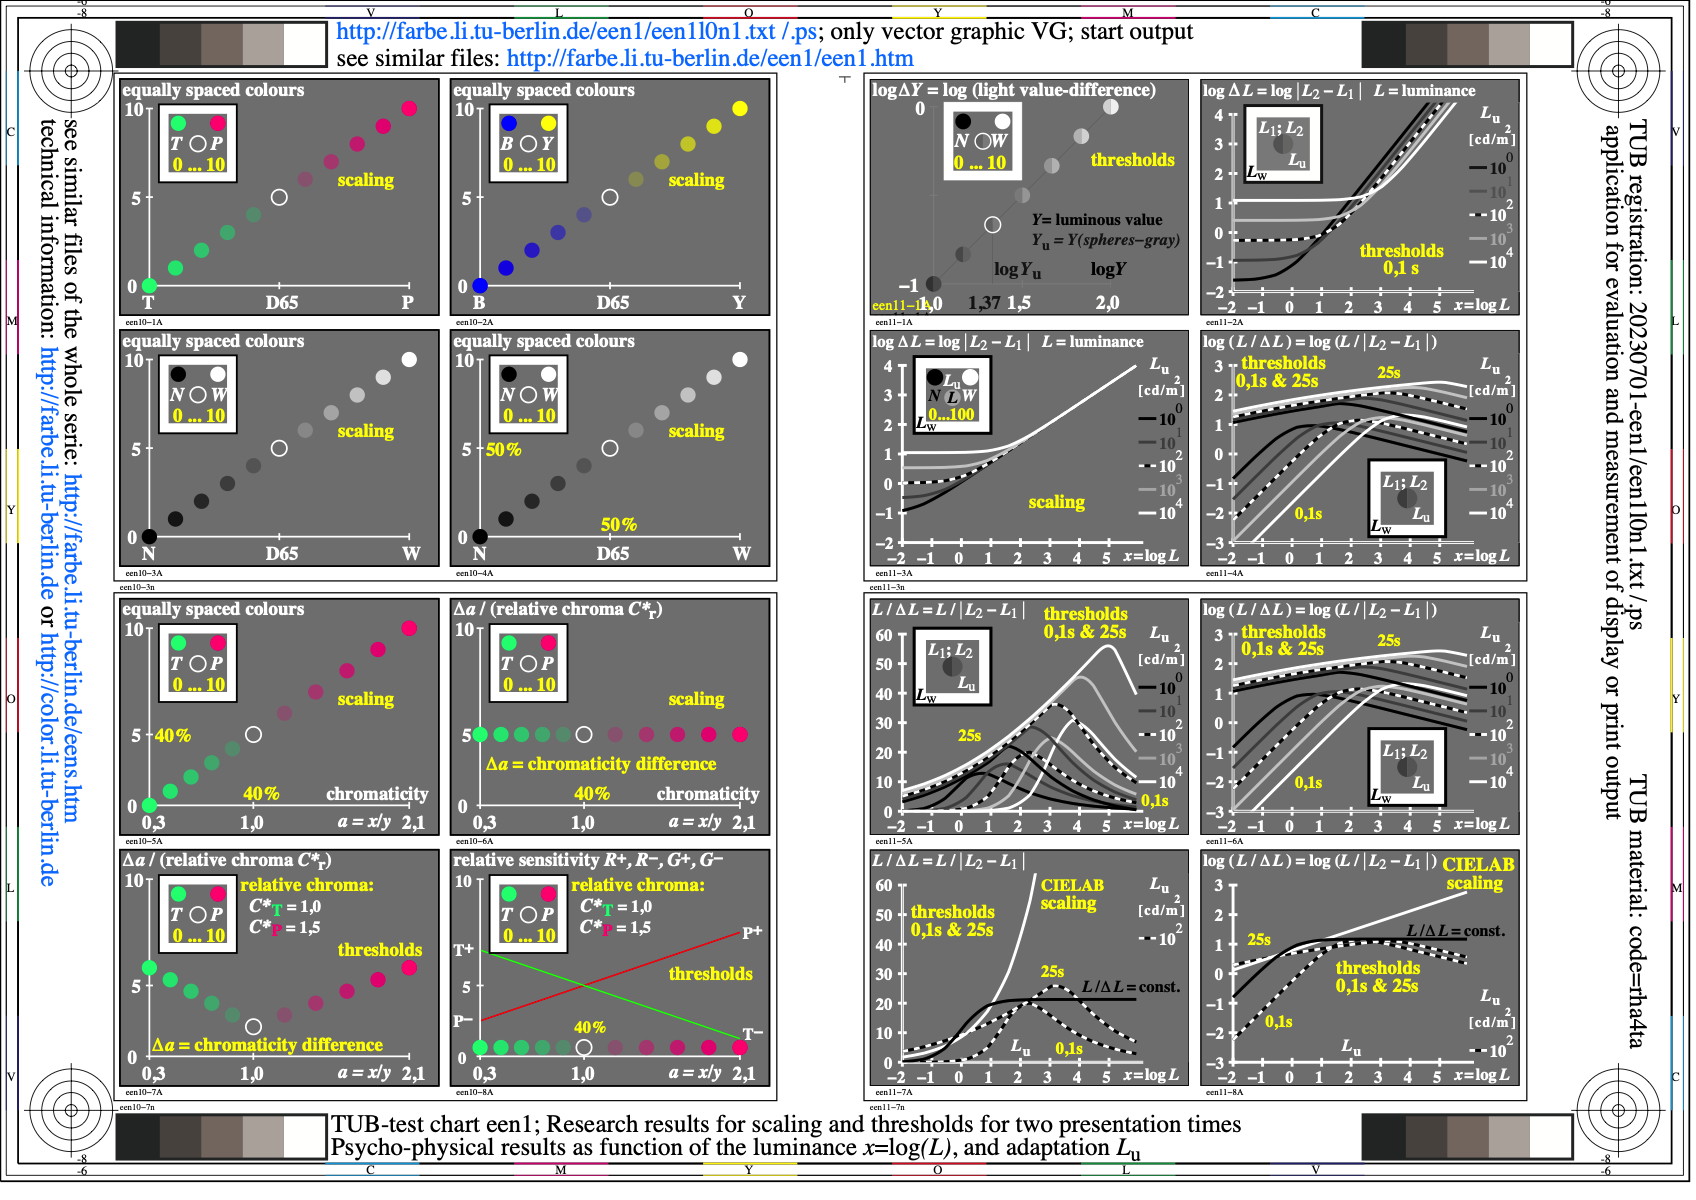
Figure een1l0n1.jpg: Output in format A6 of the file
een1l0np.pdf, see
een1l0n1.
ps /
txt /
pdf /
jpg
een1: TUB-test chart een1; Research results for scaling, thresholds
and for 2 presentation times; psycho-physical models,
and relative luminance x=log(L/Lu) and adaptation Lu
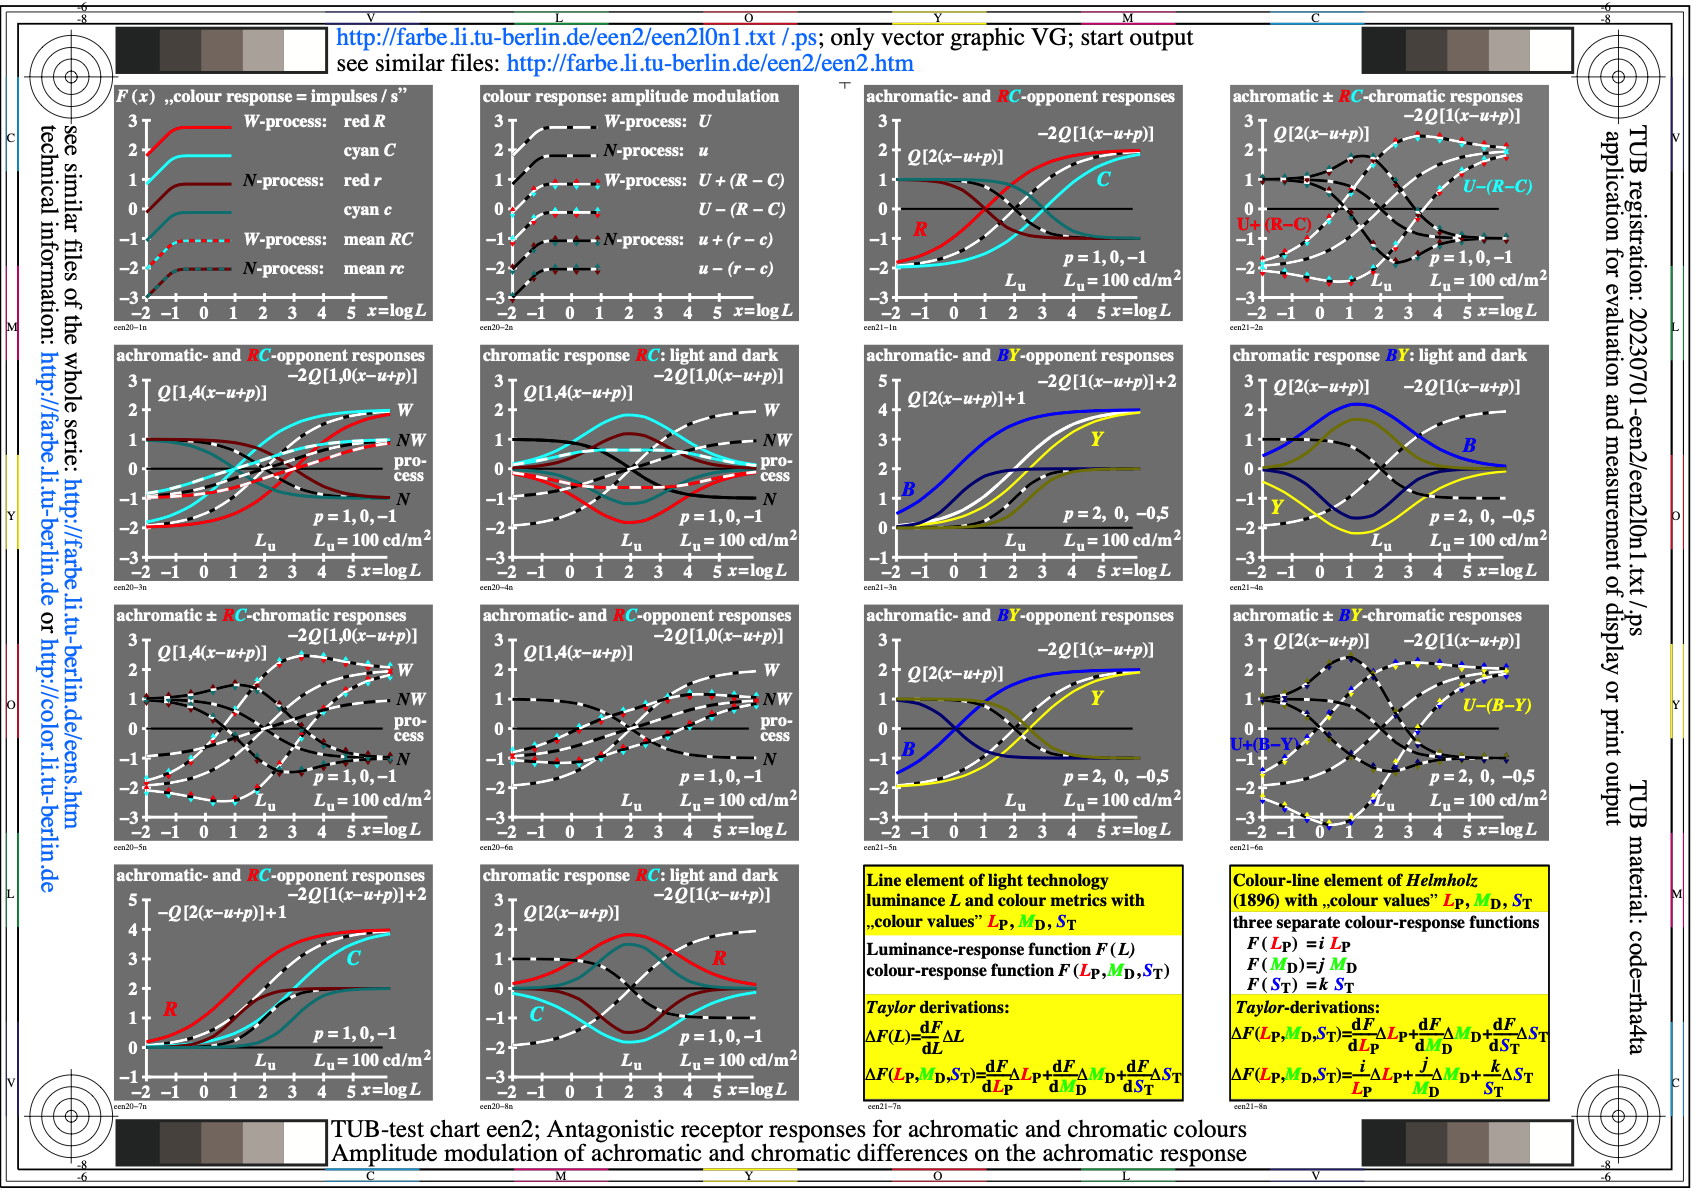
Figure een2l0n1.jpg: Output in format A6 of the file
een2l0np.pdf, see
een2l0n1.
ps /
txt /
pdf /
jpg
een2: TUB-test chart een2; Antagonistic receptor responses
for achromatic and chromatic colours; amplitude modulation of
achromatic and chromatic differences on achromatic responses
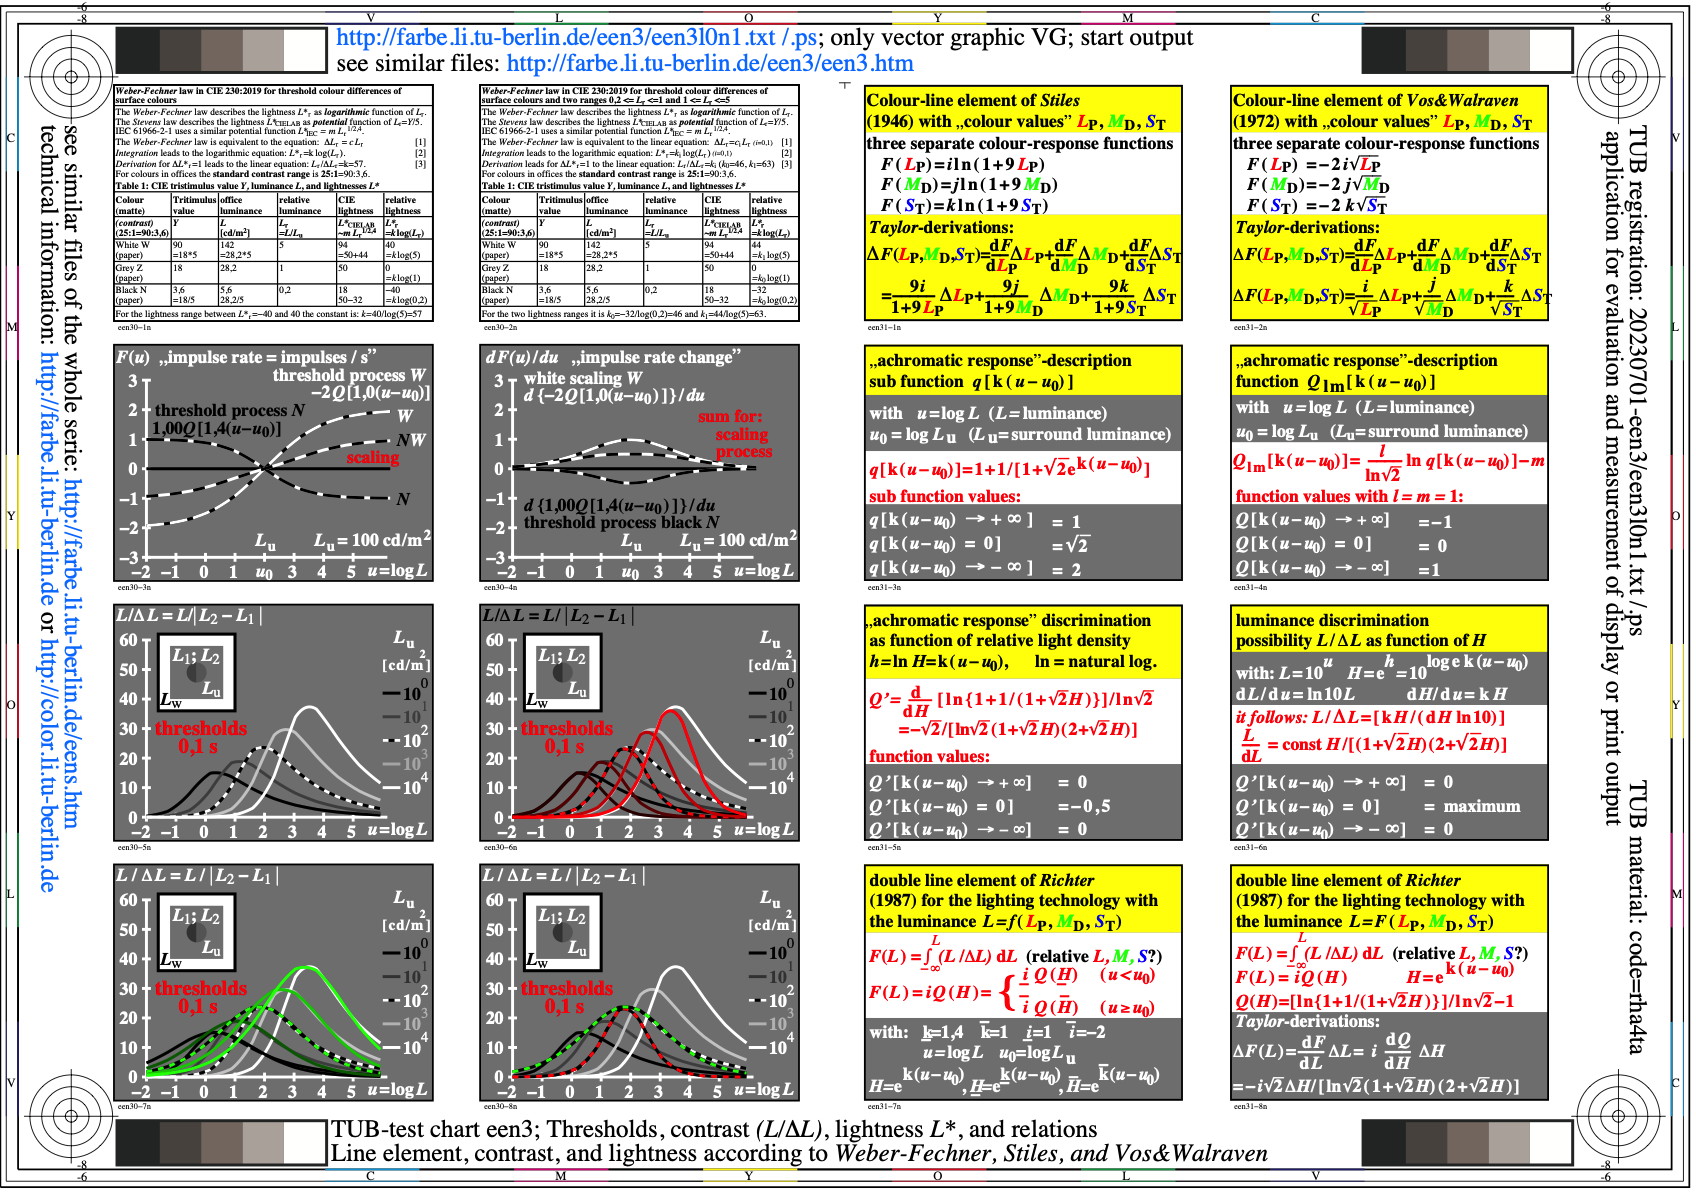
Figure een3l0n1.jpg: Output in format A6 of the file
een3l0np.pdf, see
een3l0n1.
ps /
txt /
pdf /
jpg
een3: TUB-test chart een3; Threshold, contrast L/delta_L,
and lightness L* with internal attribute relations.
Line element, contrast, lightness of Weber-Fechner & Stiles
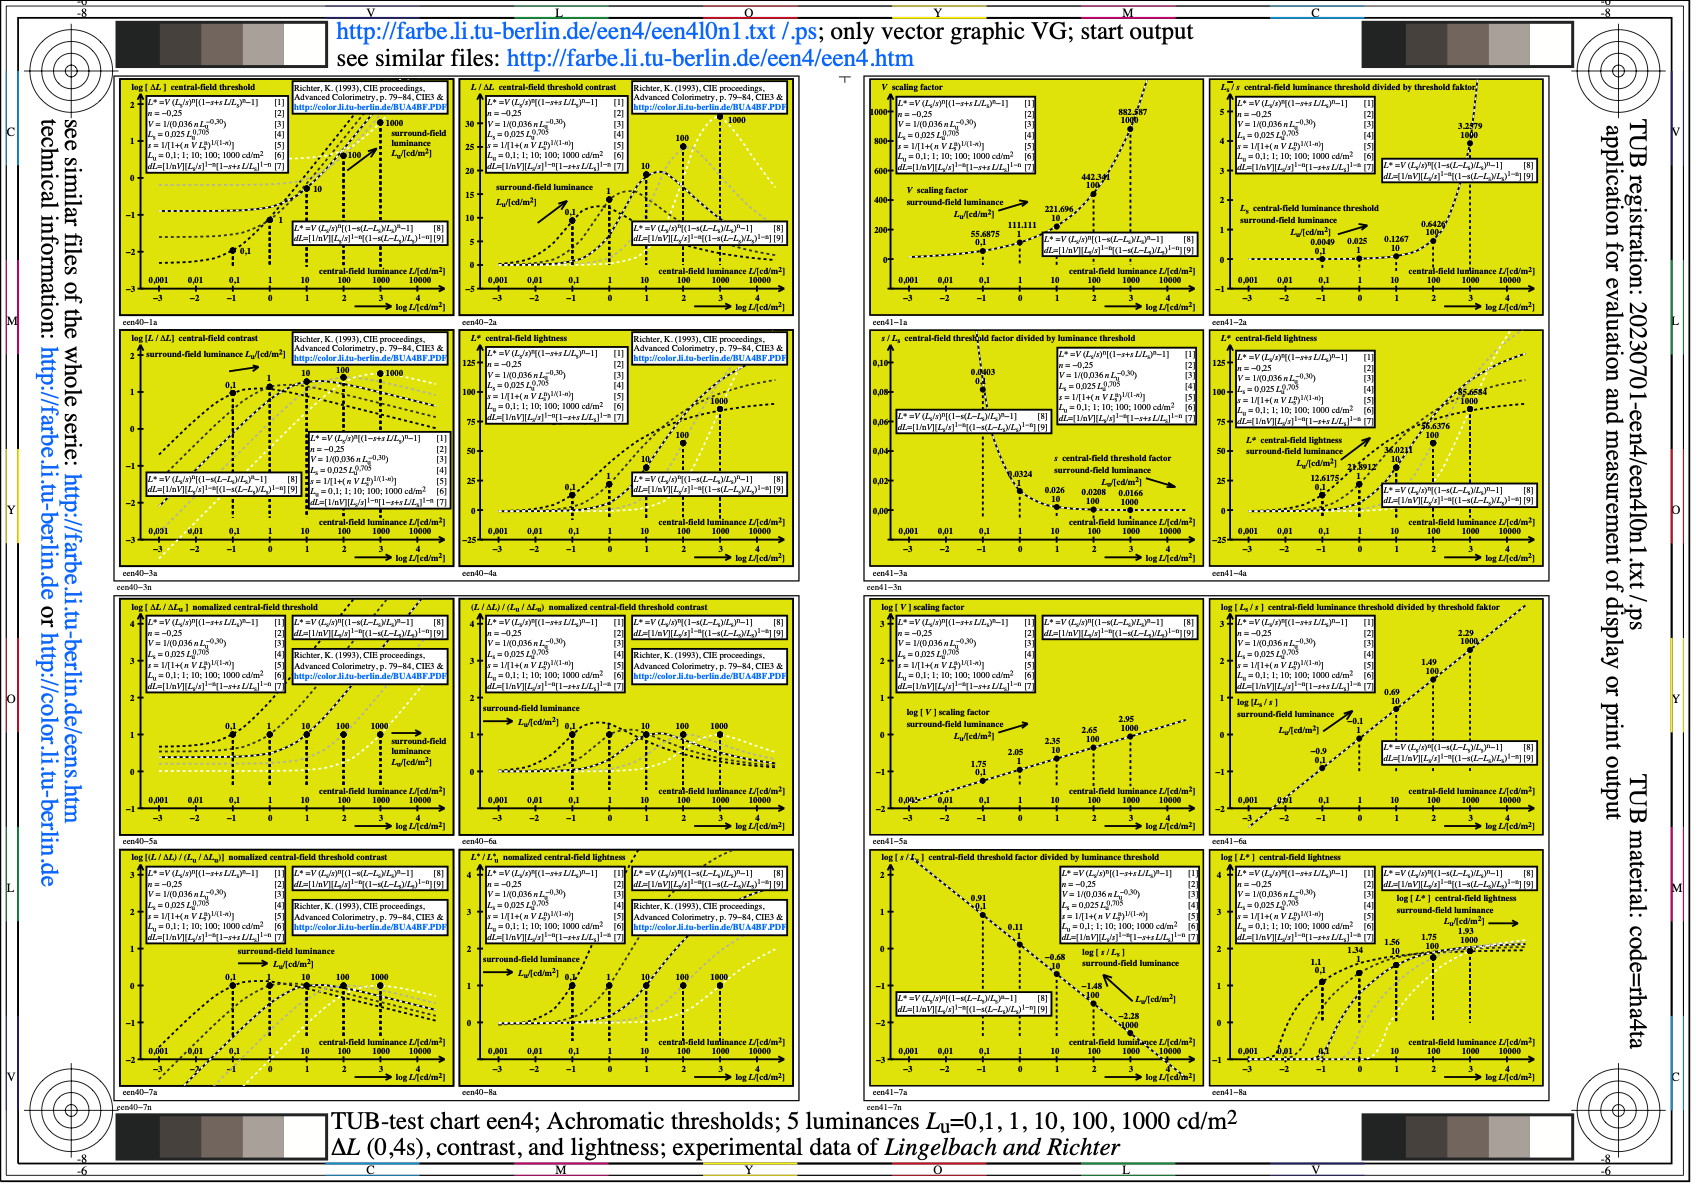
Figure een4l0n1.jpg: Output in format A6 of the file
een4l0np.pdf, see
een4l0n1.
ps /
txt /
pdf /
jpg
een4: TUB-test chart een4; Achromatic thresholds for 5 Lu,
thresholds delta_L (0,4s), contrast and lightness;
experimental data of Lingelbach and Richter

Figure een5l0n1.jpg: Output in format A6 of the file
een5l0np.pdf, see
een5l0n1.
ps /
txt /
pdf /
jpg
een5: TUB-test chart een5; TUBJND model, lightness Fabc, Fabc,r,
receptor responses Fab (R+), Fcb (G-), Fab+Fcb (Y+) (left),
and relative (right) for equal parameters a and b
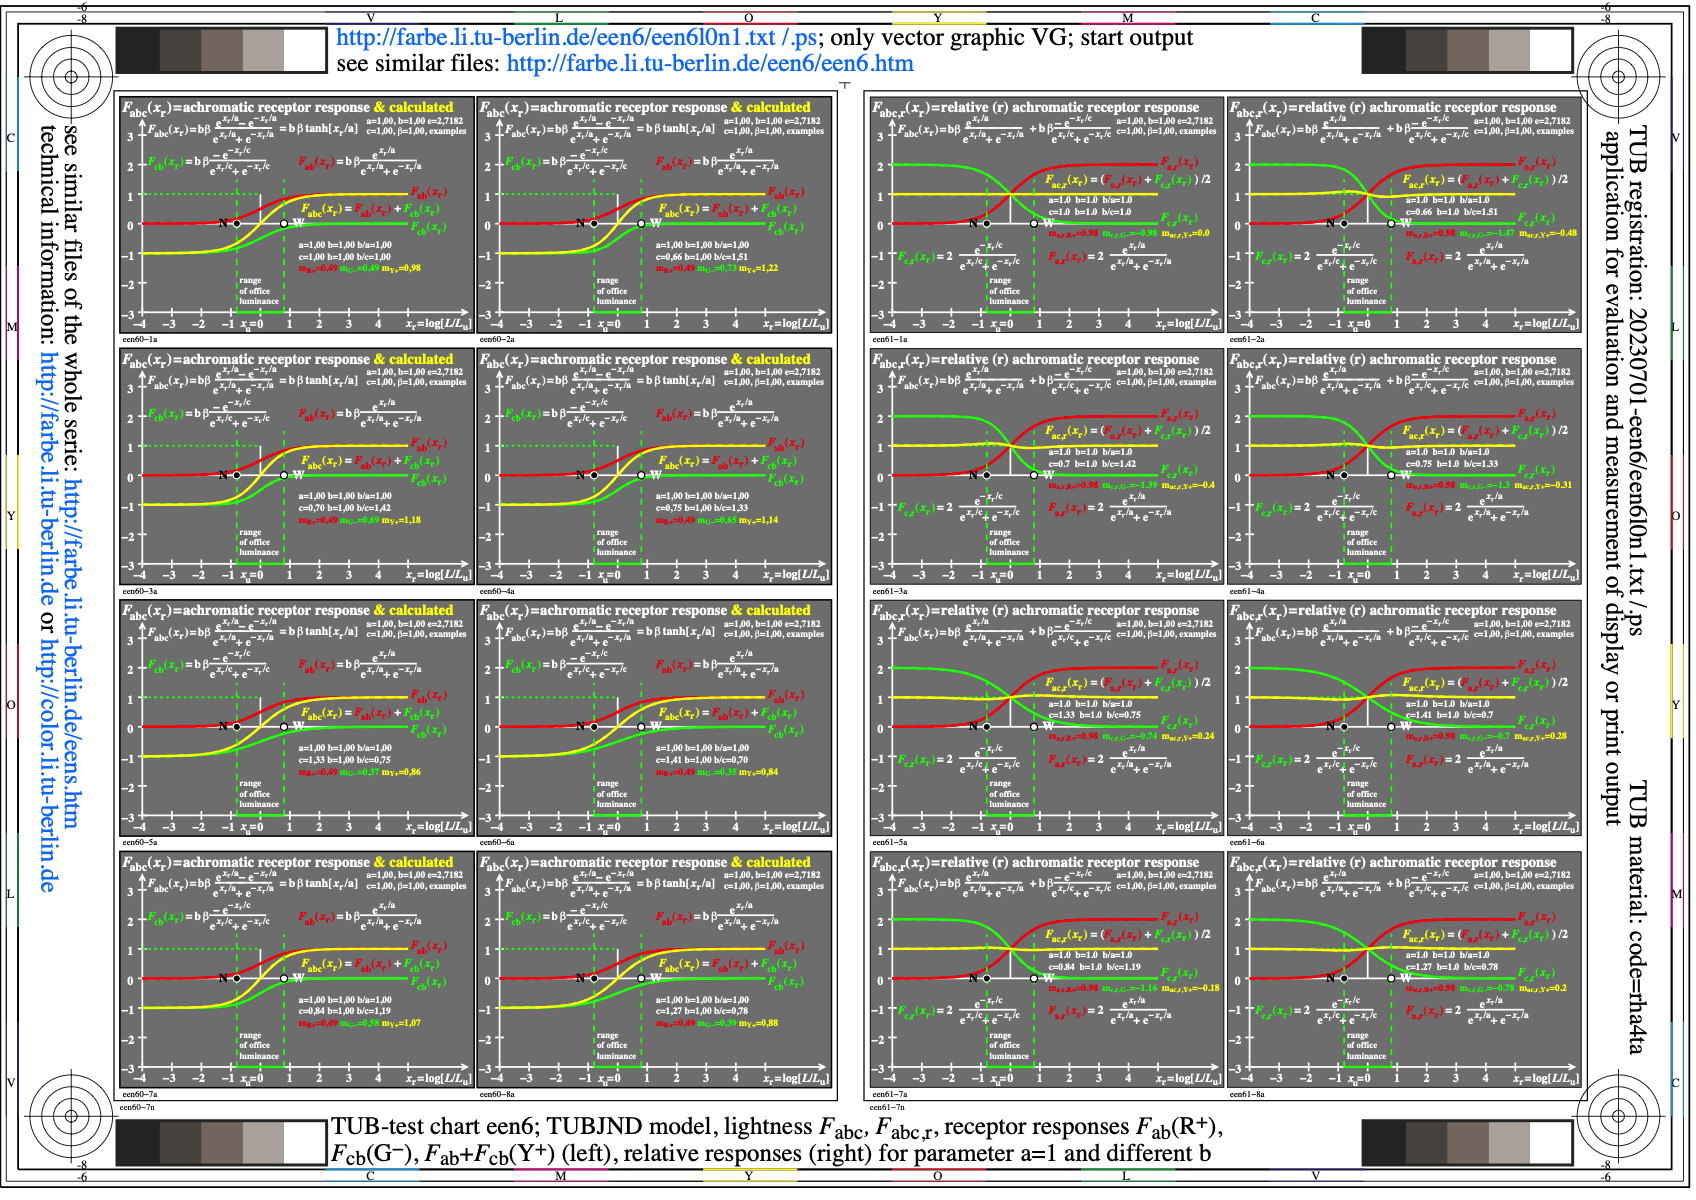
Figure een6l0n1.jpg: Output in format A6 of the file
een6l0np.pdf, see
een6l0n1.
ps /
txt /
pdf /
jpg
een6: TUB-test chart een6; TUBJND model, lightness Fabc, Fabc,r,
receptor responses Fab (R+), Fcb (G-), Fab+Fcb (Y+) (left),
and relative (right) for parameters a=1 and different b
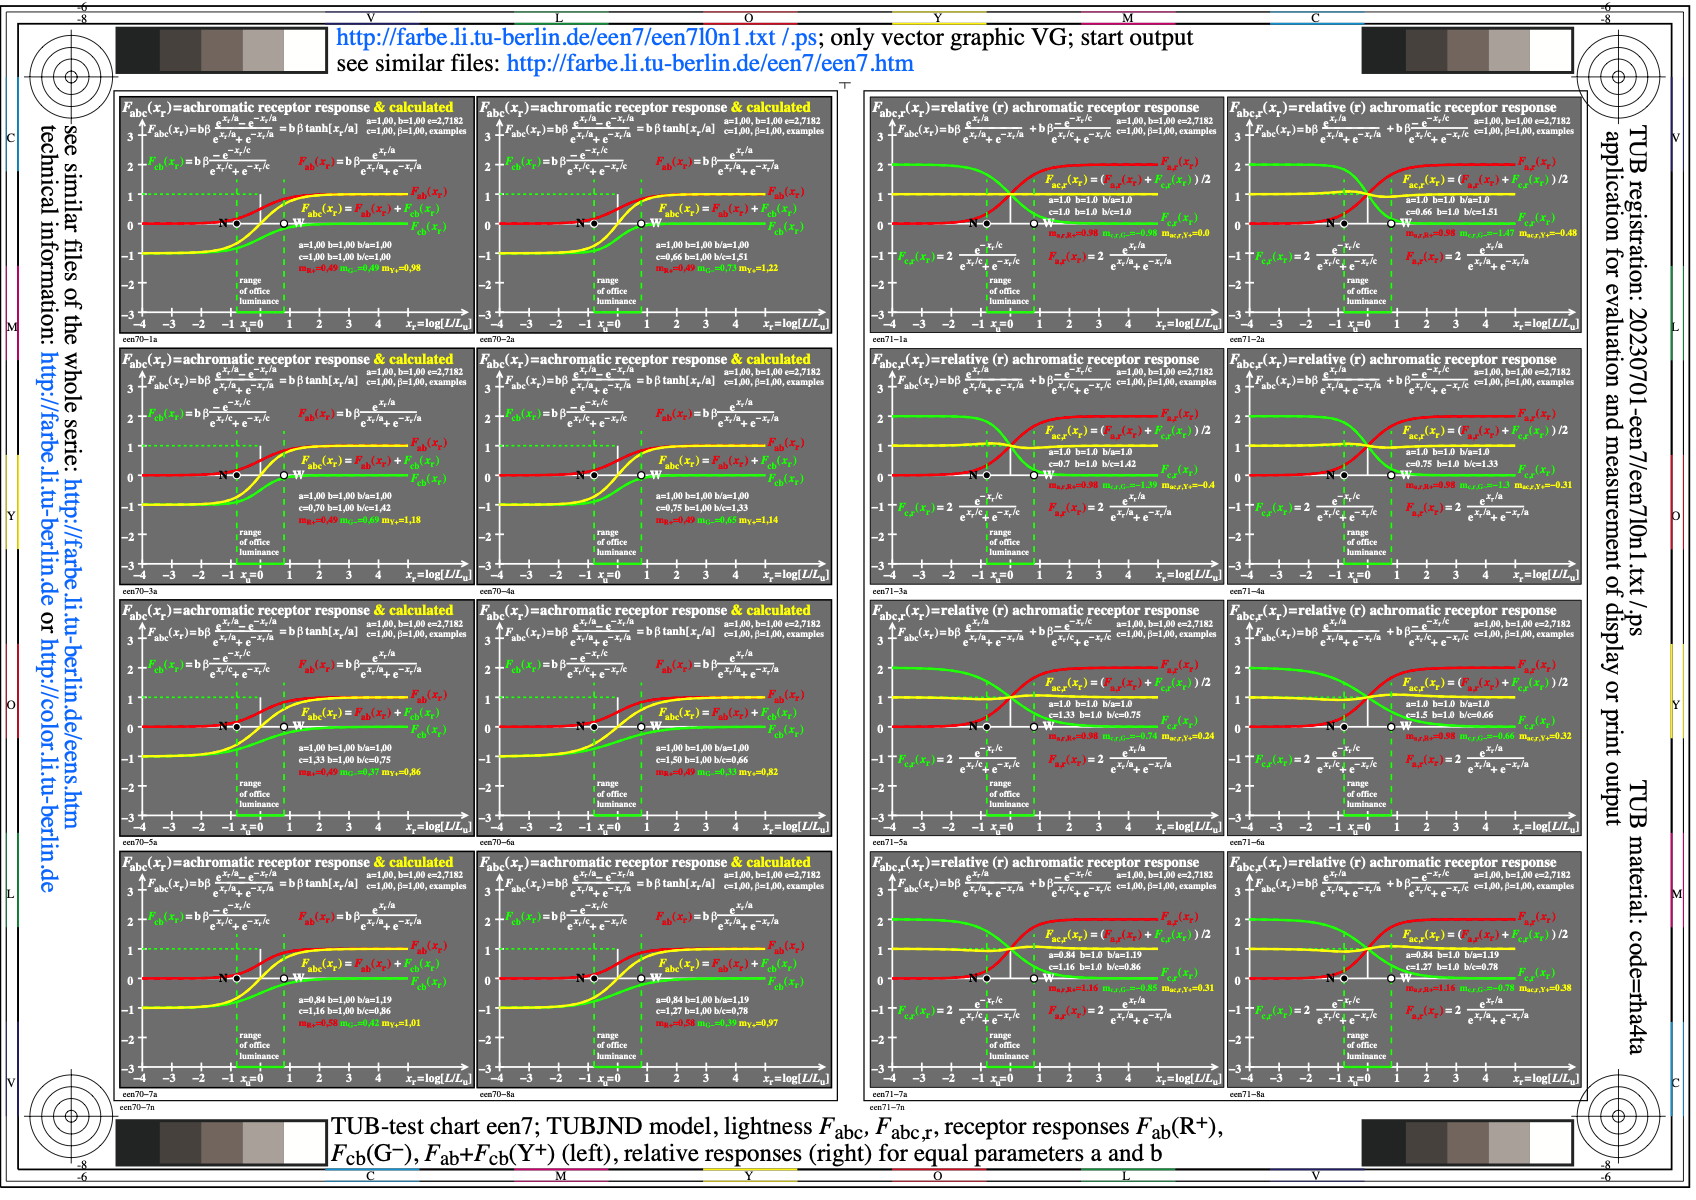
Figure een7l0n1.jpg: Output in format A6 of the file
een7l0np.pdf, see
een7l0n1.
ps /
txt /
pdf /
jpg
een7: TUB-test chart een7; TUBJND model, lightness Fabc, Fabc,r,
receptor responses Fab (R+), Fcb (G-), Fab+Fcb (Y+) (left),
and relative (right) for different parameters a and b
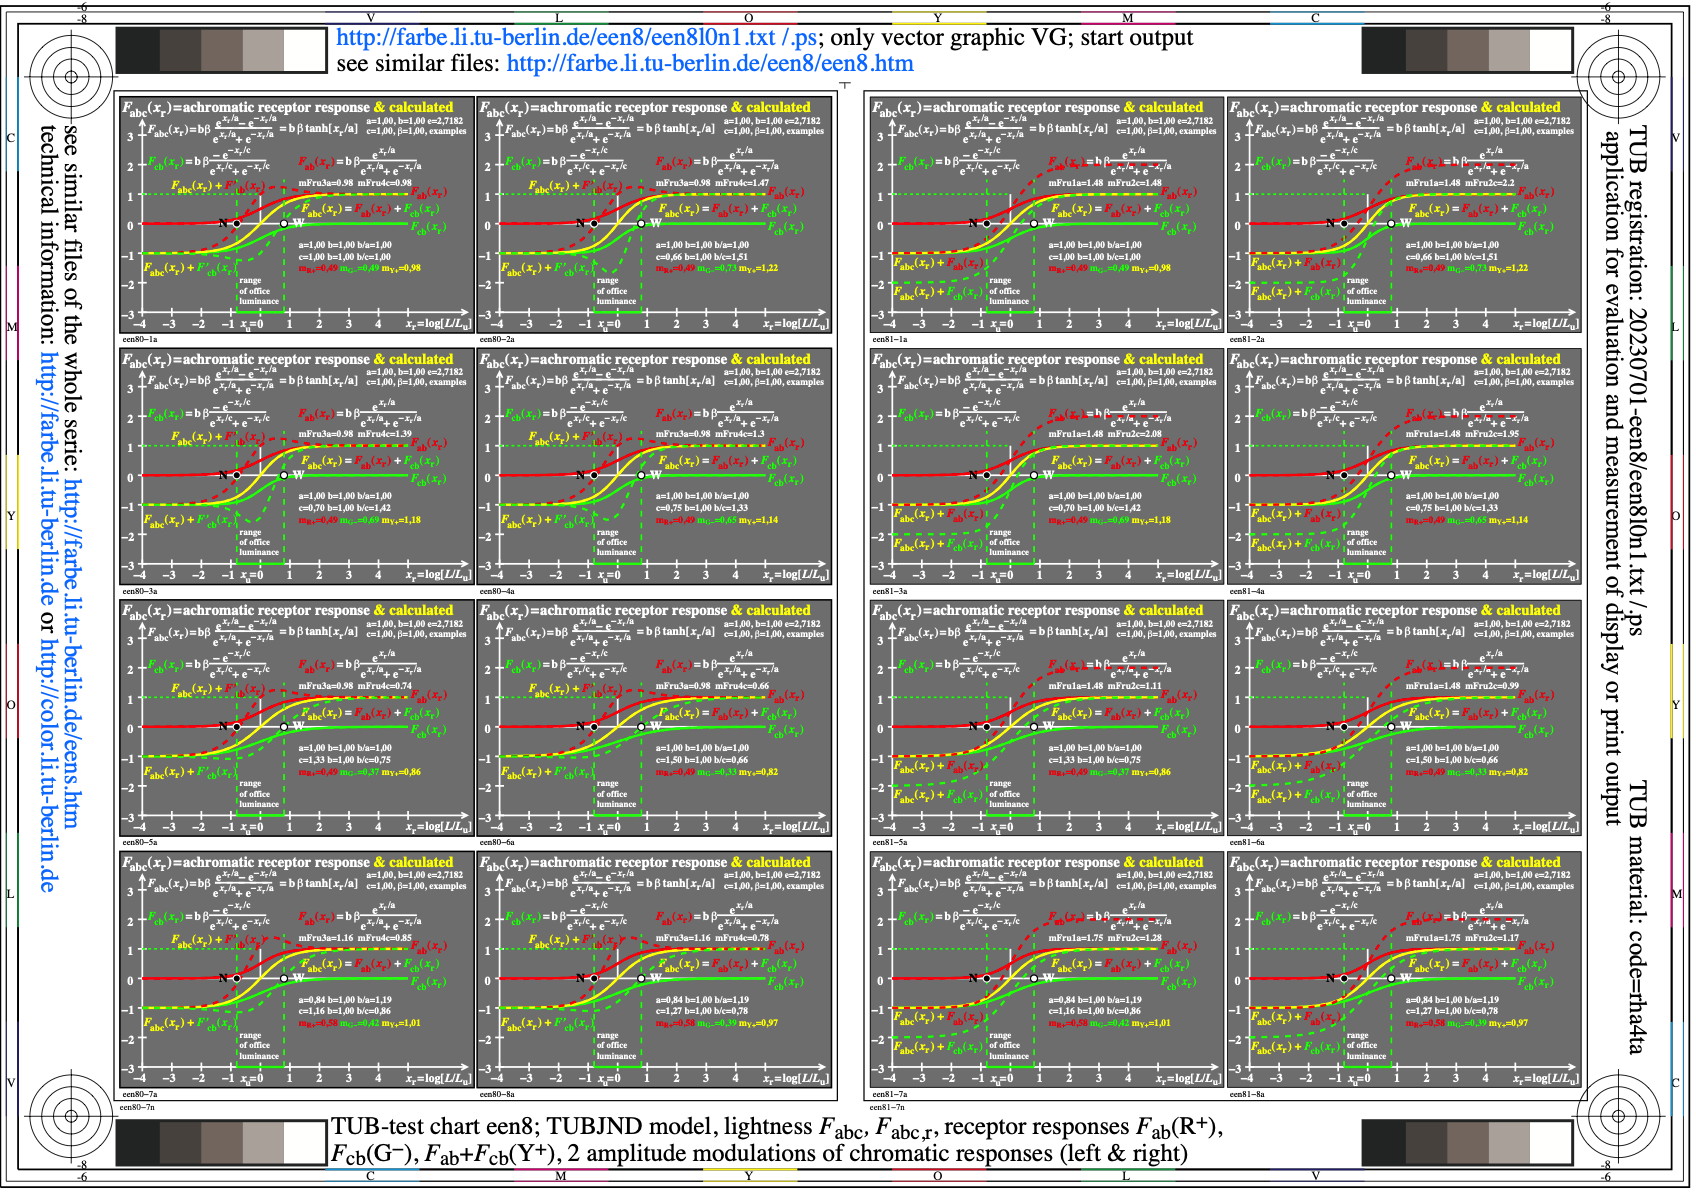
Figure een8l0n1.jpg: Output in format A6 of the file
een8l0np.pdf, see
een8l0n1.
ps /
txt /
pdf /
jpg
een8: TUB-test chart een8; TUBJND model, lightness Fabc, Fabc,r,
receptor responses Fab(R+), Fcb(G-), Fab+Fcb(Y+) (left & right),
2 amplitude modulations of chromatic responses (left & right)
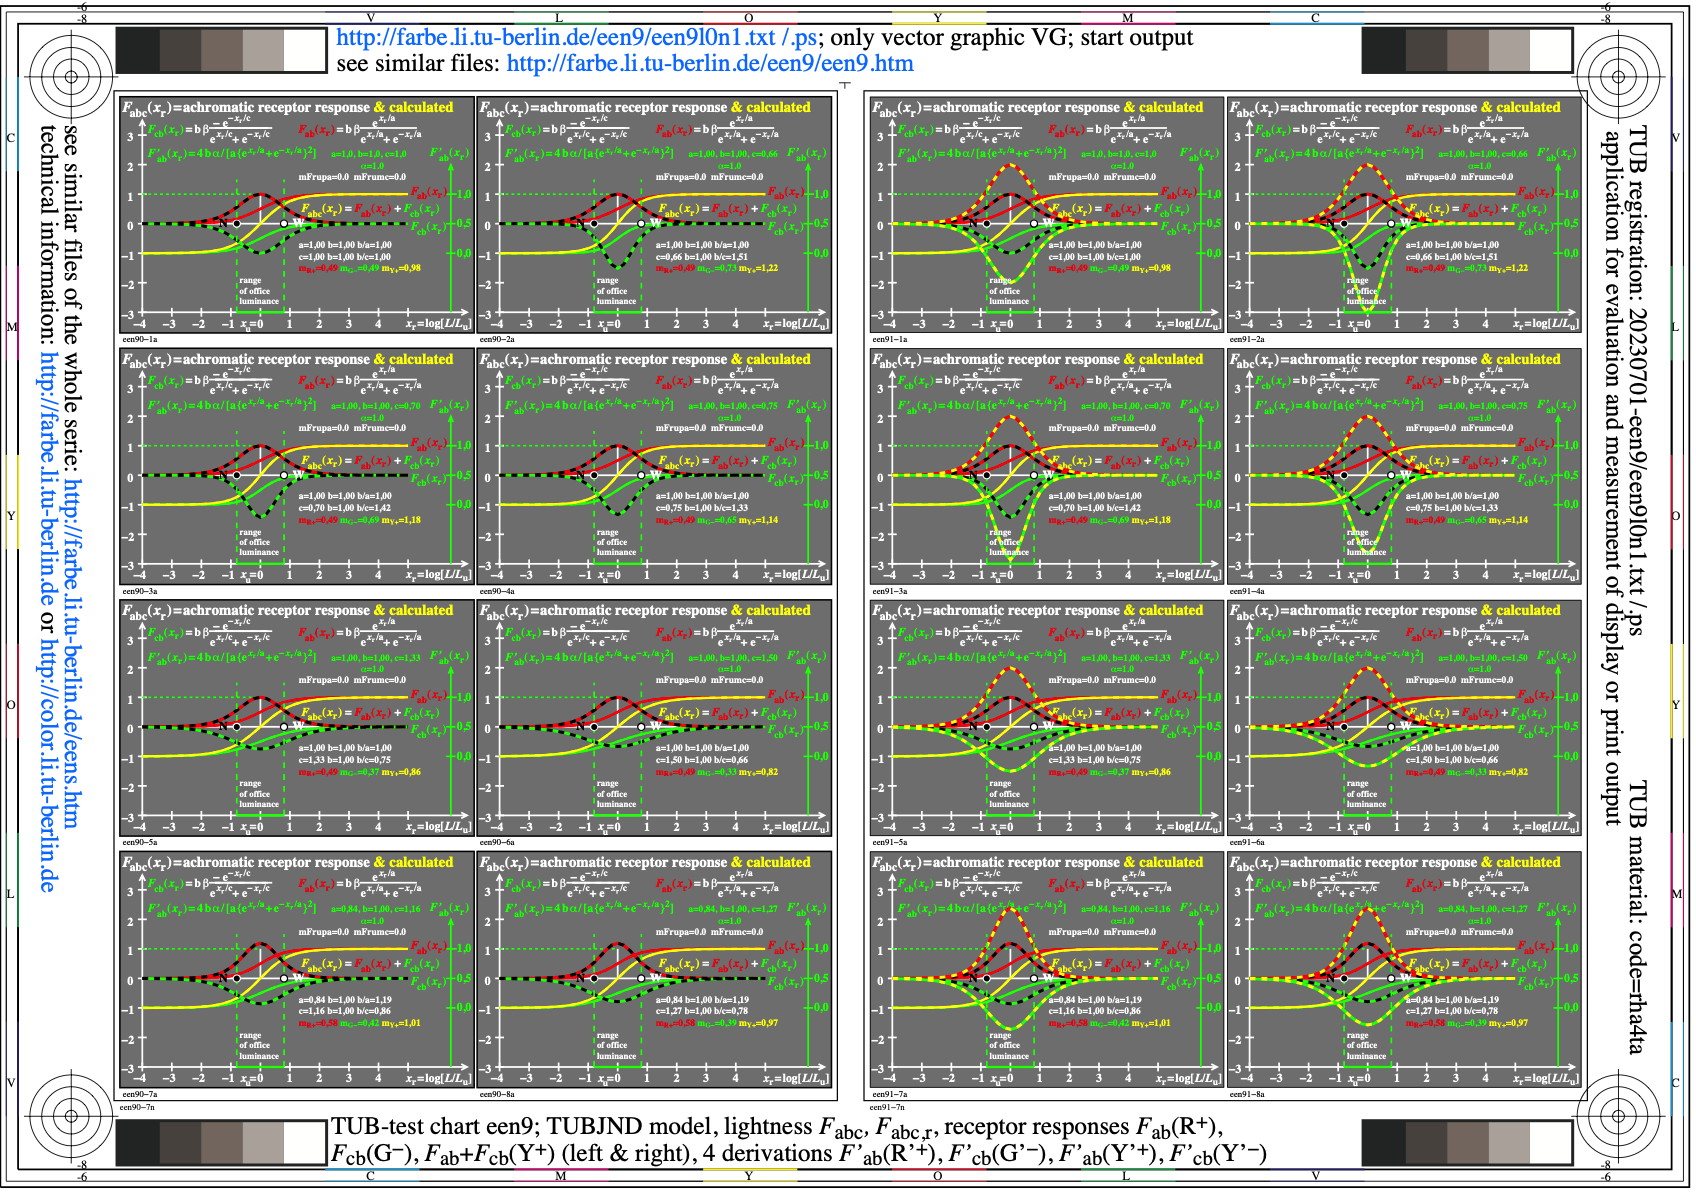
Figure een9l0n1.jpg: Output in format A6 of the file
een9l0np.pdf, see
een9l0n1.
ps /
txt /
pdf /
jpg
een9: TUB-test chart een9; TUBJND model, lightness Fabc, Fabc,r,
receptor responses Fab(R+), Fcb(G-), Fab+Fcb(Y+) (left & right),
4 derivations F'ab (R'+), F'cb (G'-), F'ab (Y'+), F'cb (Y'-)
-------
For the archive information (2000-2009) of the BAM server "www.ps.bam.de"
(2000-2018)
about colour test charts, colorimetric calculations,
standards, and publications, see
indexAE.html in English,
indexAG.html in German.
Back to the main page of this TUB web site (NOT archive), see
index.html in English,
indexDE.html in German.