240605 (hand) 1L2L0X0E_(I), http://farbe.li.tu-berlin.de/BEAI.HTM or
http://color.li.tu-berlin.de/BEAI.HTM
For this main page with general information and special images, see
BEAI in English,
BGAI in German.
Remark: Until today there is no specific text on the following pages:
BETI, BEUI, up to BEZI.
Specific text is on the pages:
BEBI bis BEHI.
For links to the previous chapter A, see
AEAI in English,
AGAI in German.
For links to the next chapter C, see
CEAI in English,
CGAI in German.
For links to the previous chapter A
Colour Image Technology and Colour Management (2019),,
see
Content list of chapter A:
AEA_I in English or
AGA_I in German.
Example image part of 26 parts AEAS to AEZS:
AEAS in English or
AGAS in German.
For links to this chapter B
Colour Vision and Colorimetry (2020),,
see
Content list of chapter B:
BEA_I in English or
BGA_I in German.
Example image part of 26 parts feas to fezs:
BEAS in English or
BGAS in German.
For links to the next chapter C
Colour Spaces, Colour Differences, and Line Elements (2021)),,
see
Content list of chapter D (links and file names use capitel letters)::
CEA_I in English or
CGA_I in German.
Example image part of 26 parts DEAS to DEZS:
CEAS in English or
CGAS in German.
Chapter B: Colour Vision and Colorimetry (2020),
Main part BEAI
1. Introduction and Goals
This part shows colorimetric properties for the CIE-02-degree observer
and antagonistic colours and their reflection.
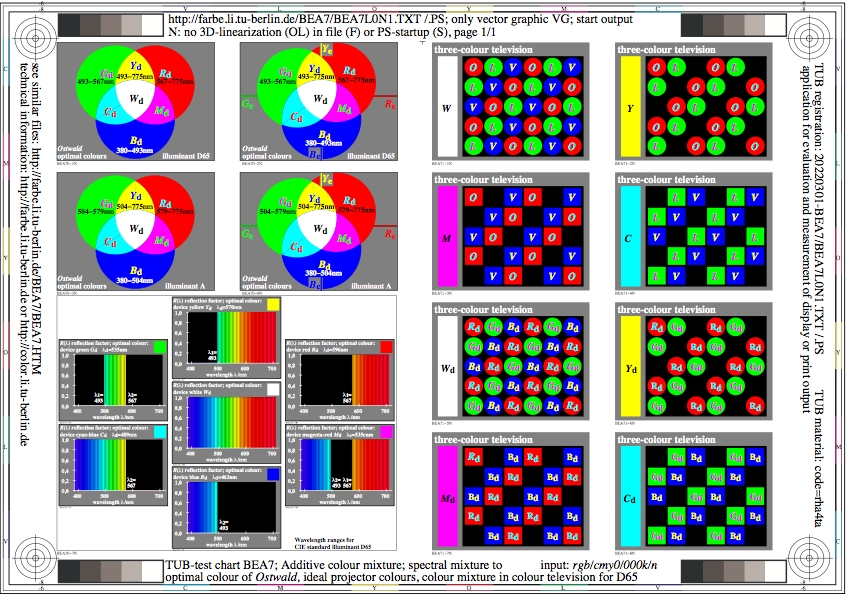
Fig. 1: Output in format A6 of the file
BEA7L0NP.PDF, see
BEA7L0N1.
PS /
TXT /
PDF /
jpg
BEA7:
Colour mixture of three to six basic colours
(RYGCBM)d and white Wd,
additive colour mixture of Ostwald-optimal colours,
additive colour mixture with displays in colour television
and in colour image technology.
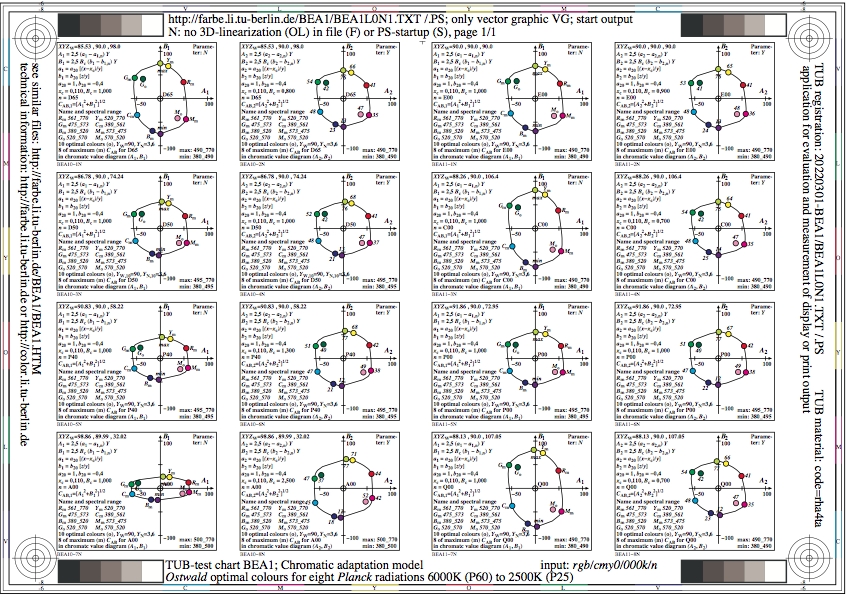
Fig. 2: Output in format A6 of the file
BEA1L0NP.PDF, see
BEA1L0N1.
PS /
TXT /
PDF /
jpg
BEA1:
Visual chromatic adaptation model;
change from (A1, B1) to (A2, B2),
Application of Ostwald-optimal colours
for 8 Planck radiation,
8 correlated colour temperatures between 6000K (P60) and 2500K (P25).

Fig. 3: Output in format A6 of the file
BEA5L0NP.PDF, see
BEA5L0N1.
PS /
TXT /
PDF /
jpg
BEA5:
Variable central field luminances L
and 5 surround field luminances Lu,
Luminance thresholds delta L, contrast threshold
C=L/(delta L), and lightness L*,
experimental data of Lingelbach and Richter,
see conference proceedings Licht II (1986), p. 217-225.
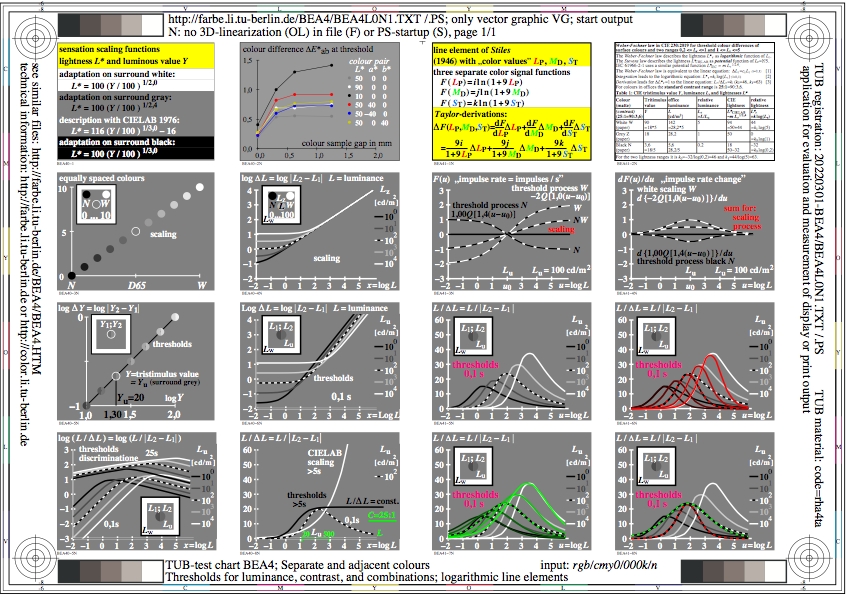
Fig. 4: Output in format A6 of the file
BEA4L0NP.PDF, see
BEA4L0N1.
PS /
TXT /
PDF /
jpg
BEA4:
Thresholds of separated and adjacent colours,
Thresholds of luminance delta L and contrast C=L/(delta L),
Line elements for colur, luminance and contrast.
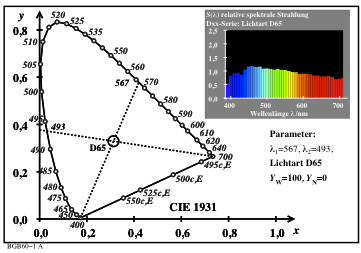
Fig. 5: Wavelength ranges of
Ostwald-optimal colours for CIE standard illuminant D65.
For the down;load of this figure in the VG-PDF format, see
BGB61-1A.PDF.
The spectral radiation for the CIE standard illuminant D65 and the
wavelength ranges of the colour pairs R-C and Y-B
are shown in the CIE chromaticity diagram (x, y).
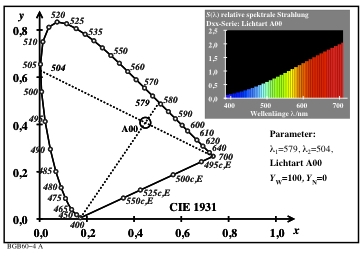
Fig. 6: Fig. 5: Wavelength ranges of
Ostwald-optimal colours for CIE standard illuminant A.
For the down;load of this figure in the VG-PDF format, see
BGB61-4A.PDF.
The spectral radiation for the CIE standard illuminant A and the
wavelength ranges of the colour pairs R-C and Y-B
are shown in the CIE chromaticity diagram (x, y).
-------
For the archive information (2000-2009) of the BAM server "www.ps.bam.de"
(2000-2018)
about colour test charts, colorimetric calculations,
standards, and publications, see
indexAE.html in English,
indexAG.html in German.
Back to the main page of this TUB web site (NOT archive), see
index.html in English,
indexDE.html in German.