Figure eer0l0n1.jpg: Output in format A6 of the file eer0l0np.pdf, see
eer0l0n1. ps / txt / pdf / jpg
240215 1L2L0X0F_K2710.KTS/YErlEIN.KTS, http://farbe.li.tu-berlin.de/eers.htm or http://color.li.tu-berlin.de/eers.htm
For links to the
Section 2, Chapter E
Colour Metrics, Differences, and Appearance (2023),
see
For this image page with 10 colour series, see
eers in English,
egrs in German.
For the previous image page, see
eeqs in English,
egqs in German.
For the next image page, see
eess in English,
egss in German.
For the first image page of the previous chapter D, see
DEAS in English,
DGAS in German.
For the first image page of the next chapter F (under work), see
feas in English,
fgas in German.
Content list of chapter E:
eea_i in English or
ega_i in German.
Summary of chapter E:
eea_s in English or
ega_s in German.
For the large image page of chapter E with 260 colour series, see
ee2s in English or
eg2s in German.
Section 2, Chapter E
Colour Metrics, Differences, and Appearance (2023),
Image part eers
The following ten pages eer0 to eer9 of this chapter
show the content with links to the single figures
in up to six formats.
Figure eer0l0n1.jpg: Output in format A6 of the file
eer0l0np.pdf, see
eer0l0n1.
ps /
txt /
pdf /
jpg
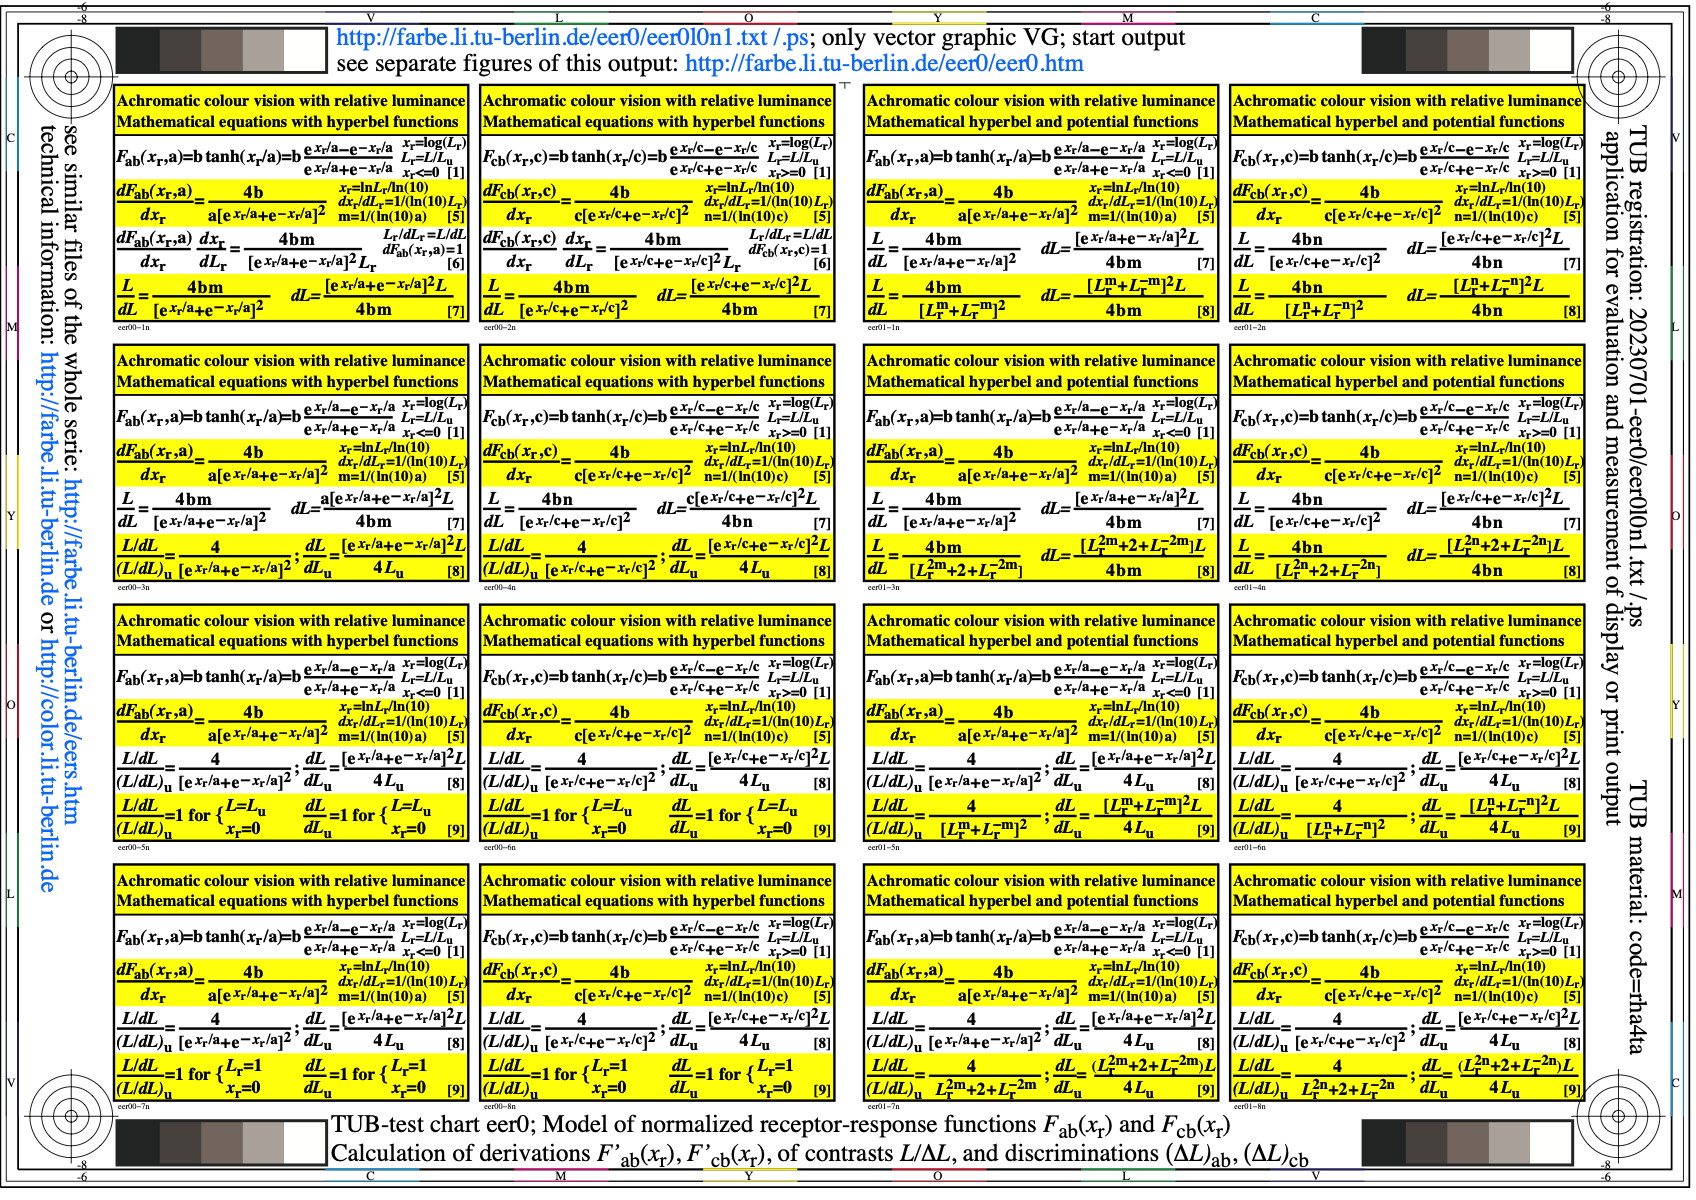
eer0: TUB-test chart eer0; Q/Fab(xr)-models for visual responses
Q/Fab(xr) with hyperbel functions e^(xr/a) and 10^(xr/a')
with contants a'=a ln(10) and a^n = a^1,0
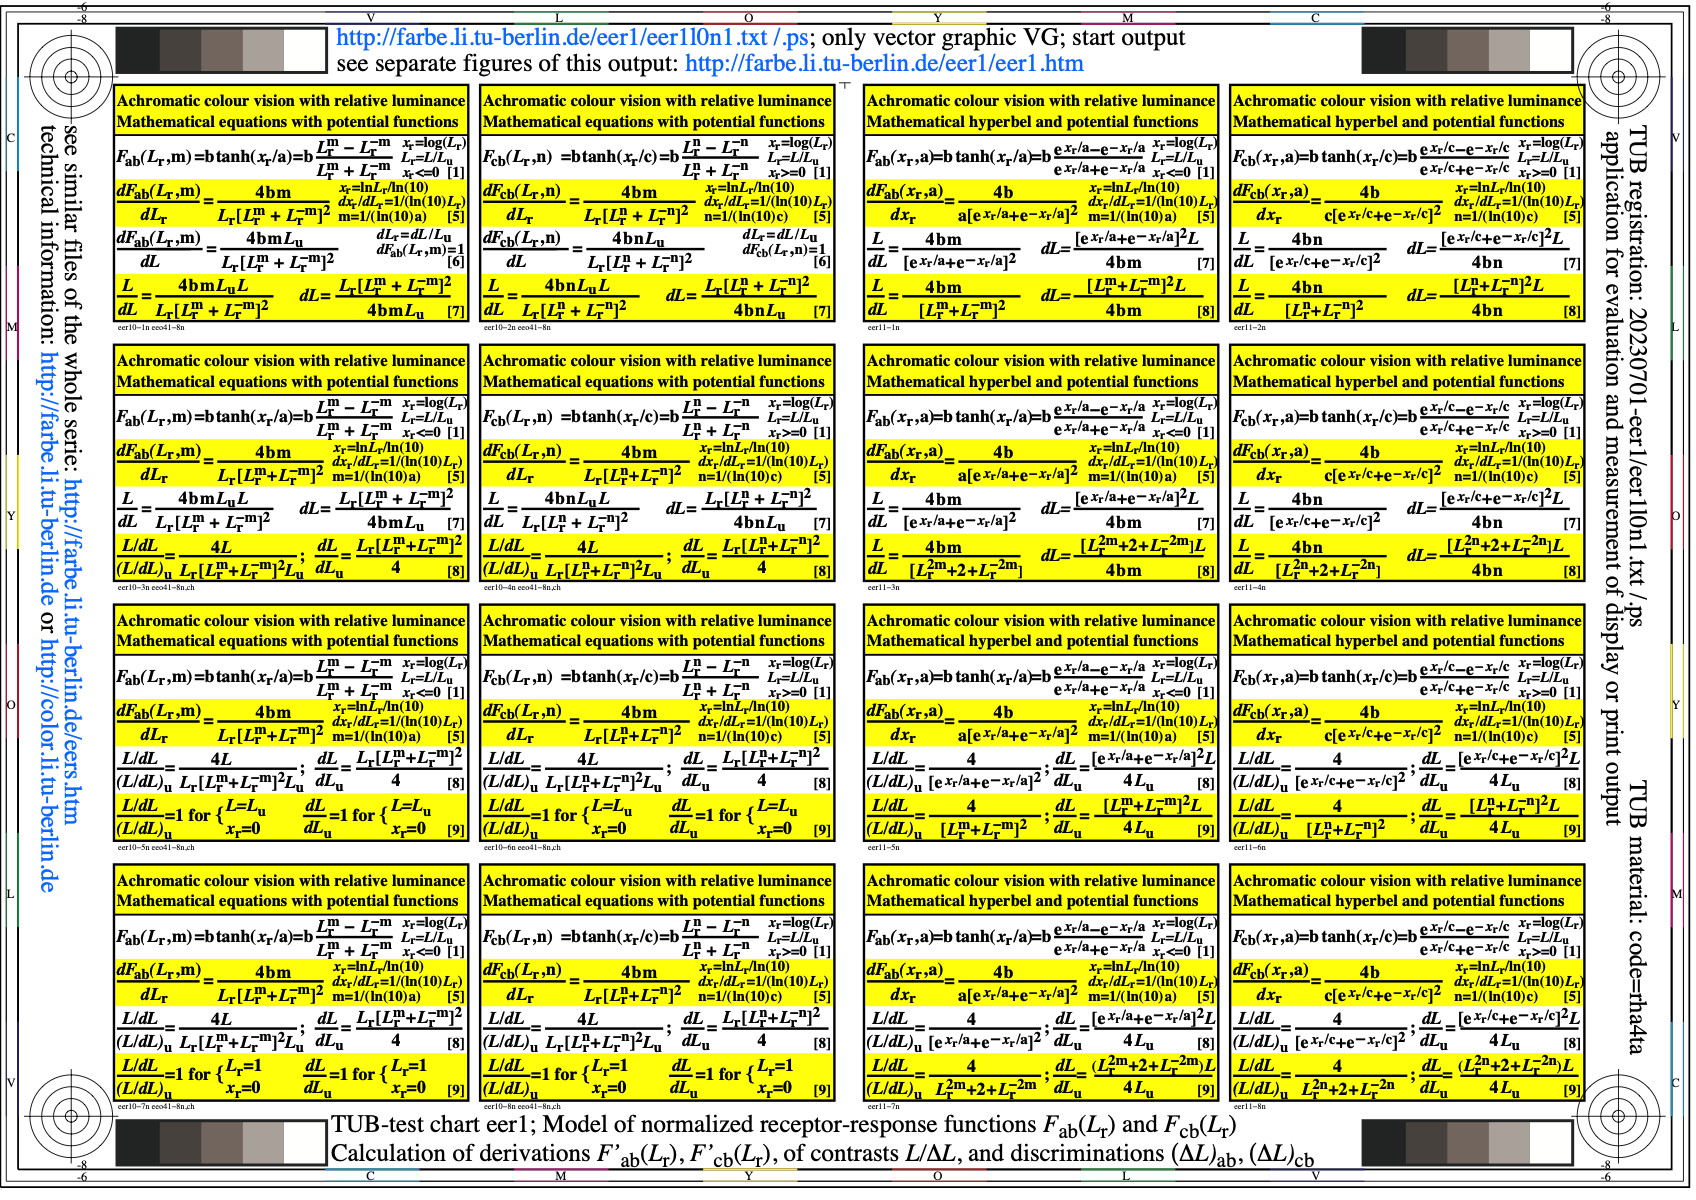
Figure eer1l0n1.jpg: Output in format A6 of the file
eer1l0np.pdf, see
eer1l0n1.
ps /
txt /
pdf /
jpg
eer1: TUB-test chart eer1; Fab(xr)-model for visual responses
Application of hyperbel function tanh on receptor responses
Presentation of the functions and derivation for discrimination
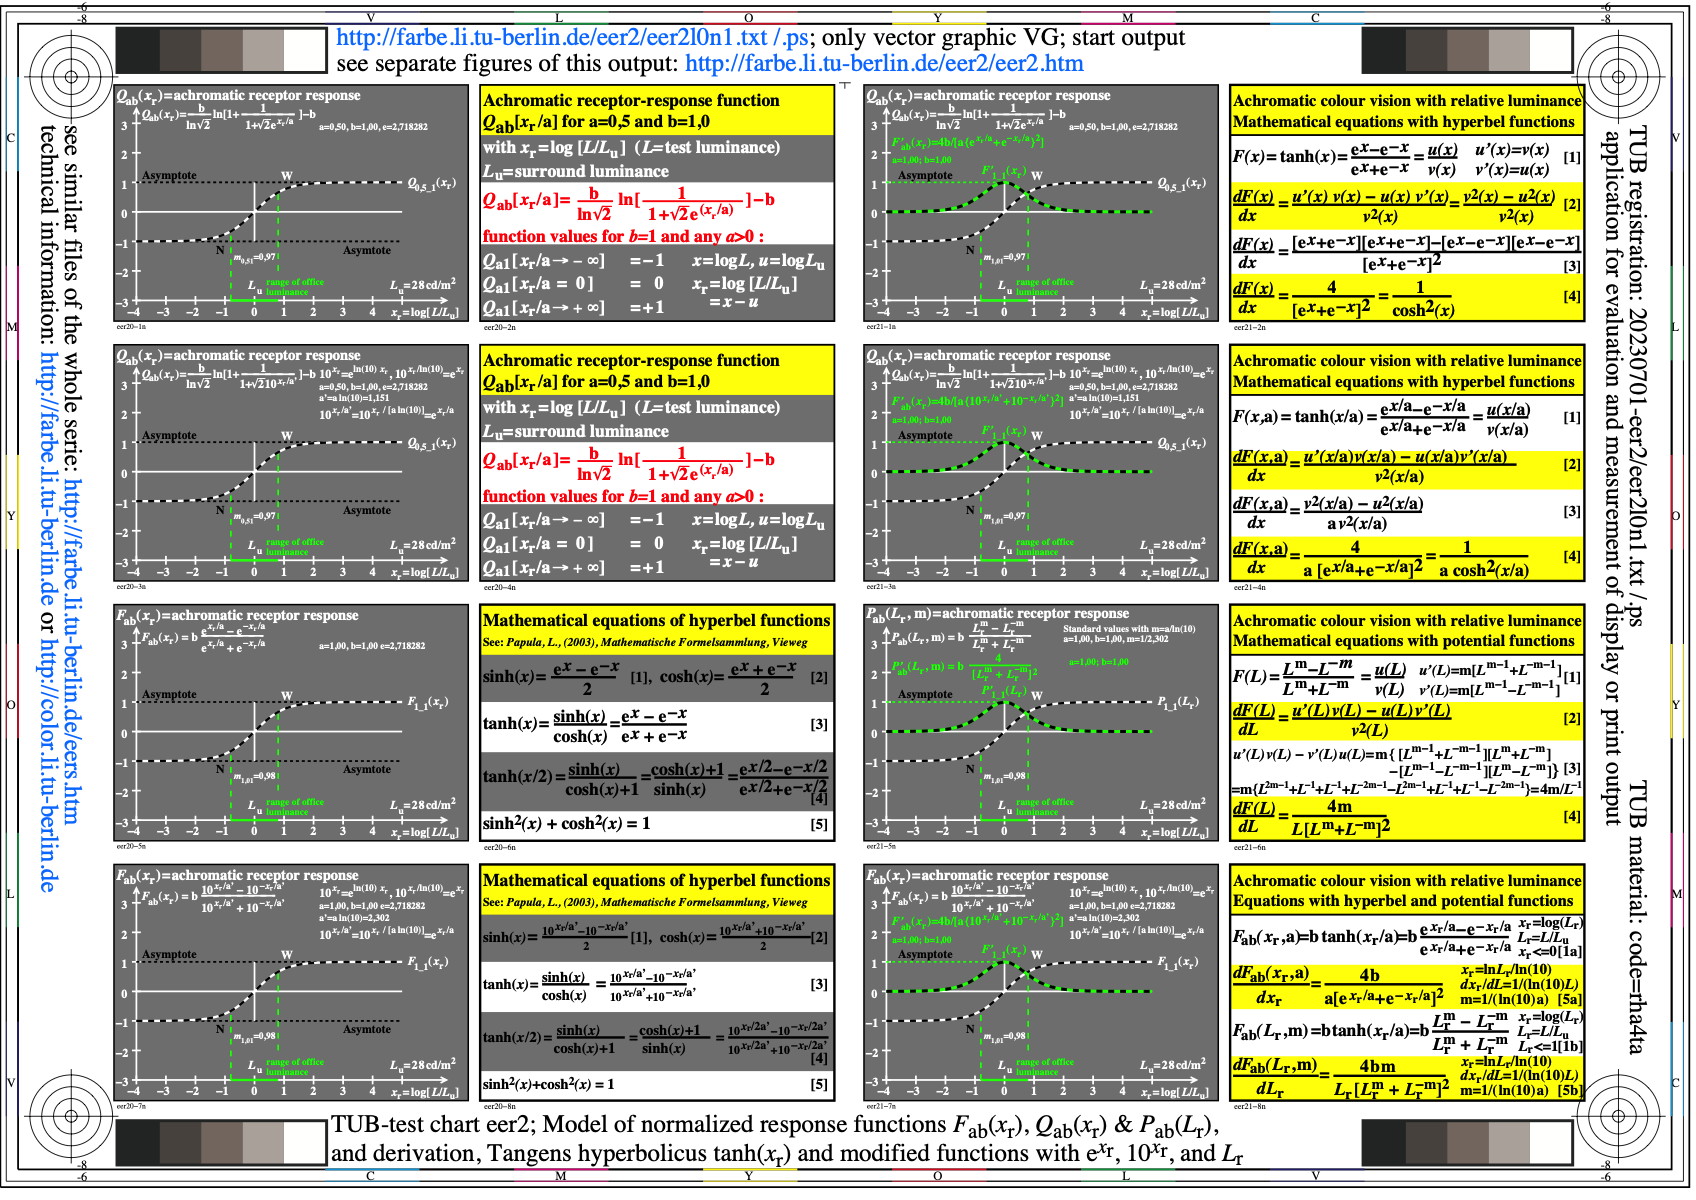
Figure eer2l0n1.jpg: Output in format A6 of the file
eer2l0np.pdf, see
eer2l0n1.
ps /
txt /
pdf /
jpg
eer2: TUB-test chart eer2; Q/Fab(xr)-models for visual responses
Q/Fab(xr) with hyperbel functions e^(xr/a) and 10^(xr/a')
with contants a'=a ln(10) and a^n = a^1,0
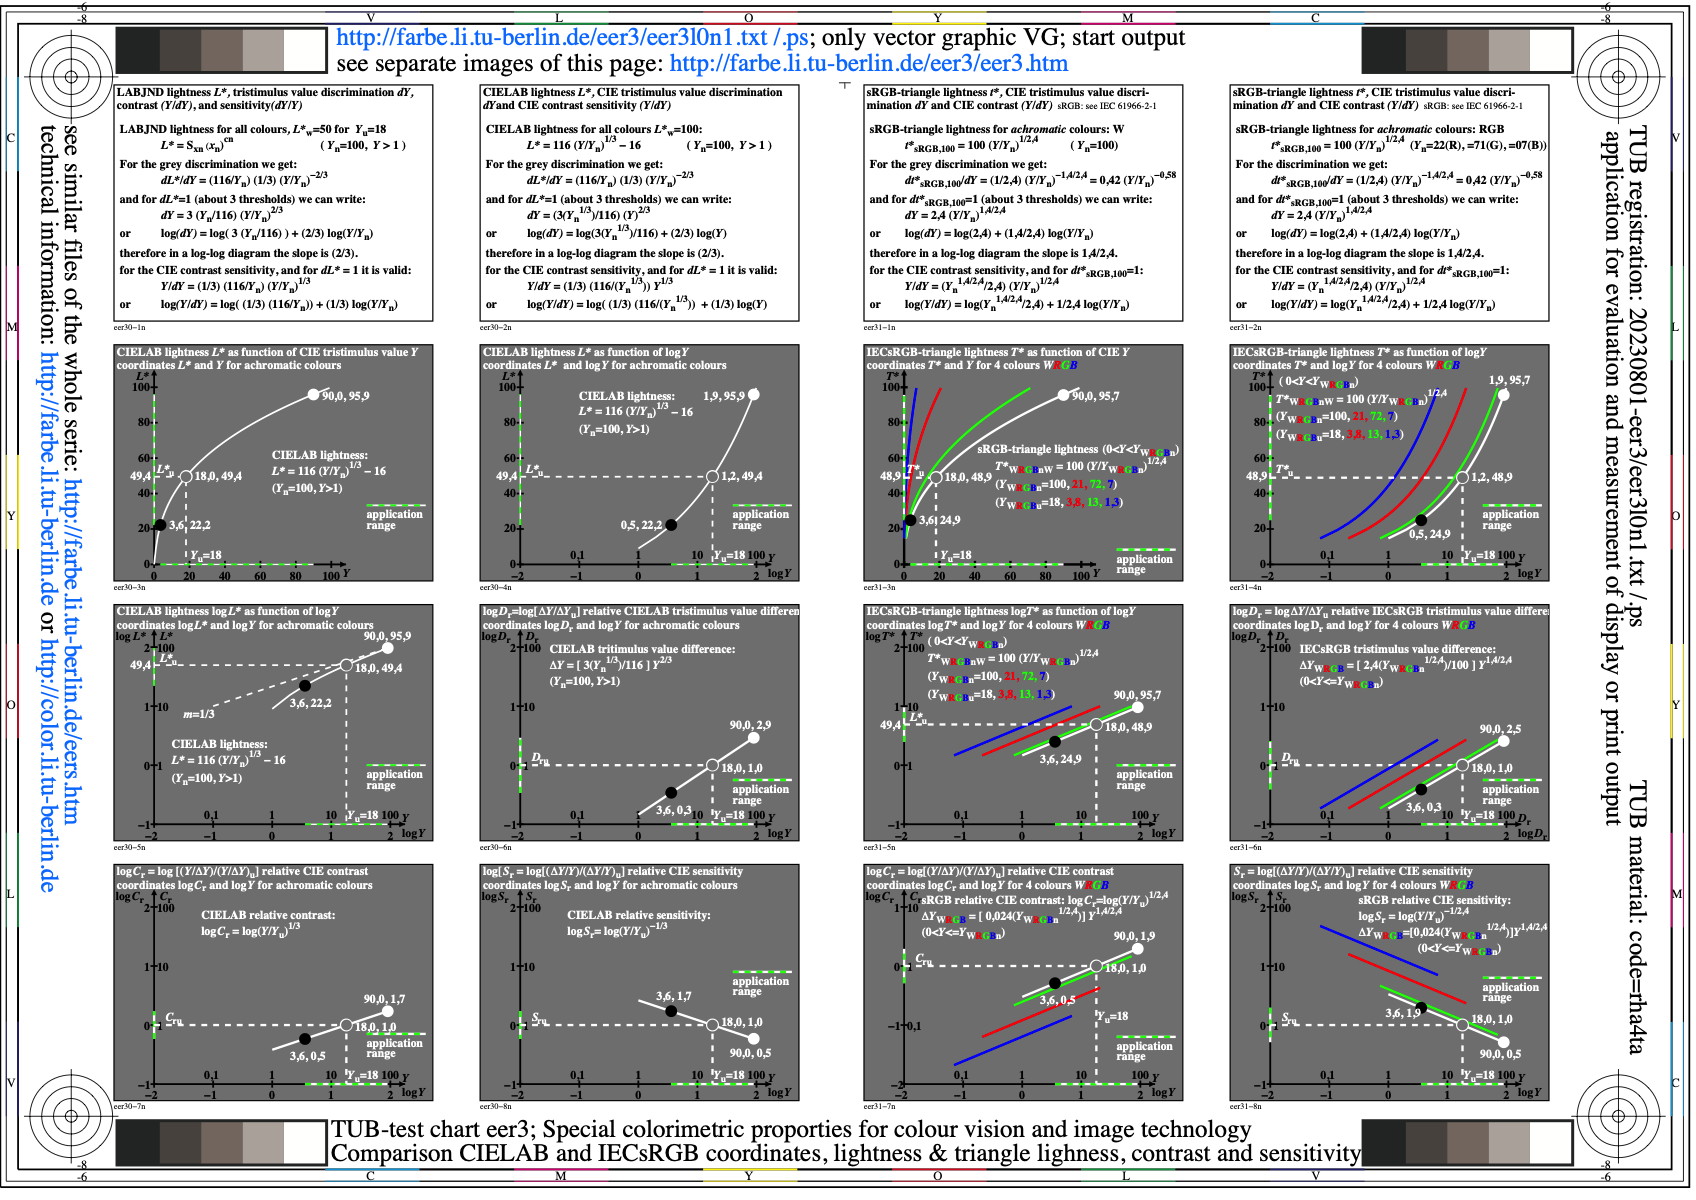
Figure eer3l0n1.jpg: Output in format A6 of the file
eer3l0np.pdf, see
eer3l0n1.
ps /
txt /
pdf /
jpg
eer3: TUB-test chart eer3; Under development

Figure eer4l0n1.jpg: Output in format A6 of the file
eer4l0np.pdf, see
eer4l0n1.
ps /
txt /
pdf /
jpg
eer4: TUB-test chart eer4; Under development
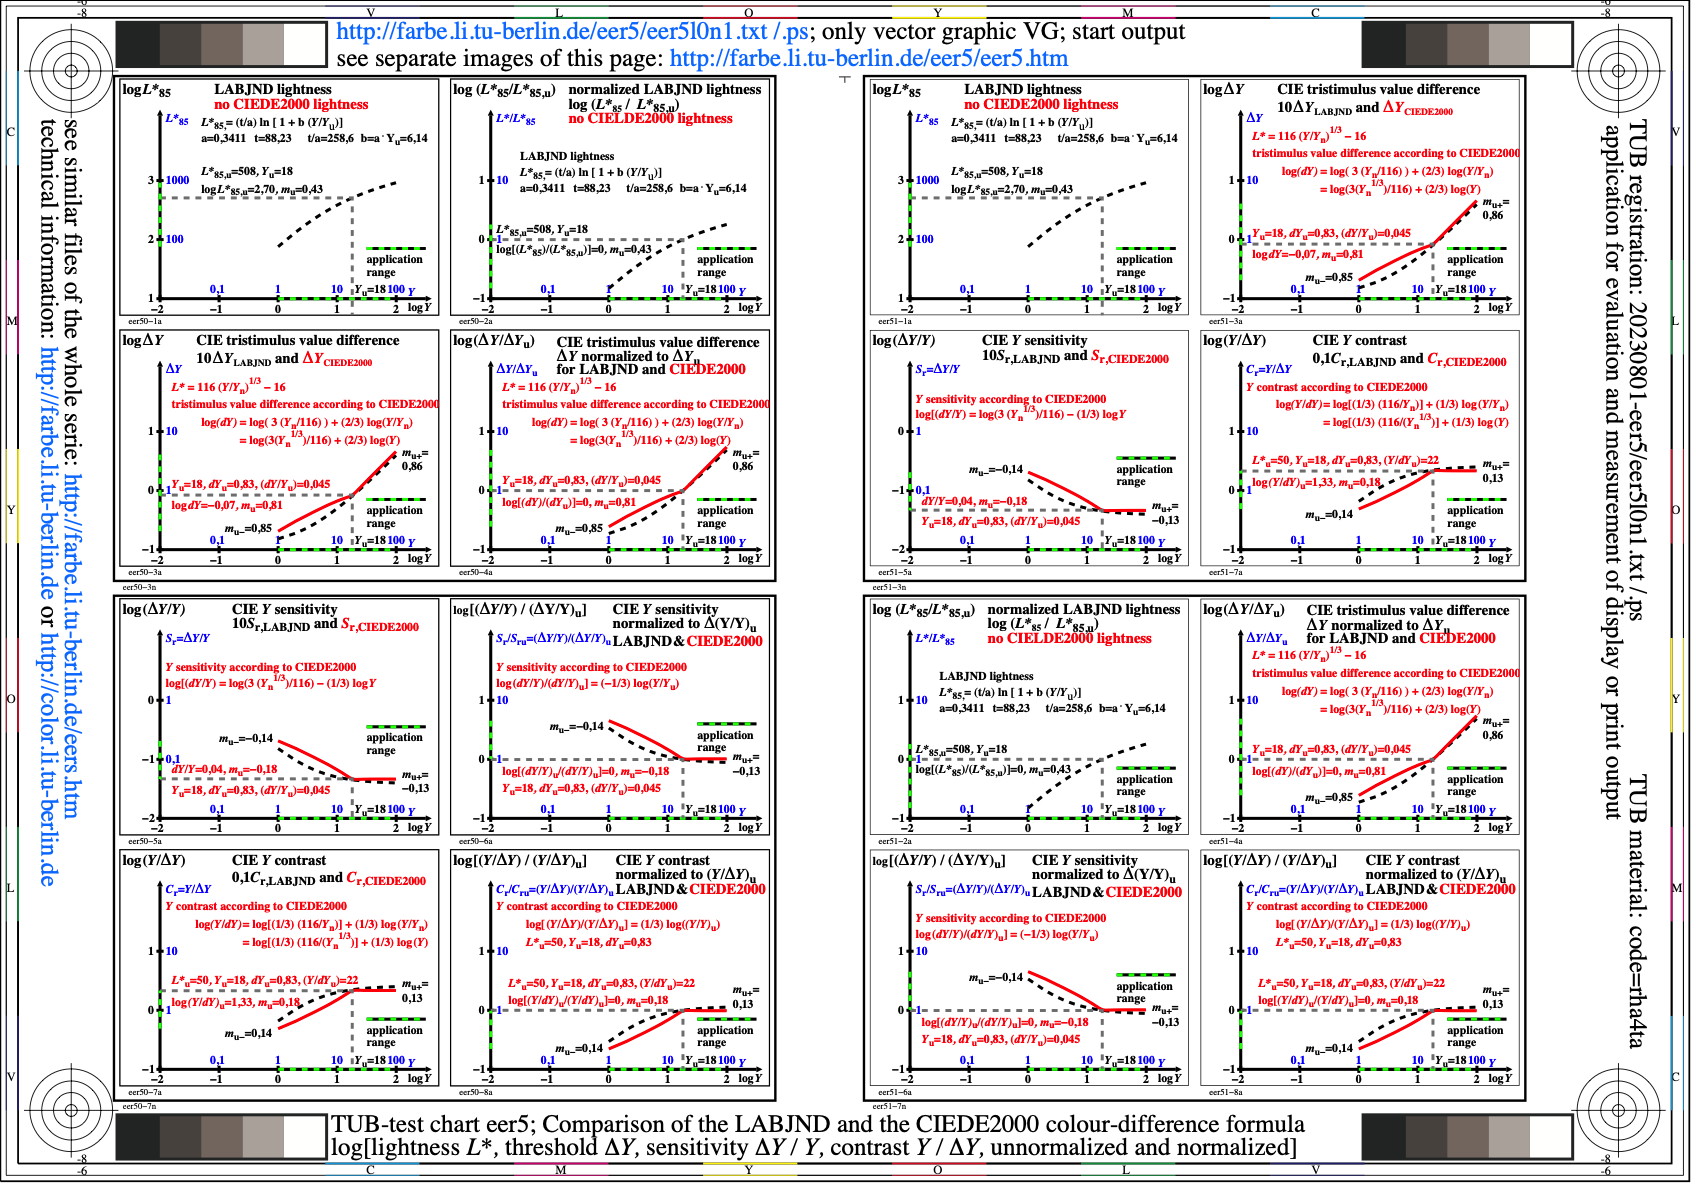
Figure eer5l0n1.jpg: Output in format A6 of the file
eer5l0np.pdf, see
eer5l0n1.
ps /
txt /
pdf /
jpg
eer5: TUB-test chart eer5; Under development
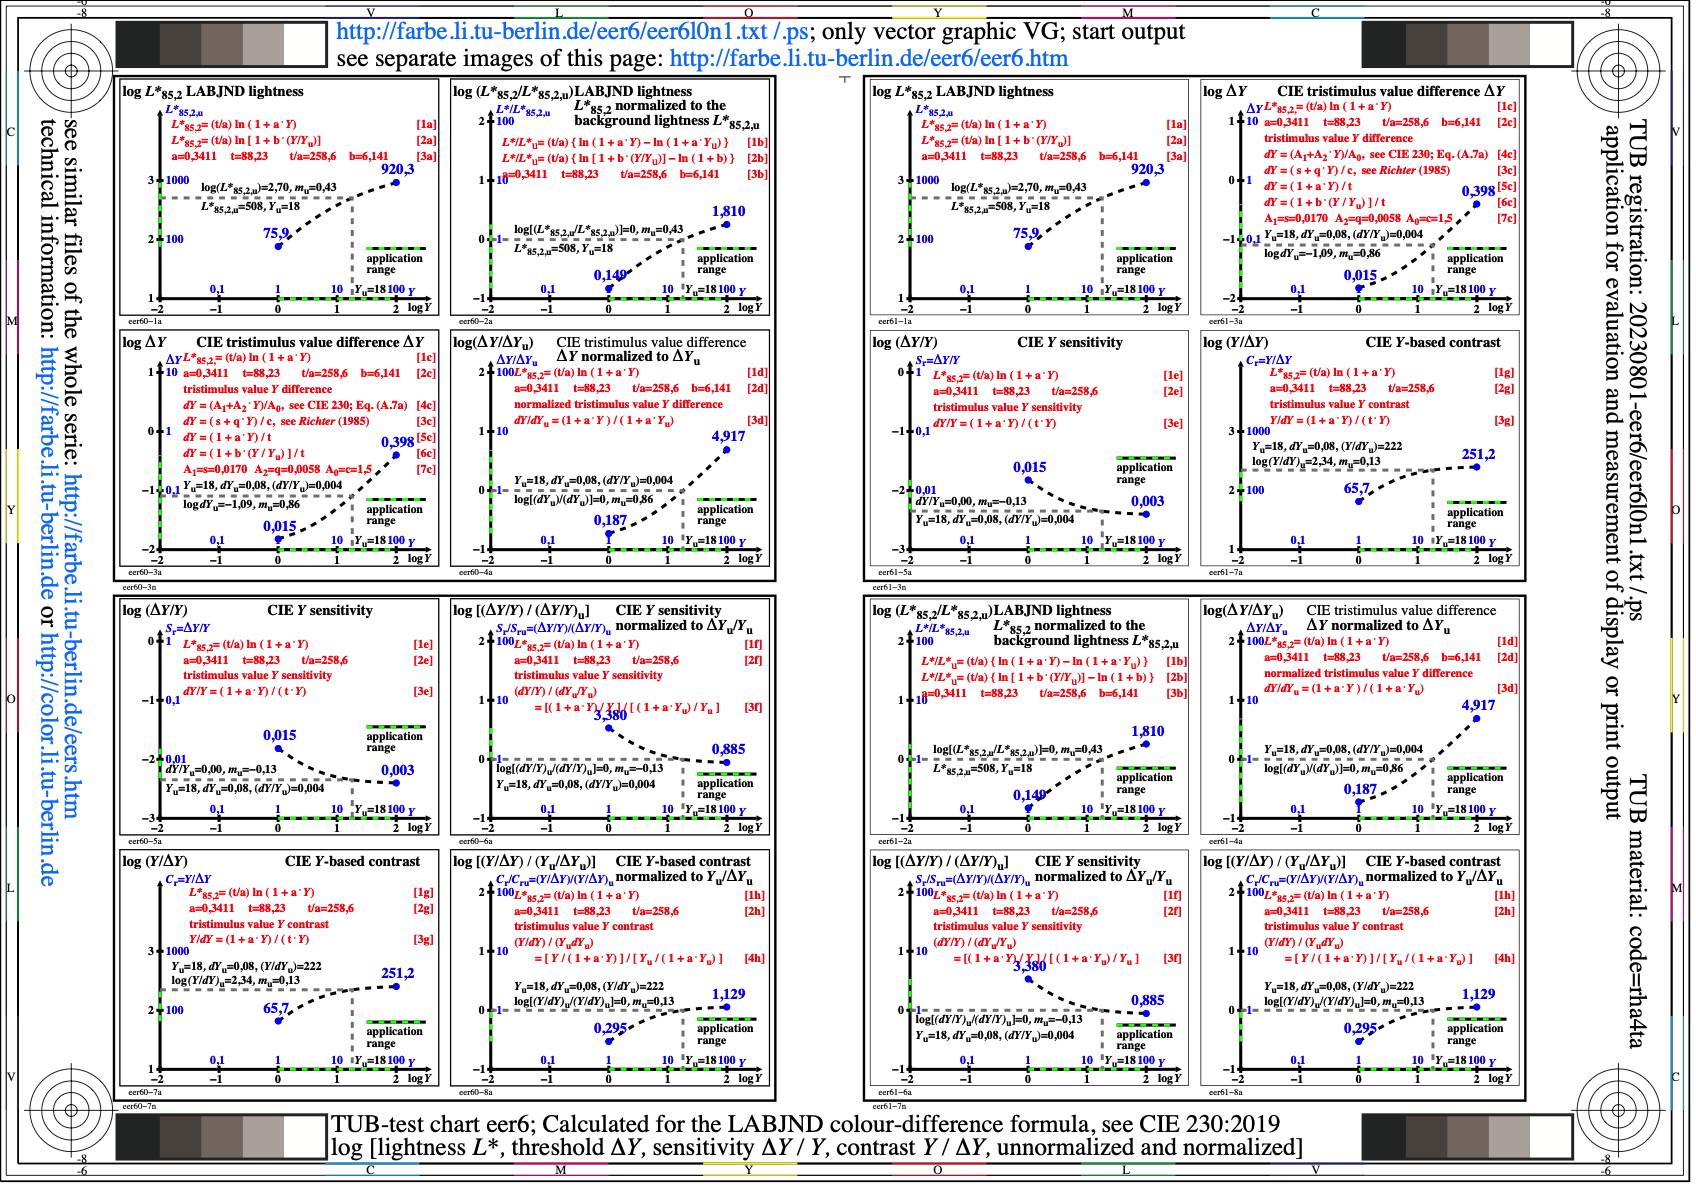
Figure eer6l0n1.jpg: Output in format A6 of the file
eer6l0np.pdf, see
eer6l0n1.
ps /
txt /
pdf /
jpg
eer6: TUB-test chart eer6; Experiments Lingelbach (77)
Approximat. Richter (86), tp=0,4s, 9 observers, equations
and potential-A3 fit, 2 x 5 Lu, range 0,1 to 6000 cd/m^2
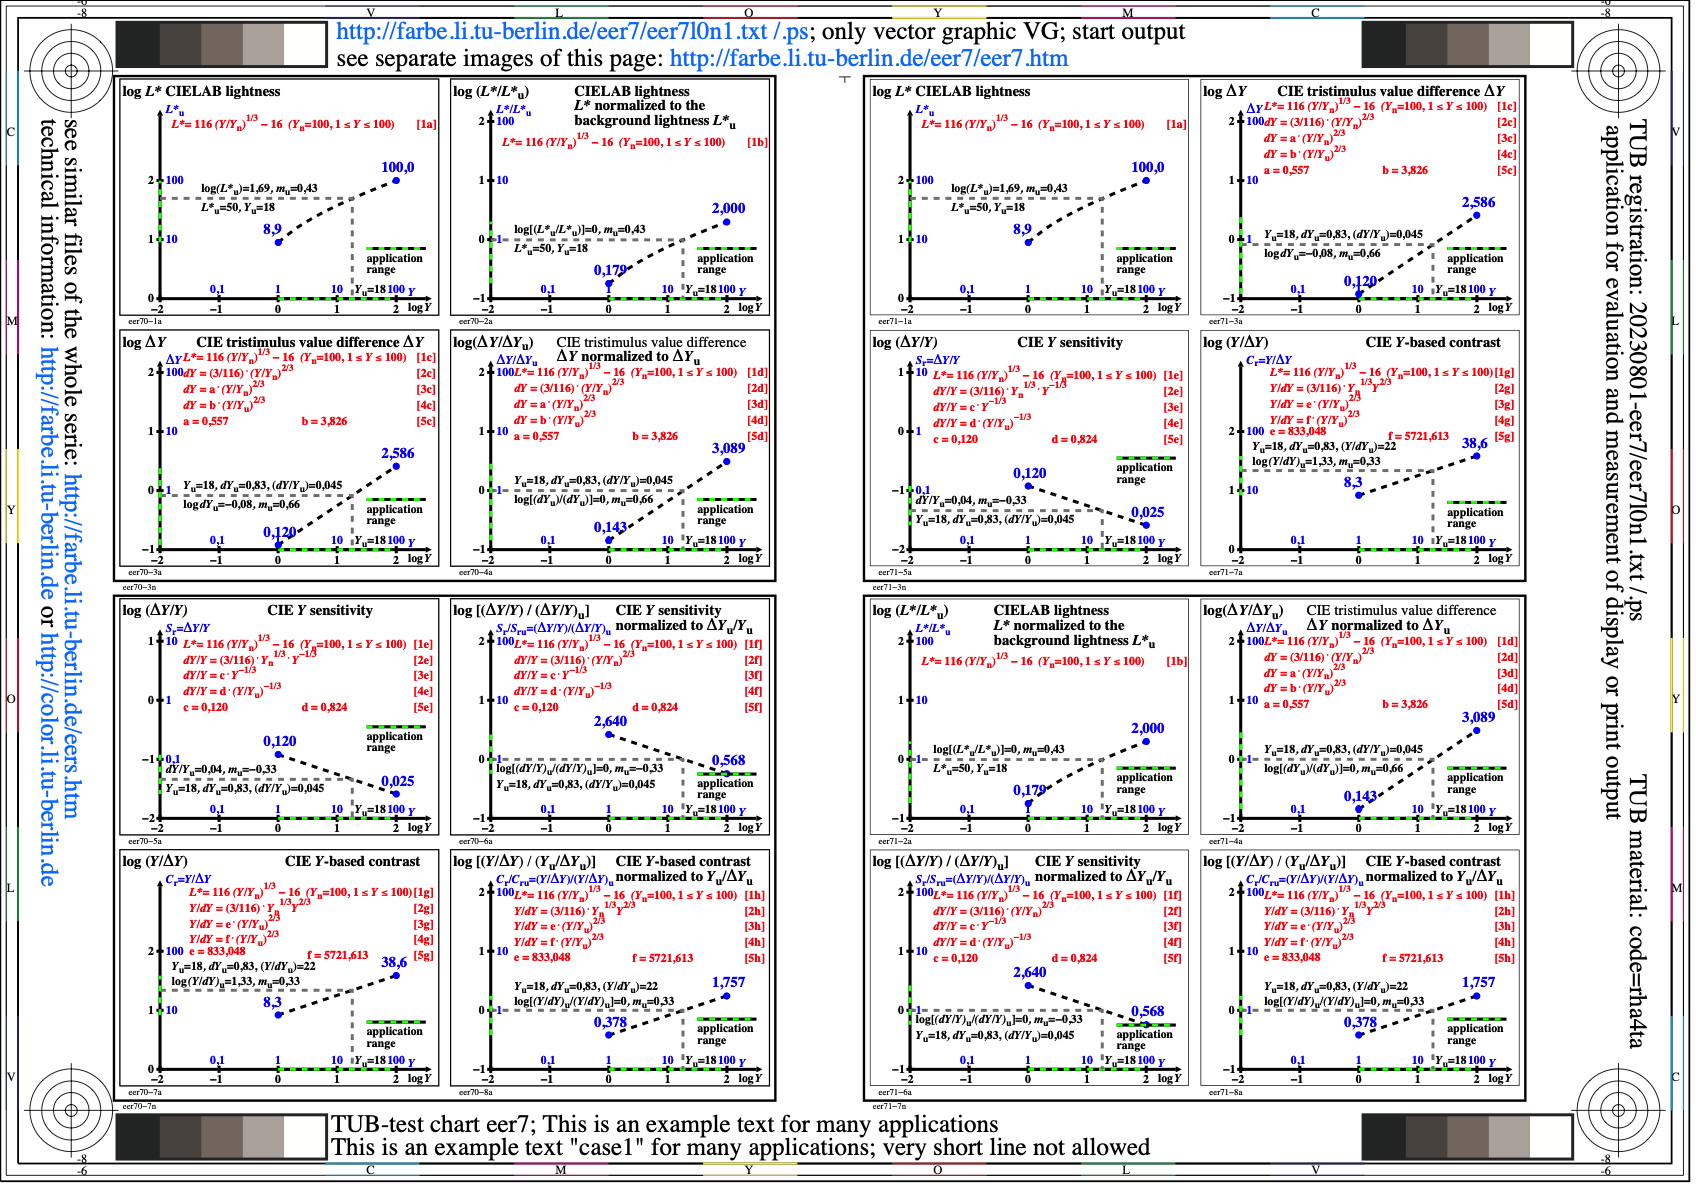
Figure eer7l0n1.jpg: Output in format A6 of the file
eer7l0np.pdf, see
eer7l0n1.
ps /
txt /
pdf /
jpg
eer7: TUB-test chart eer7; Threshold experiments
Lingelbach (77), tp=0,4s, 9 observers, equations
and exponential-A2 fit, 2 x 5 Lu, range 0,1 to 6000 cd/m^2
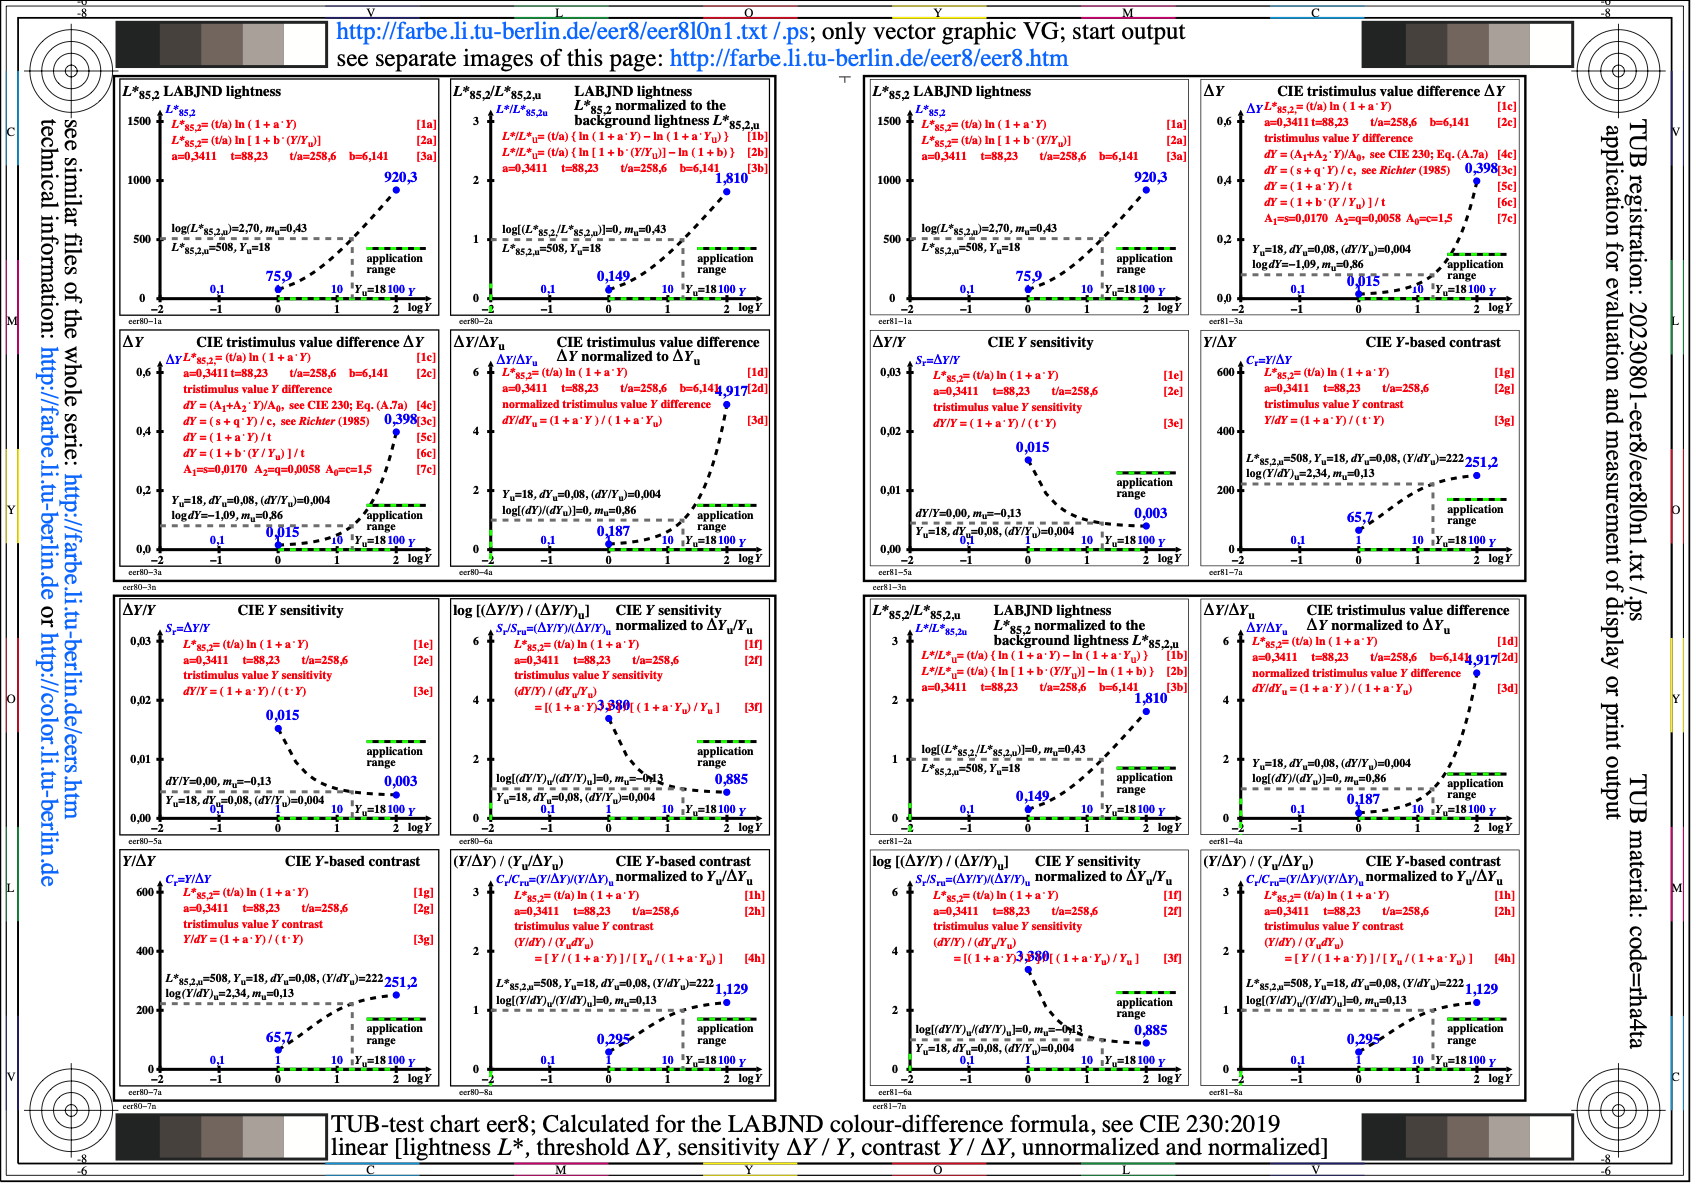
Figure eer8l0n1.jpg: Output in format A6 of the file
eer8l0np.pdf, see
eer8l0n1.
ps /
txt /
pdf /
jpg
eer8: TUB-test chart eer8; Threshold experiments
Lingelbach (77), tp=0,4s, 9 observers, equations
and exponential-A4 fit, 2 x 5 Lu, range 0,1 to 6000 cd/m^2
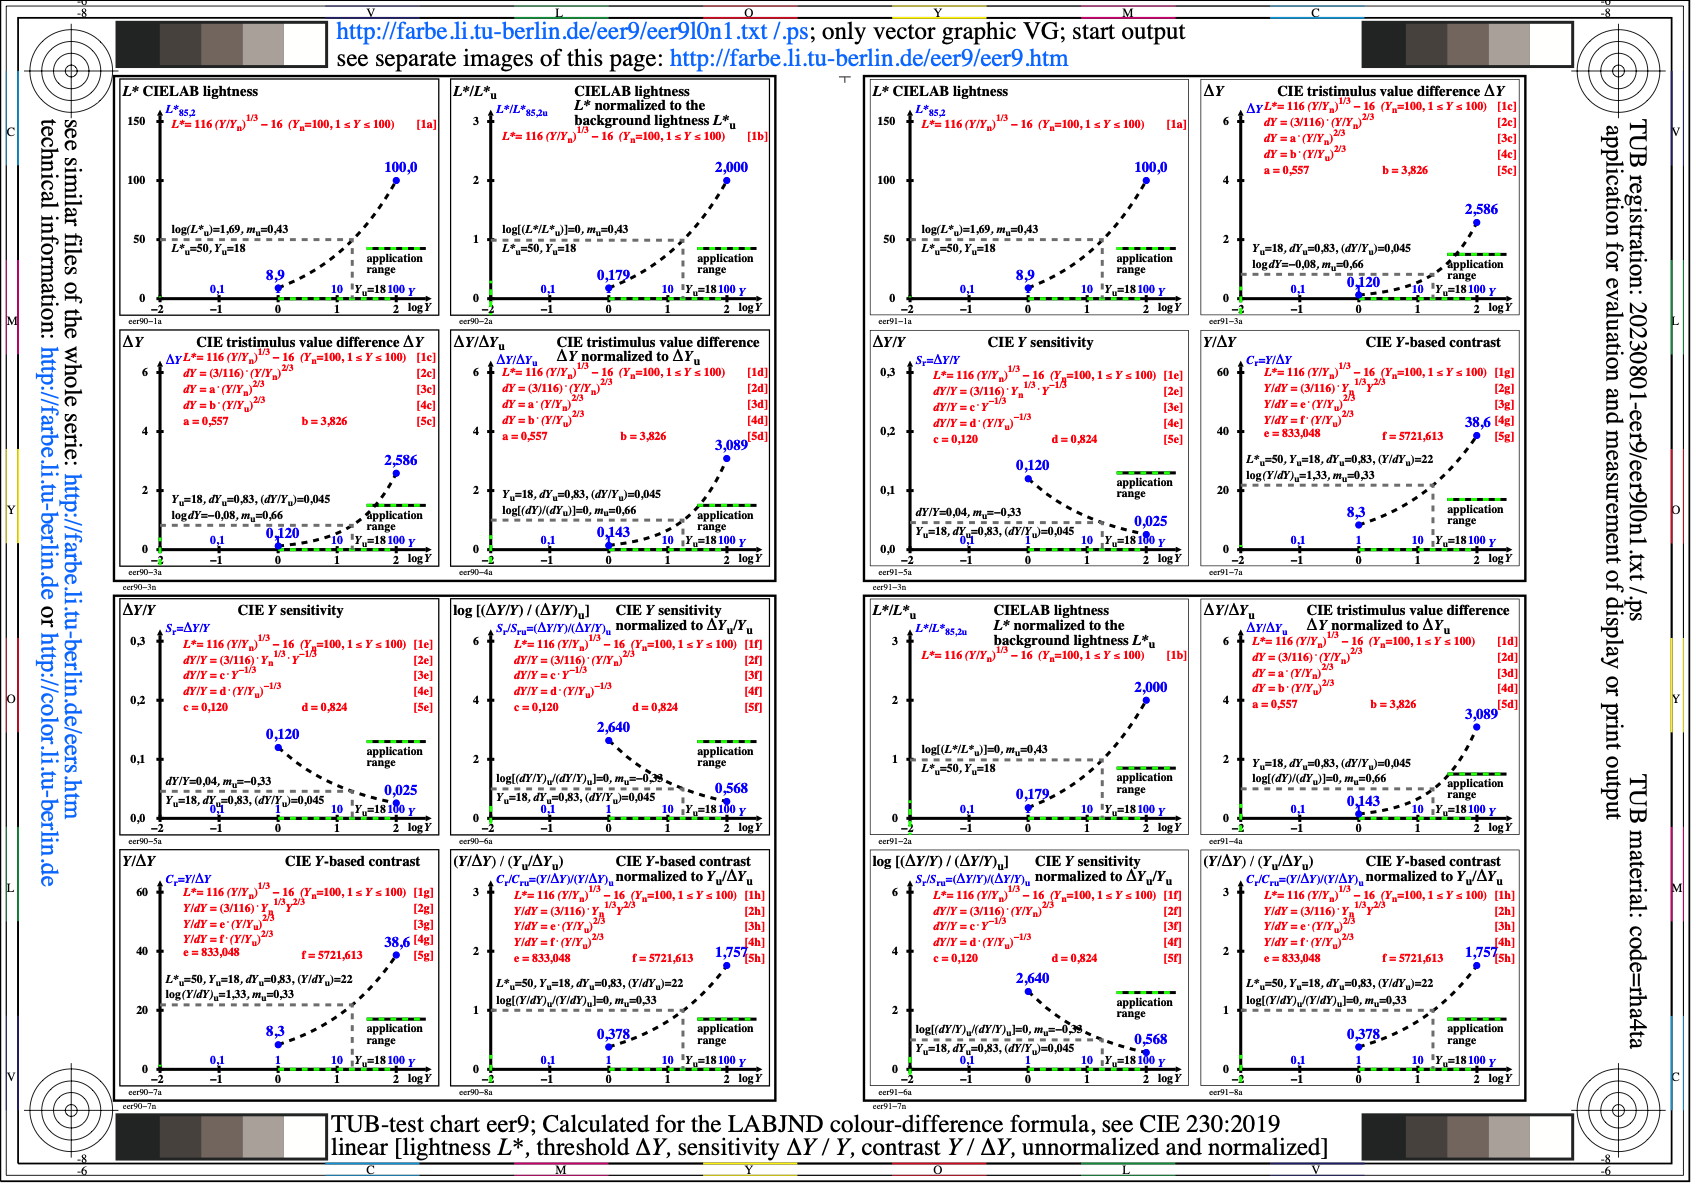
Figure eer9l0n1.jpg: Output in format A6 of the file
eer9l0np.pdf, see
eer9l0n1.
ps /
txt /
pdf /
jpg
eer9: TUB-test chart eer9; Under development
-------
For the archive information (2000-2009) of the BAM server "www.ps.bam.de"
(2000-2018)
about colour test charts, colorimetric calculations,
standards, and publications, see
indexAE.html in English,
indexAG.html in German.
Back to the main page of this TUB web site (NOT archive), see
index.html in English,
indexDE.html in German.