240605 (hand) 1L2L0X0E_(I), http://farbe.li.tu-berlin.de/DEAI.HTM or
http://color.li.tu-berlin.de/DEAI.HTM
For this main page with general information and special images, see
DEAI in English,
DGAI in German.
Remark: Until today there is no specific text on the following 24 pages:
DEBI, DECI, up to DEZI.
For links to the previous chapter C, see
CEAI in English,
CGAI in German.
For links to the next chapter E, see
eeai in English,
eeai in German.
For links to the previous chapter C
Colour Spaces, Colour Differences, and Line Elements (2021)),,
see
Content list of chapter C:
CEA_I in English or
CGA_I in German.
Example image part of 26 parts DEAS to DEZS:
CEAS in English or
CGAS in German.
For links to the this chapter D
Colour Appearance, Elementary Colours, and Metrics (2022),,
see
Content list of chapter D (links and file names use capital letters):
DEA_I in English or
DGA_I in German.
Example image part of 26 parts DEAS to DEZS:
DEAS in English or
DGAS in German.
For links to the next chapter E
Colour Metrics, Differences, and Appearance (2023),,
see
Content list of chapter E (links and file names use small letters):
eea_i in English or
ega_i in German.
Example image part of 26 parts eeas to eezs:
eeas in English or
egas in German.
230201 1L2L0X0D_(I), http://farbe.li.tu-berlin.de/DEAI.HTM or
http://color.li.tu-berlin.de/DEAI.HTM
For this main page with general information and special images
of the corresponding image page with 10 colour series, see
DEAI in English,
DGAI in German.
For the previous main page, see
DEZI in English,
DGZI in German.
For the next main page, see
DEBI in English,
DGBI in German.
For links to the chapter D
Colour Appearance, Elementary Colours, and Metrics (2022),
see
Content list of chapter D:
DEA_I in English or
DGA_I in German.
Summary of chapter D:
DEA_S in English or
DGA_S in German.
Example image part of 26 parts DEAS to DEZS:
DEAS in English or
DGAS in German.
Chapter D: Colour Appearance, Elementary Colours, and Metrics (2022),
Main part DEAI
1. Introduction and Goals
The coordinates of colour spaces and of the colour differences
are connected by line elements. For example Schroedinger (1925)
and Stiles (1946) have tried to develop line elements for this
connection.
Schroedinger, E. (1925), The relationship of
Four-Colour Theory and Three-Colour Theory, Sitzungsberichte
Kaiserl. Akad. Wiss., Wien, [IIa] 134, 471-490.
Stiles, W. S (1946), The line element in colour theory:
a historical review, p. 1-25, in Color metrics, AIC/Holland,
TNO Soesterberg.
The basis are special mathematical relations of integrals and
derivattions.
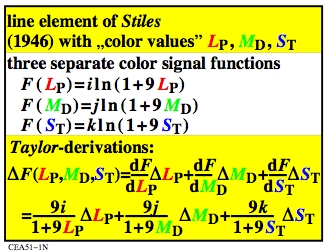
Figure 1: Line elements of Stiles (1946) for three
receptors L, M, and S
(or P=Protanop, D=Deuteranop, T=Tritanop).
For the download of this figure in the VG-PDF format, see
CEA51-1N.PDF.
The derivation of the logarithmic F functions give the
difference sensitivity delta_F which includes the ratio
delta_L/L. For the value
delta_F=1 at the sesitivity threshold a function
between delta_L and L is determined.
The letter L is used for example for
the luminance L, the tristimulus value Y,
the reflecion R, or a rezeptor-colour value
L, M, or S.
In the following usually the relative tristimulus value
x=Y/Yu or the relative luminance x=L/Lu is used.
In this case Yu is the tristimulus value of the grey surround
(often Yu=18), and Lu the luminance
(often Lu=0,2*142cd/m^2=28cd/m^2 in the office
with the illuminance 500 lux).
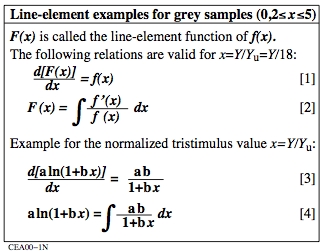
Figure 2: Example of a line enelement with a logarithmic
function F(x).
For the download of this figure in the VG-PDF format, see
CEA00-1N.PDF.
By derivation of the logarithmic function
F(x)=ln(1+bx) a
linear rationale function f(x)=1+bx with
f'(x)=b is determined. For all functions of the form
f'(x)/f(x) one can determine the logarithmic scaling function
F(x). In applications the scaling factor a is chosen very different.
A normalization on the surround u is used here.
Then the factor a is omitted.
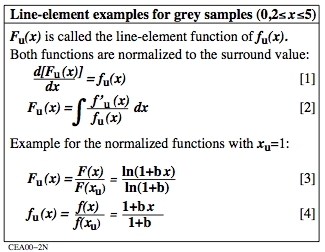
Figure 3: Example of a line elements with a logarithmic
function Fu(x).
For the download of this figure in the VG-PDF format, see
CEA00-2N.PDF.
In figure 3 the functions Fu(x) and fu(x), and their
derivations are used for the comparison of different experimental results.
These functions are independent of the scaling factor a.
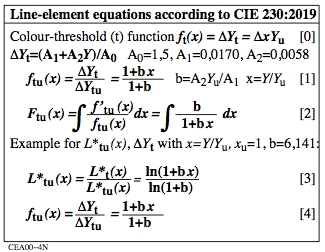
Figure 4: Line-element equations for the tristimulus-value threshold
delta_Y as function of Y.
For the download of this figure in the VG-PDF format, see
CEA00-4N.PDF.
Figure 4 show the line-element equations for a 50% recognition
of the grey samples. The equations use the constants according to
CIE 230:2019. A relative lightness L*u(x) is calculated with
the experimental data at the threshold t.
The equation [4] in the figure produces for all normalizations of
Y the equation:
delta_Y = 1/(1+b)+[b/(1+b)]Y = 1/7,14+[6,14/7,14]Y
This equation includes the black threshold
t=0,14=1/7,14, and the slope
m=0,86=6,14/7,14 at the grey surround
with the tristimulus value Yu=18.
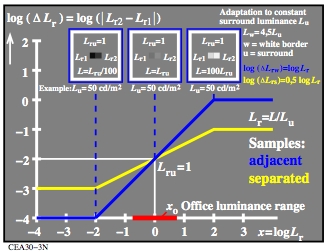
Figure 5: Line-element equations for the tristimulus-value threshold
delta_Y as function of Y.
For the download of this figure in the VG-PDF format, see
CEA30-3N.PDF.
Figure 5 shows schematically the relative threshold luminance
delta_Lr as function of Lr in blue.
A paper of Richter (2006)
includes a model with a an explanation, see
A/BAMAT.PDF.
According to this paper the local effective
luminance Leff of two adjacent greys is calculated
by the equations:
log(Leff) = 0,5 [log(L1)+log(L2)]
Figure 5 shows the model result in yellow. The perceived lightness
L*r of the two grey samples which are hard to distiguish
is not by the factor 100, but only by the factor 10 larger.
The model result for the threhold results according to CIE 230:2019,
and the CIELAB-lightness derivations according to ISO/CIE 11664-4:2019
will be discussed after figure 7.
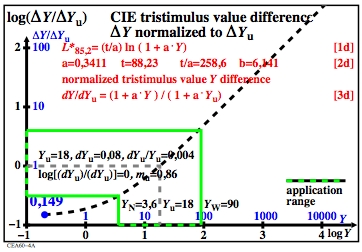
Figure 6: Line-element equations for the
LABJND-tristimulus value threshold
delta_Y as function of Y.
For the download of this figure in the VG-PDF format, see
CEA40-4A.PDF.
Figure 6 shows the LABJND-tristimulus value threshold according
to CIE 230:219. The functions and constants are given in the figure,
compare also figure 4.

Figure 7: Line-element equations for the
CIELAB-"tristimulus value threshold"
delta_Y as function of Y.
For the download of this figure in the VG-PDF format, see
CEA70-4A.PDF.
Figure 7 shows the CIELAB-"tristimulus value threshold" according
to ISO/CIE 11644-4:2019, which is calculated from the ligtness
L*CIELAB. The functions and constants are given in the
figure.
CIELAB is based on the Munsell colour system.
The separated samples were viewed on a grey surround.
The CIELAB colour difference of two neighbor samples is
approximately delta_E*CIELAB=10. This correspond to
about 30 thresholds in black-white direction.
According to the model in figure 5 the following slopes
delta_Y as function of Y are expected:
mLABJND=0,86 (LABJND according to CIE 230:2019)
mCIELAB=0,43 (model expectation for CIELAB according to ISO/CIE 11664-4:2019
However, figure 7 shows the slope
mCIELAB=0,66 (CIELAB slope according to ISO/CIE 11664-4:2019).
Result und interpretation:
The slope mu=0,66 is for Yu in figure 7
the mean of the slope mu=0,86 in figure 6, and
the expected model value mu=0,43 in figure 5.
The visual system forms many mean values of the sample and surround
luminances. These mean values depend on
1. the sample distance d (adjacent or separated),
2. the presentation time t (0,1s until >20s),
3. the luminance of the grey surround.Lu.
Zum Beispiel ist die Steigung:
(m >1) für kurze Darbietungszeiten t<1s,
(m <1) für lange Darbietungszeiten t>10s.
For example the slope is for the contrast C = white : black:
approximately linear (m=0,86) for C=2:1
(aplication case daylight projector),
nonlinear (m=0,66) for C=25:1
(application case colour in the office),
more nonlinear (m=0,50) for C>288:1,
(application case high dynamic range).
For example for the display-output test, the ISO-test chart AE49
with 1080 colours has been developed for different contrasts.
The output questions for the 15 contrast steps are given
in english (E), german (G), and french (F).
The ISO-test charts are on the ISO Standards Maintenance Portal
in the file formats PDF, and PostScript (PS, TXT), see
http://standards.iso.org/iso/9241/306/ed-2/index.html.
For further information about visual threshold data according to
CIE 230:219, see
CEAI.HTM.
The following part is under development.
It will include more text and images on the above topics.
-------
For the archive information (2000-2009) of the BAM server "www.ps.bam.de"
(2000-2018)
about colour test charts, colorimetric calculations,
standards, and publications, see
indexAE.html in English,
indexAG.html in German.
Back to the main page of this TUB web site (NOT archive), see
index.html in English,
indexDE.html in German.