Figure DEA0L0N1.jpg: Output in format A6 of the file DEA0L0NP.PDF, see
DEA0L0N1. PS / TXT / PDF / jpg
Section 2, Chapter D:
Colour Appearance, Elementary Colours, and Metrics (2022)
This image page with 260 image series:
de2s in English,
dg2s in German.
Previous image page:
ce2s in English,
cg2s in German.
Next image page, see
ee2s in English,
eg2s in German.
Introduction, content list and summary:
DEAI,
DEA_I,
DEA_S in English or
DGAI,
DGA_I,
DGA_S in German.
Chapter 2: Colourimetry, Colour Vision and Applications for Colour Image Technology (2019-2024), Image part de2s
Chapter D:: Colour Appearance, Elementary Colours, and Metrics (2022)
The following 260 image series between dea0 and dez9
show the content with links to the single figures
in up to six formats.
Figure DEA0L0N1.jpg: Output in format A6 of the file
DEA0L0NP.PDF, see
DEA0L0N1.
PS /
TXT /
PDF /
jpg
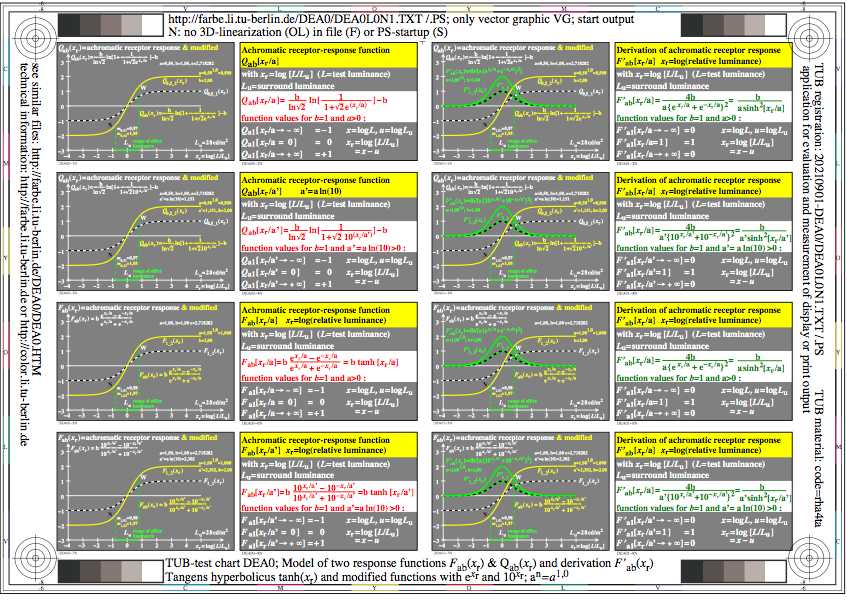
DEA0: TUB-test chart DEA0; Comparison of Qab(xr) and Fab(xr)
Line elements as integral an derivtion
tanh(xr) mit e^(xr/a) und 10^(xr/a')
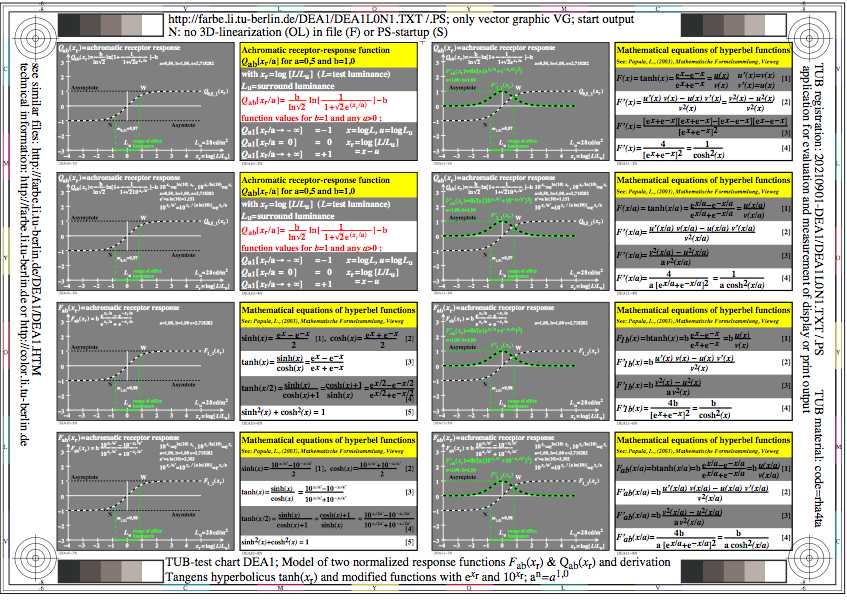
Figure DEA1L0N1.jpg: Output in format A6 of the file
DEA1L0NP.PDF, see
DEA1L0N1.
PS /
TXT /
PDF /
jpg
DEA1: TUB-test chart DEA1; Q/Fab(xr)-models for visual responses
Q/Fab(xr) with e^(xr/a) and 10^(xr/a')
a'=a ln(10); a^n = a^1,0
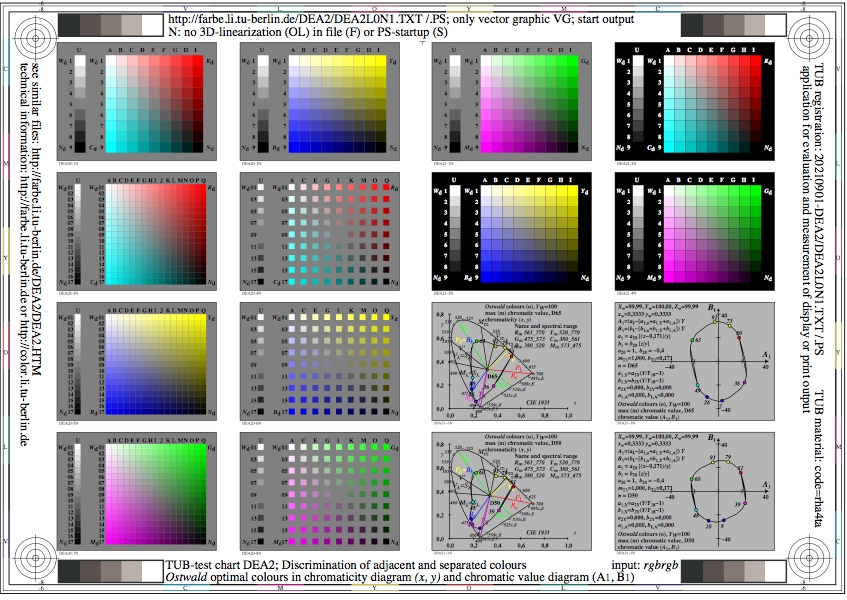
Figure DEA2L0N1.jpg: Output in format A6 of the file
DEA2L0NP.PDF, see
DEA2L0N1.
PS /
TXT /
PDF /
jpg
DEA2: TUB-test chart DEA2; Q/Fab(xr)-models for visual responses
Normalized Q/Fab(xr) with e^(xr/a) and 10^(xr/a')
a'=a ln(10); a^n = a^0,7, !!under work!!
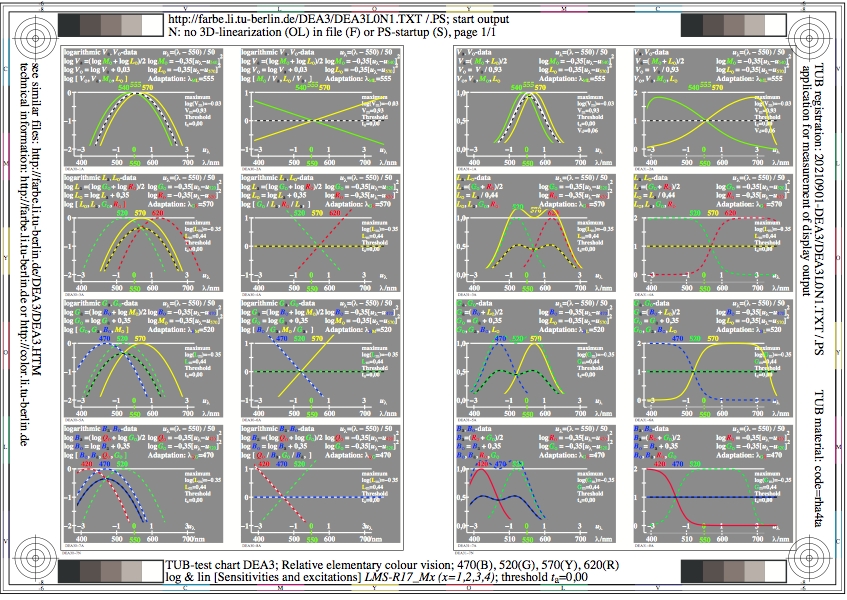
Figure DEA3L0N1.jpg: Output in format A6 of the file
DEA3L0NP.PDF, see
DEA3L0N1.
PS /
TXT /
PDF /
jpg
DEA3: TUB-Test chart DEA3; Relative elementary colour vision
log & lin [Sensitivities and excitations]; LMS_R17_Mx]
470(G), 520(G), 570(Y), 620(R), threshold ta=0,00

Figure DEA4L0N1.jpg: Output in format A6 of the file
DEA4L0NP.PDF, see
DEA4L0N1.
PS /
TXT /
PDF /
jpg
DEA4: TUB-Test chart DEA4; Relative elementary colour vision
log & lin [Sensitivities and excitations; LMS_R17_Mx]
520(G), 545(P), 570(Y), 595(O), 620(R), threshold ta=0,00

Figure DEA5L0N1.jpg: Output in format A6 of the file
DEA5L0NP.PDF, see
DEA5L0N1.
PS /
TXT /
PDF /
jpg
DEA5: TUB-Test chart DEA5; Relative elementary colour vision
log & lin [Sensitivities and excitations; LMS_R17_Mx]
520(G), 545(P), 570(Y), 595(O), 620(R), threshold ta=0,00
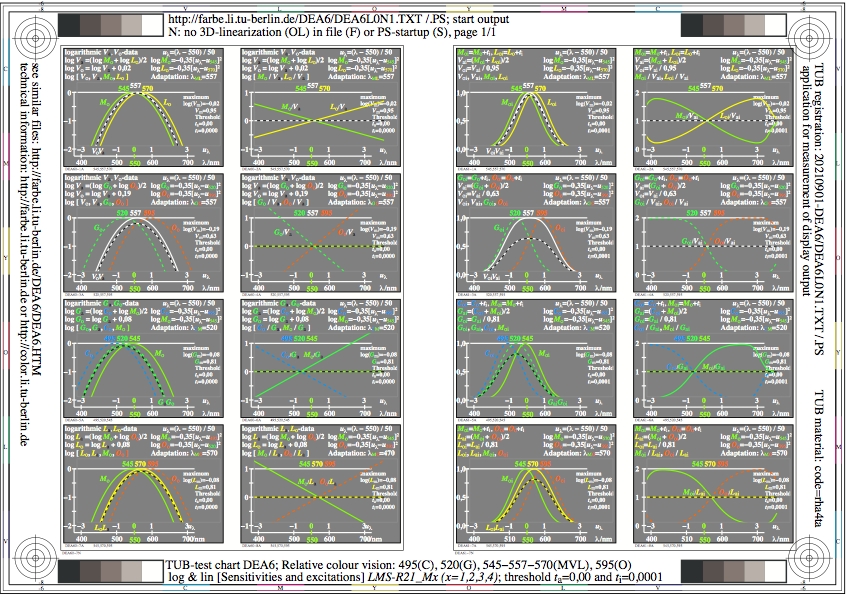
Figure DEA6L0N1.jpg: Output in format A6 of the file
DEA6L0NP.PDF, see
DEA6L0N1.
PS /
TXT /
PDF /
jpg
DEA6: TUB-Test chart DEA6; Relative receptor-colour vision
log & lin [sensitivities and exitations LMS_R21]
495(C), 520(G), 545-557-570(MVL), 595(O), ta=0,00&ti=0,0001
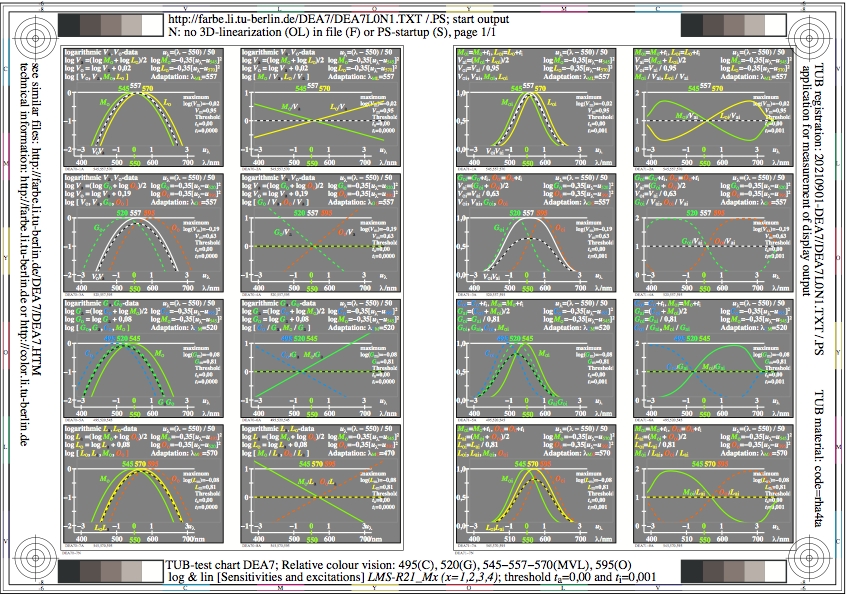
Figure DEA7L0N1.jpg: Output in format A6 of the file
DEA7L0NP.PDF, see
DEA7L0N1.
PS /
TXT /
PDF /
jpg
DEA7: TUB-Test chart DEA7; Relative receptor-colour vision
log & lin [sensitivities and exitations LMS_R21]
495(C), 520(G), 545-557-570(MVL), 595(O), ta=0,00&ti=0,001

Figure DEA8L0N1.jpg: Output in format A6 of the file
DEA8L0NP.PDF, see
DEA8L0N1.
PS /
TXT /
PDF /
jpg
DEA8: TUB-Test chart DEA8; Relative receptor-colour vision
log & lin [sensitivities and exitations LMS_R21]
495(C), 520(G), 545-557-570(MVL), 595(O), ta=0,00&ti=0,01
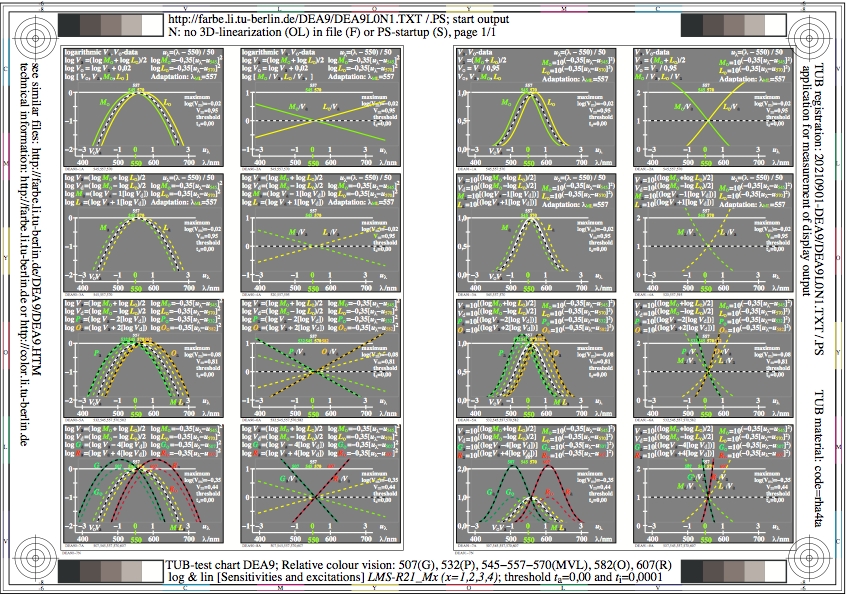
Figure DEA9L0N1.jpg: Output in format A6 of the file
DEA9L0NP.PDF, see
DEA9L0N1.
PS /
TXT /
PDF /
jpg
DEA9: TUB-test chart DEA9; Relative receptor-colour vision
log & lin [sensitivities and exitations LMS_R21]
507(G), 532(P), 545-557-570(MVL), 582(O), 607(R), ta=0,00

Figure DEB0L0N1.jpg: Output in format A6 of the file
DEB0L0NP.PDF, see
DEB0L0N1.
PS /
TXT /
PDF /
jpg
DEB0: TUB-test chart DEB0; Comparison of Qab(xr) & Fab(xr)
Line elements, contrast, and lightness
Comparison of the model functions

Figure DEB1L0N1.jpg: Output in format A6 of the file
DEB1L0NP.PDF, see
DEB1L0N1.
PS /
TXT /
PDF /
jpg
DEB1: TUB-test chart DEB1; Qab(xr)-model for visual responses
ln(xr) with e^xr/a and 10^xr/a'
a'=a ln(10); a^n = a^1,0
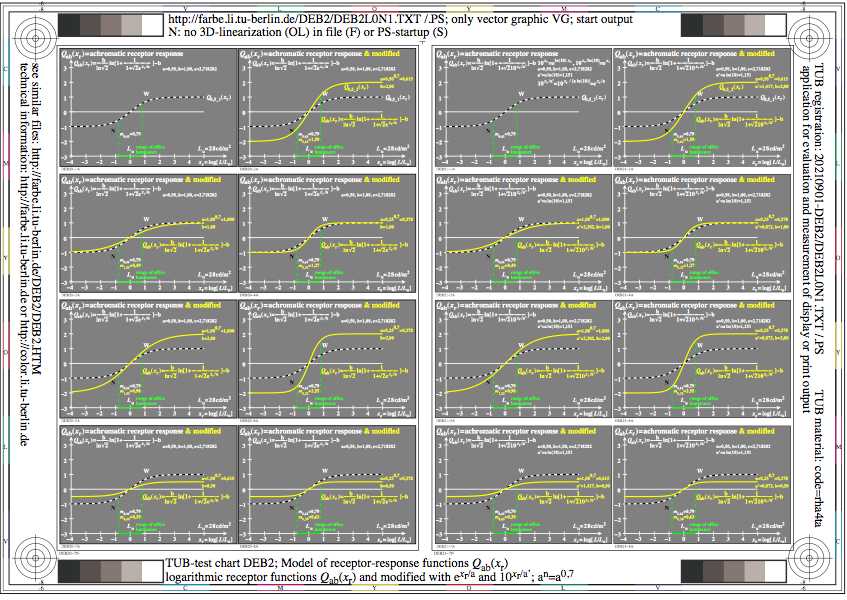
Figure DEB2L0N1.jpg: Output in format A6 of the file
DEB2L0NP.PDF, see
DEB2L0N1.
PS /
TXT /
PDF /
jpg
DEB2: TUB-test chart DEB2; Qab(xr)-model for visual responses
ln(xr) with e^xr/a and 10^xr/a'
a'=a ln(10); a^n = a^0,7
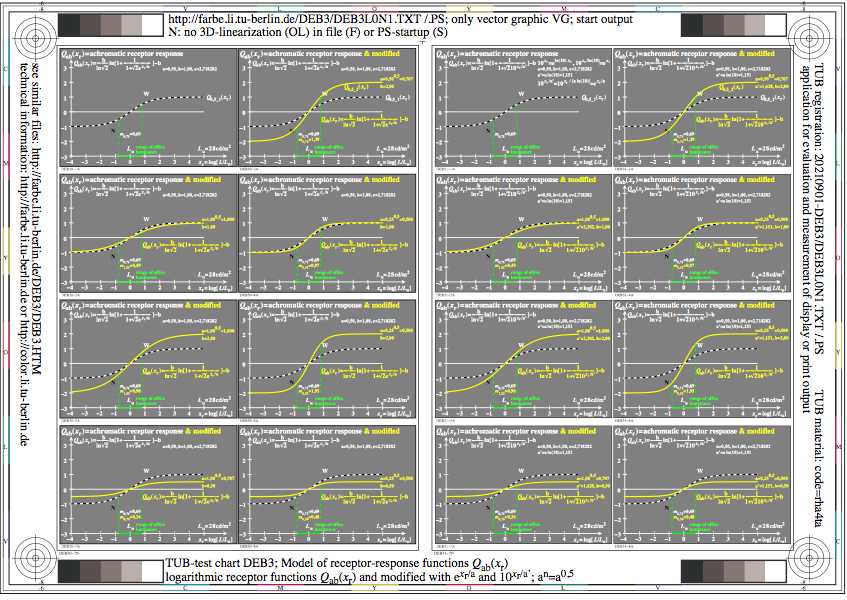
Figure DEB3L0N1.jpg: Output in format A6 of the file
DEB3L0NP.PDF, see
DEB3L0N1.
PS /
TXT /
PDF /
jpg
DEB3: TUB-test chart DEB3; Qab(xr)-model for visual responses
ln(xr) with e^xr/a and 10^xr/a'
a'=a ln(10); a^n = a^0,5
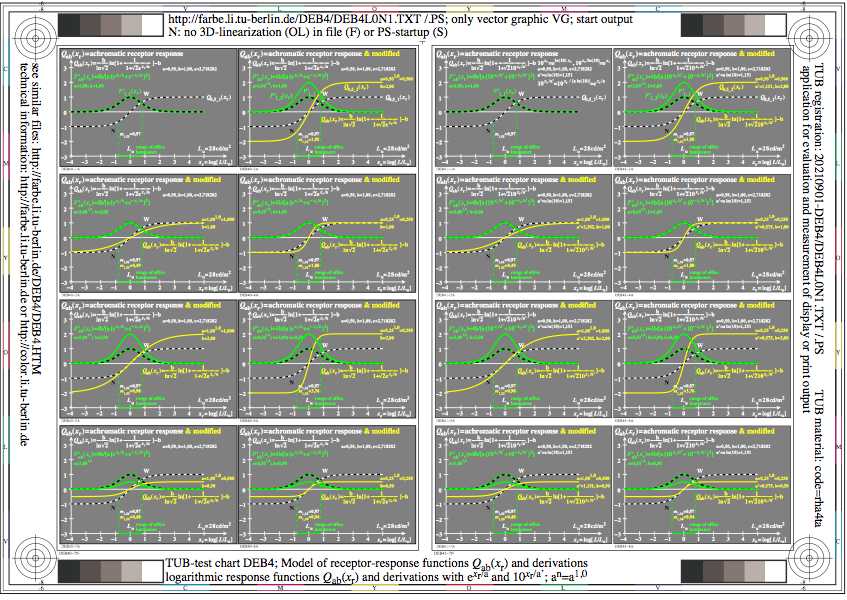
Figure DEB4L0N1.jpg: Output in format A6 of the file
DEB4L0NP.PDF, see
DEB4L0N1.
PS /
TXT /
PDF /
jpg
DEB4: TUB-test chart DEB4; Qab(xr)-model for visual responses
derivation of the responses; ln(xr) with e^xr/a and 10^xr/a'
a'=a ln(10); a^n = a^1,0
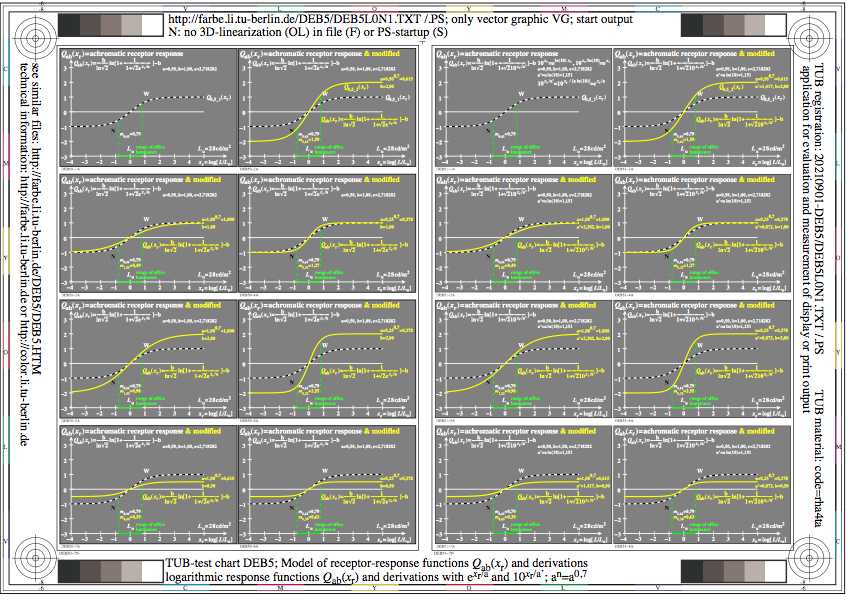
Figure DEB5L0N1.jpg: Output in format A6 of the file
DEB5L0NP.PDF, see
DEB5L0N1.
PS /
TXT /
PDF /
jpg
DEB5: TUB-test chart DEB5; Qab(xr)-model for visual responses
derivation of the responses; ln(xr) with e^xr/a and 10^xr/a'
a'=a ln(10); a^n = a^0,7
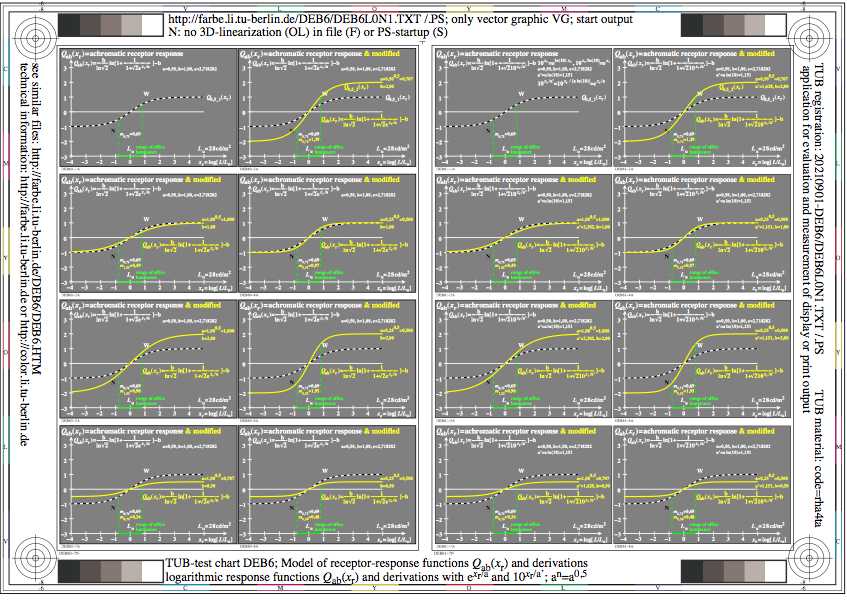
Figure DEB6L0N1.jpg: Output in format A6 of the file
DEB6L0NP.PDF, see
DEB6L0N1.
PS /
TXT /
PDF /
jpg
DEB6: TUB-test chart DEB6; Qab(xr)-model for visual responses
derivation of the responses; ln(xr) with e^xr/a and 10^xr/a'
a'=a ln(10); a^n = a^0,5

Figure DEB7L0N1.jpg: Output in format A6 of the file
DEB7L0NP.PDF, see
DEB7L0N1.
PS /
TXT /
PDF /
jpg
DEB7: TUB-test chart DEB7; Qab(xr)-model for visual responses
derivation of the responses; ln(xr) with e^xr/a and 10^xr/a'
a'=a ln(10); a^n = a^1,0

Figure DEB8L0N1.jpg: Output in format A6 of the file
DEB8L0NP.PDF, see
DEB8L0N1.
PS /
TXT /
PDF /
jpg
DEB8: TUB-test chart DEB8; Qab(xr)-model for visual responses
derivation of the responses; ln(xr) with e^xr/a and 10^xr/a'
a'=a ln(10); a^n = a^0,7
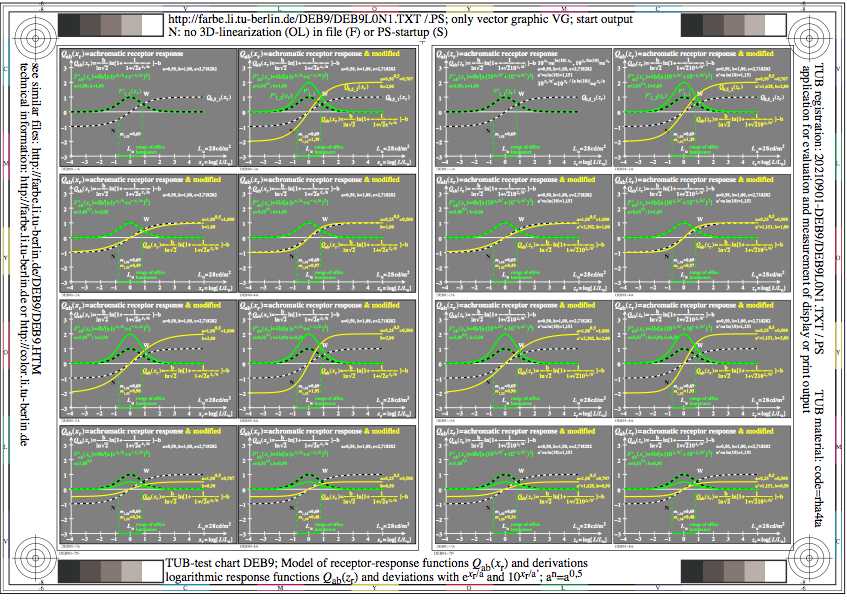
Figure DEB9L0N1.jpg: Output in format A6 of the file
DEB9L0NP.PDF, see
DEB9L0N1.
PS /
TXT /
PDF /
jpg
DEB9: TUB-test chart DEB9; Qab(xr)-model for visual responses
derivation of the responses; ln(xr) with e^xr/a and 10^xr/a'
a'=a ln(10); a^n = a^0,5
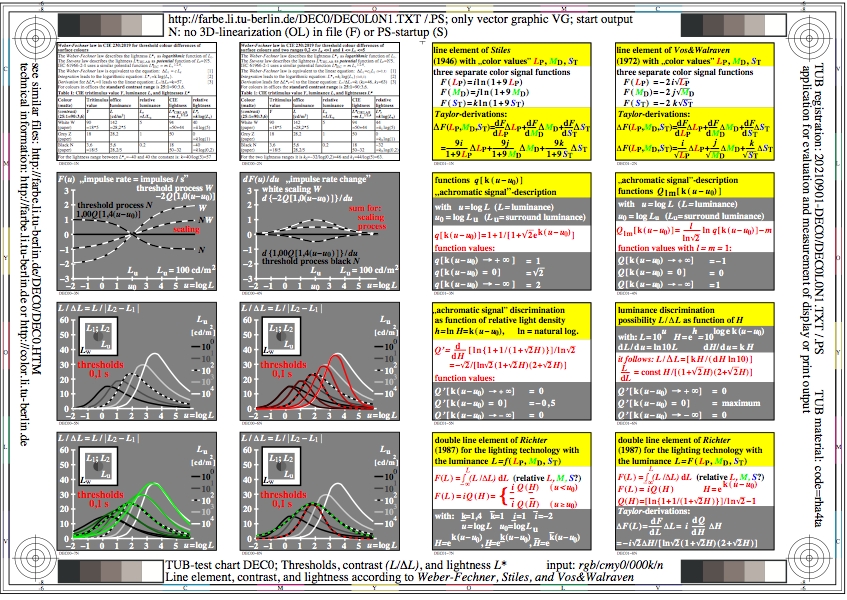
Figure DEC0L0N1.jpg: Output in format A6 of the file
DEC0L0NP.PDF, see
DEC0L0N1.
PS /
TXT /
PDF /
jpg
DEC0: TUB-test chart DEC0; Threshold, contrast, and lightness
Line elements, contrast, and lightness
of Weber-Fechner, Stiles, and Vos&Walraven

Figure DEC1L0N1.jpg: Output in format A6 of the file
DEC1L0NP.PDF, see
DEC1L0N1.
PS /
TXT /
PDF /
jpg
DEC1: TUB-test chart DEC1; Fab(xr)-model for visual responses
tanh(xr) with e^xr/a and 10^xr/a'
a'=a ln(10); a^n = a^1,0

Figure DEC2L0N1.jpg: Output in format A6 of the file
DEC2L0NP.PDF, see
DEC2L0N1.
PS /
TXT /
PDF /
jpg
DEC2: TUB-test chart DEC2; Fab(xr)-model for visual responses
tanh(xr) with e^xr/a and 10^xr/a'
a'=a ln(10); a^n = a^0,7
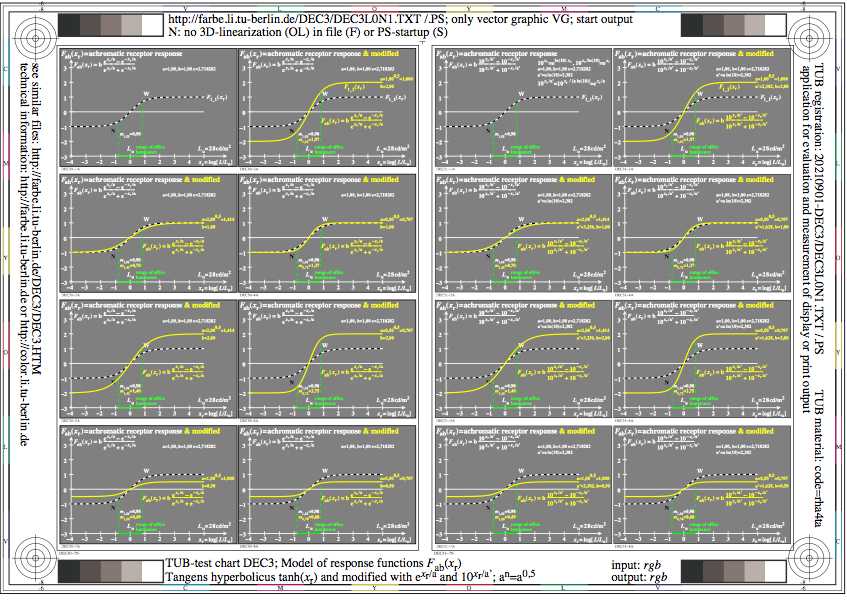
Figure DEC3L0N1.jpg: Output in format A6 of the file
DEC3L0NP.PDF, see
DEC3L0N1.
PS /
TXT /
PDF /
jpg
DEC3: TUB-test chart DEC3; Fab(xr)-model for visual responses
tanh(xr) with e^xr/a and 10^xr/a'
a'=a ln(10); a^n = a^0,5

Figure DEC4L0N1.jpg: Output in format A6 of the file
DEC4L0NP.PDF, see
DEC4L0N1.
PS /
TXT /
PDF /
jpg
DEC4: TUB-test chart DEC4; Fab(xr)-model for visual responses
derivation of the responses; tanh(xr) with e^xr/a and 10^xr/a'
a'=a ln(10); a^n = a^1,0

Figure DEC5L0N1.jpg: Output in format A6 of the file
DEC5L0NP.PDF, see
DEC5L0N1.
PS /
TXT /
PDF /
jpg
DEC5: TUB-test chart DEC5; Fab(xr)-model for visual responses
derivation of the responses; tanh(xr) with e^xr/a and 10^xr/a'
a'=a ln(10); a^n = a^0,7
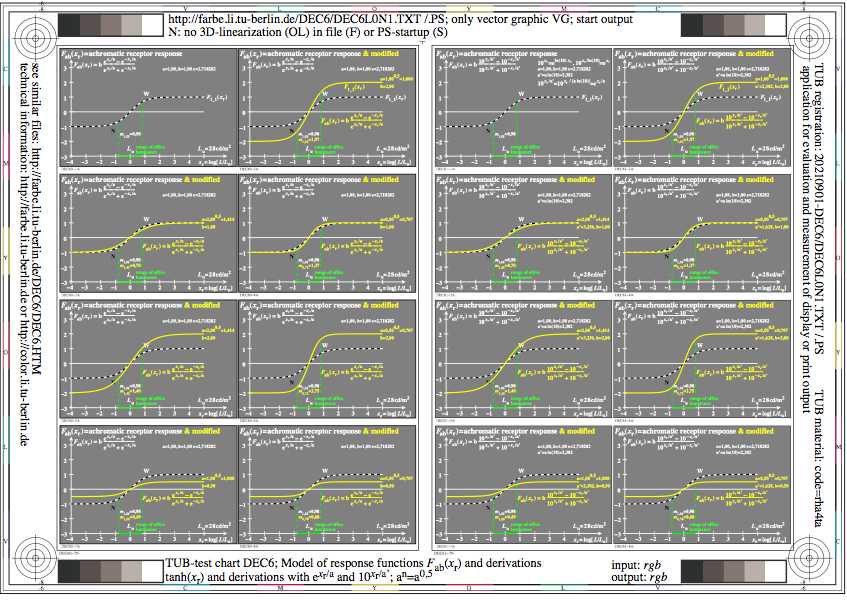
Figure DEC6L0N1.jpg: Output in format A6 of the file
DEC6L0NP.PDF, see
DEC6L0N1.
PS /
TXT /
PDF /
jpg
DEC6: TUB-test chart DEC6; Fab(xr)-model for visual responses
derivation of the responses; tanh(xr) with e^xr/a and 10^xr/a'
a'=a ln(10); a^n = a^0,5

Figure DEC7L0N1.jpg: Output in format A6 of the file
DEC7L0NP.PDF, see
DEC7L0N1.
PS /
TXT /
PDF /
jpg
DEC7: TUB-test chart DEC7; Fab(xr)-model for visual responses
derivation of the responses; tanh(zr) with 10^zr instead of e^zr
a'=a ln(10); a^n = a^1,0
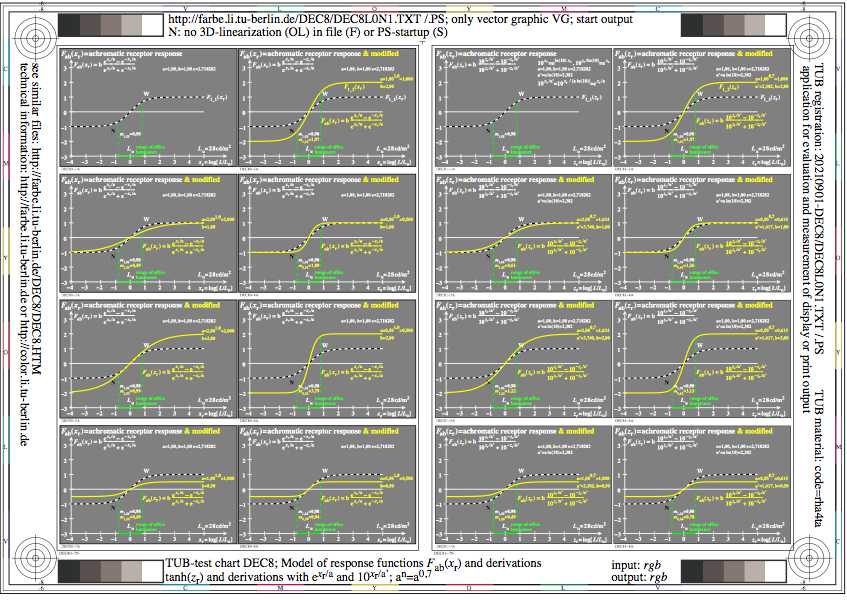
Figure DEC8L0N1.jpg: Output in format A6 of the file
DEC8L0NP.PDF, see
DEC8L0N1.
PS /
TXT /
PDF /
jpg
DEC8: TUB-test chart DEC8; Fab(xr)-model for visual responses
derivation of the responses; tanh(zr) with 10^zr instead of e^zr
a'=a ln(10); a^n = a^0,7
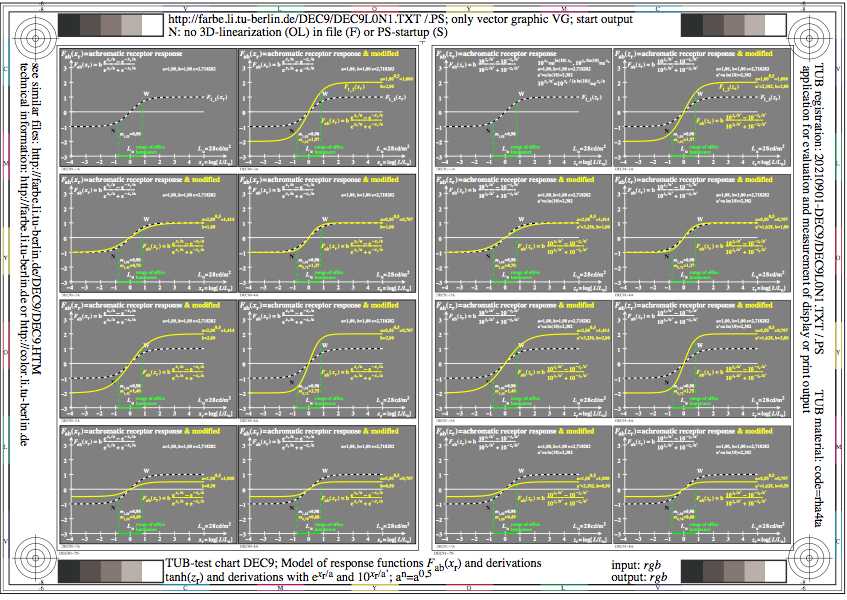
Figure DEC9L0N1.jpg: Output in format A6 of the file
DEC9L0NP.PDF, see
DEC9L0N1.
PS /
TXT /
PDF /
jpg
DEC9: TUB-test chart DEC9; Fab(xr)-model for visual responses
derivation of the responses; tanh(zr) with 10^zr instead of e^zr
a'=a ln(10); a^n = a^0,5
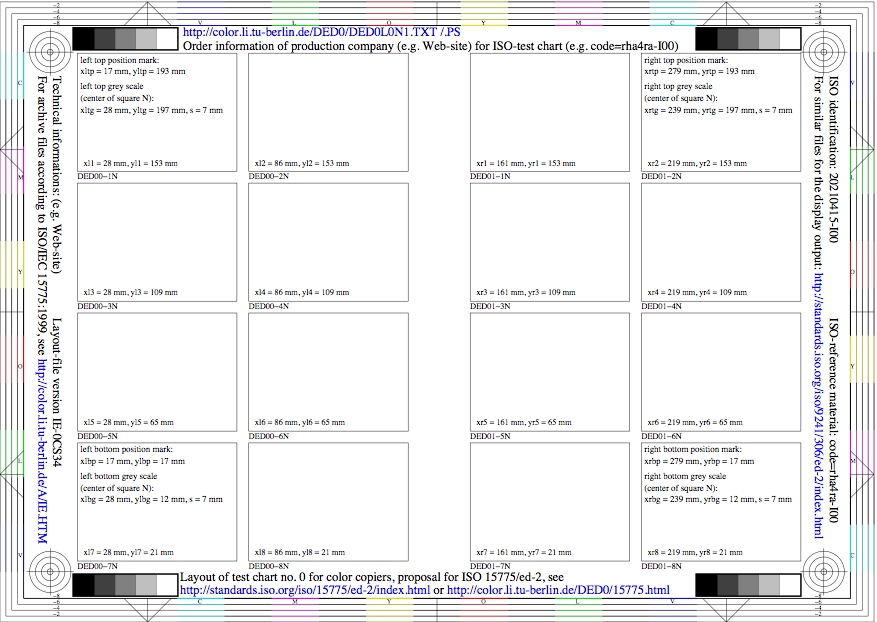
Figure DED0L0N1.jpg: Output in format A6 of the file
DED0L0NP.PDF, see
DED0L0N1.
PS /
TXT /
PDF /
jpg
DED0: TUB-test chart DED0; Proposal for ISO/IEC 15775
ISO-test chart IE-0CSA34 similar to ISO/IEC 15775:1999
Layout with 16 figures and the (x,y) positions
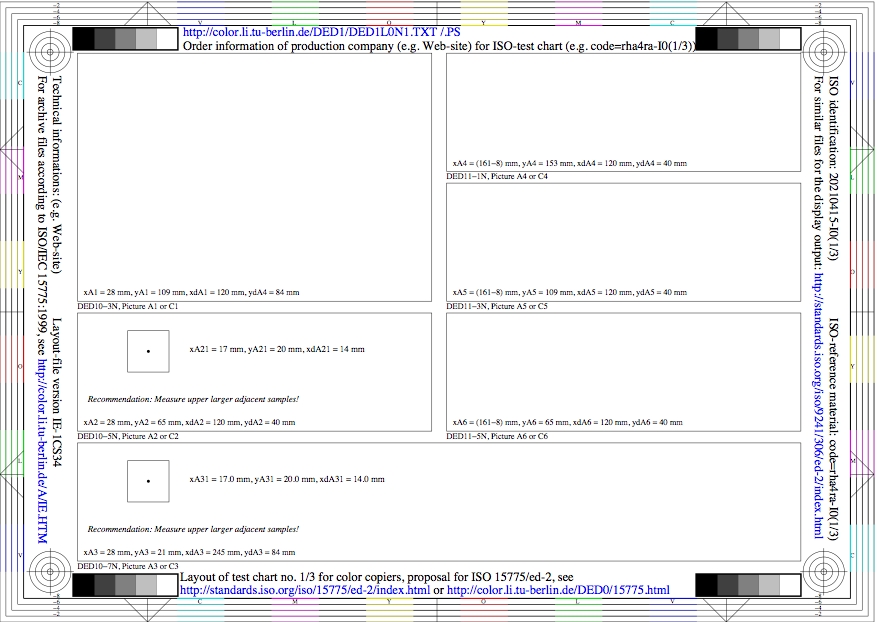
Figure DED1L0N1.jpg: Output in format A6 of the file
DED1L0NP.PDF, see
DED1L0N1.
PS /
TXT /
PDF /
jpg
DED1: TUB-test chart DED1; Proposal for ISO/IEC 15775
ISO-test chart IE-1CSA34 similar to ISO/IEC 15775:1999
Layout with 6 figures and the (x,y) positions
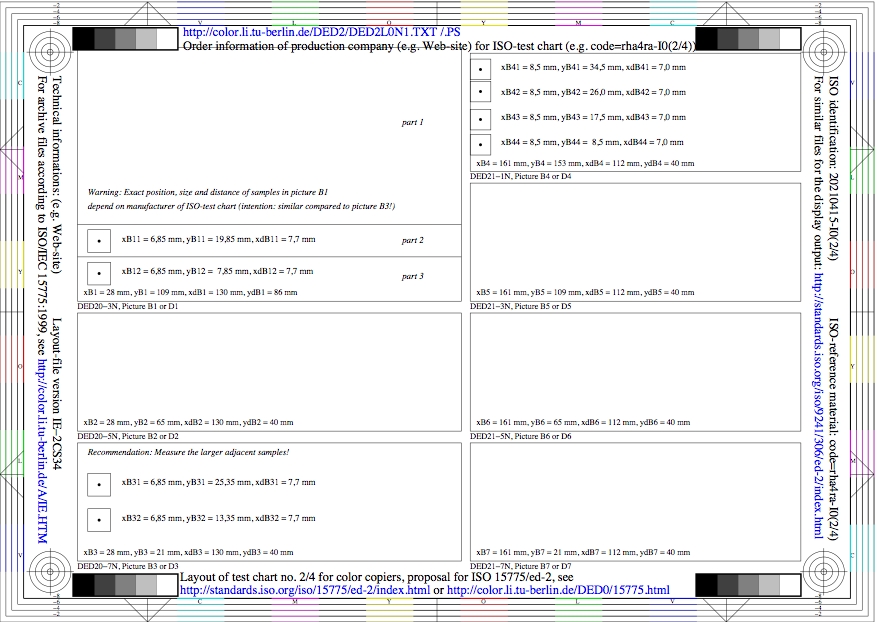
Figure DED2L0N1.jpg: Output in format A6 of the file
DED2L0NP.PDF, see
DED2L0N1.
PS /
TXT /
PDF /
jpg
DED2: TUB-test chart DED2; Proposal for ISO/IEC 15775
ISO-test chart IE-2CSA34 similar to ISO/IEC 15775:1999
Layout with 7 figures and the (x,y) positions

Figure DED3L0N1.jpg: Output in format A6 of the file
DED3L0NP.PDF, see
DED3L0N1.
PS /
TXT /
PDF /
jpg
DED3: TUB-test chart DED3; Proposal for ISO/IEC 15775
ISO-test chart E1-1TSA34 similar to ISO/IEC 15775:1999
TUB-test chart 1 with 6 achromatic figures
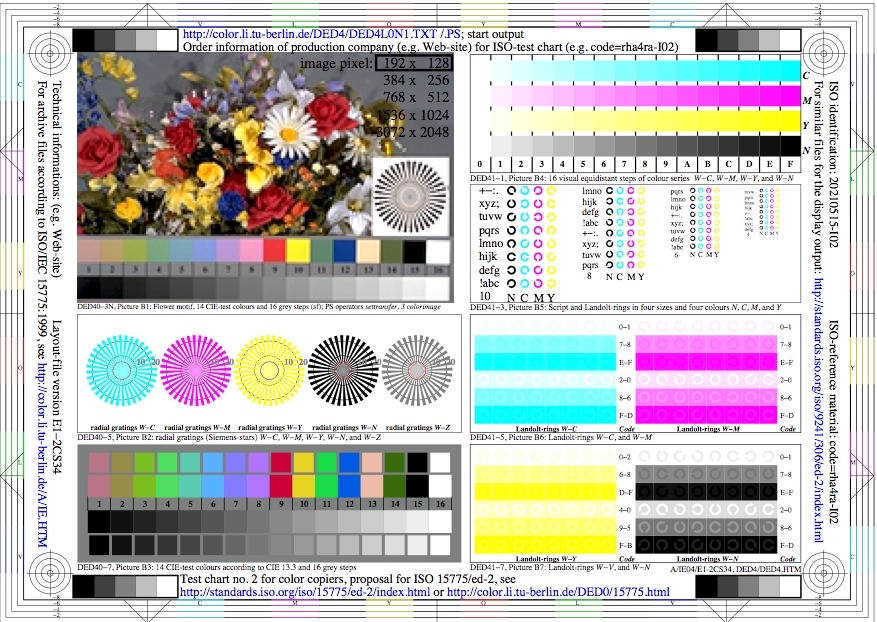
Figure DED4L0N1.jpg: Output in format A6 of the file
DED4L0NP.PDF, see
DED4L0N1.
PS /
TXT /
PDF /
jpg
DED4: TUB-test chart DED4; Proposal for ISO/IEC 15775
ISO-test chart E1-2CSA34 similar to ISO/IEC 15775:1999
TUB-test chart 2 with 7 chromatic figures
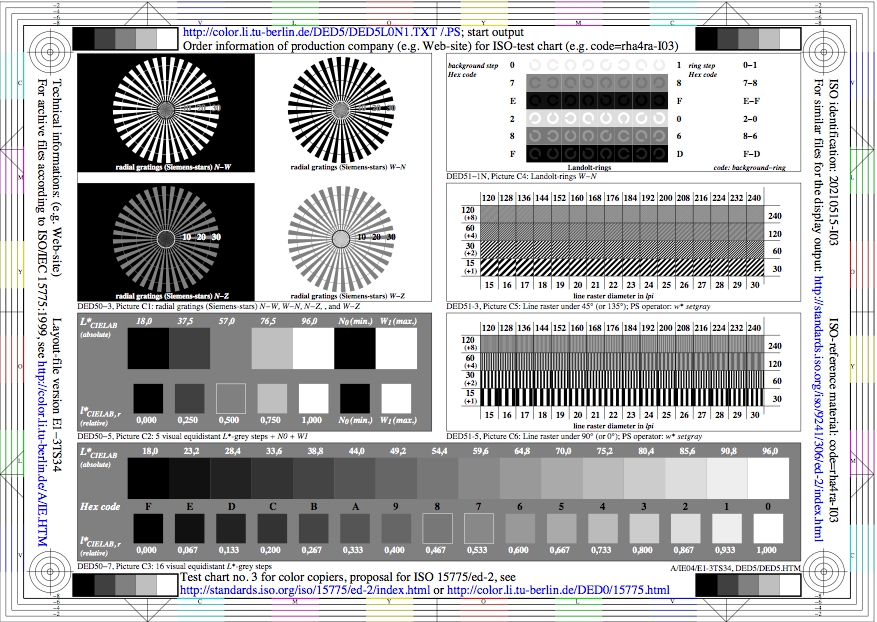
Figure DED5L0N1.jpg: Output in format A6 of the file
DED5L0NP.PDF, see
DED5L0N1.
PS /
TXT /
PDF /
jpg
DED5: TUB-test chart DED5; Proposal for ISO/IEC 15775
ISO-test chart E1-3TSA34 similar to ISO/IEC 15775:1999
TUB-test chart 3 with 6 achromatic figures
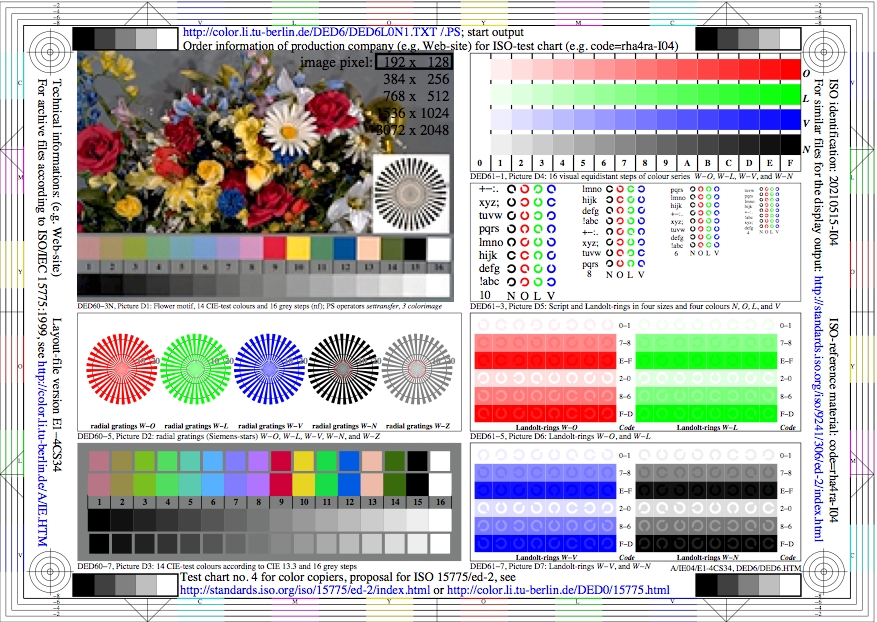
Figure DED6L0N1.jpg: Output in format A6 of the file
DED6L0NP.PDF, see
DED6L0N1.
PS /
TXT /
PDF /
jpg
DED6: TUB-test chart DED6; Proposal for ISO/IEC 15775
ISO-test chart E1-4CSA34 similar to ISO/IEC 15775:1999
TUB-test chart 4 with 7 chromatic figures

Figure DED7L0N1.jpg: Output in format A6 of the file
DED7L0NP.PDF, see
DED7L0N1.
PS /
TXT /
PDF /
jpg
DED7: TUB-test chart DED7; Proposal for ISO/IEC 15775
ISO-test chart AE49 according to ISO 9241-306:2018
TUB-test chart with 1080 colours for output linearisation
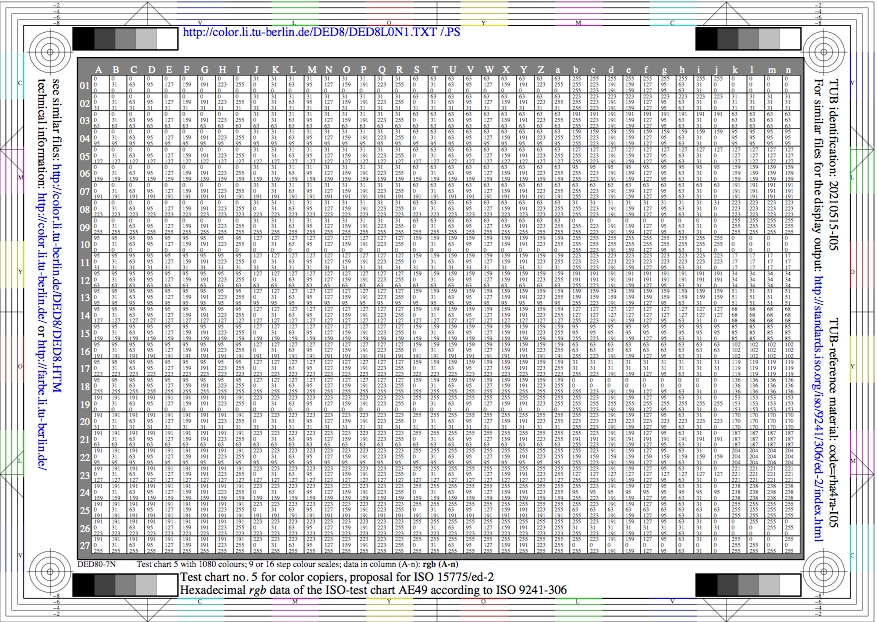
Figure DED8L0N1.jpg: Output in format A6 of the file
DED8L0NP.PDF, see
DED8L0N1.
PS /
TXT /
PDF /
jpg
DED8: TUB-test chart DED8; Proposal for ISO/IEC 15775
ISO-test chart AE49 according to ISO 9241-306:2018
Table with 1080 hexadecimal rgb data
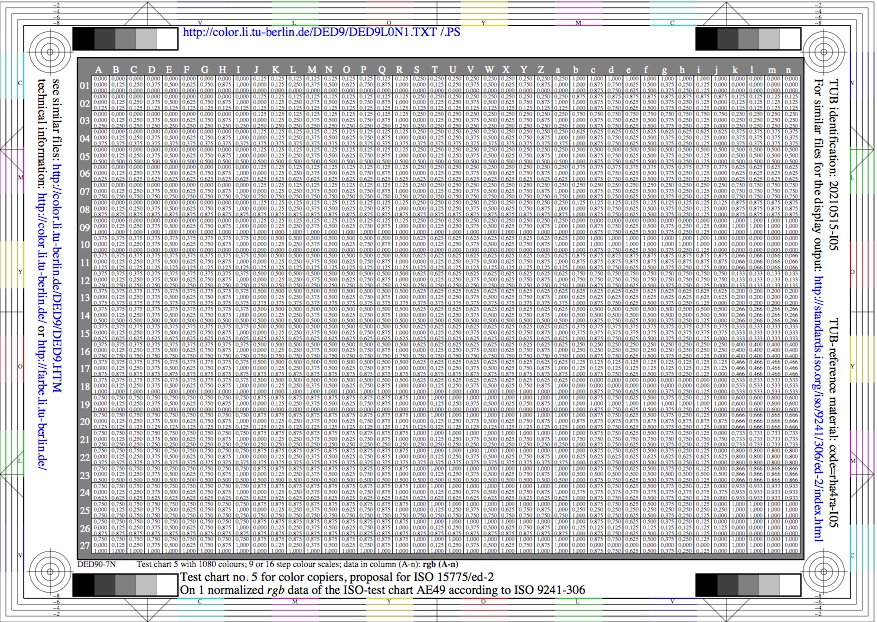
Figure DED9L0N1.jpg: Output in format A6 of the file
DED9L0NP.PDF, see
DED9L0N1.
PS /
TXT /
PDF /
jpg
DED9: TUB-test chart DED9; Proposal for ISO/IEC 15775
ISO-test chart AE49 according to ISO 9241-306:2018
Table of the 1080 rgb data normalized to 1

Figure DEE0L0N1.jpg: Output in format A6 of the file
DEE0L0NP.PDF, see
DEE0L0N1.
PS /
TXT /
PDF /
jpg
DEE0: TUB-test chart DEE0; Proposal for ISO/IEC 15775
ISO-test chart E2-2CSA34 similar to ISO/IEC 15775:1999
TUB-test chart 2 with 7 chromatic figures
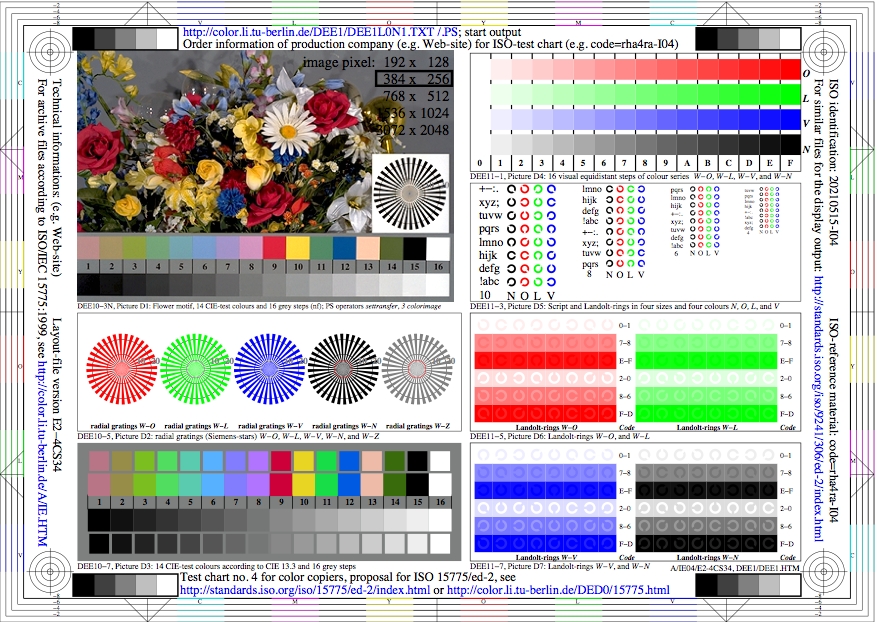
Figure DEE1L0N1.jpg: Output in format A6 of the file
DEE1L0NP.PDF, see
DEE1L0N1.
PS /
TXT /
PDF /
jpg
DEE1: TUB-test chart DEE1; Proposal for ISO/IEC 15775
ISO-test chart E2-4CSA34 similar to ISO/IEC 15775:1999
TUB-test chart 4 with 7 chromatic figures

Figure DEE2L0N1.jpg: Output in format A6 of the file
DEE2L0NP.PDF, see
DEE2L0N1.
PS /
TXT /
PDF /
jpg
DEE2: TUB-test chart DEE2; Proposal for ISO/IEC 15775
ISO-test chart E3-2CSA34 similar to ISO/IEC 15775:1999
TUB-test chart 2 with 7 chromatic figures

Figure DEE3L0N1.jpg: Output in format A6 of the file
DEE3L0NP.PDF, see
DEE3L0N1.
PS /
TXT /
PDF /
jpg
DEE3: TUB-test chart DEE3; Proposal for ISO/IEC 15775
ISO-test chart E3-4CSA34 similar to ISO/IEC 15775:1999
TUB-test chart 4 with 7 chromatic figures

Figure DEE4L0N1.jpg: Output in format A6 of the file
DEE4L0NP.PDF, see
DEE4L0N1.
PS /
TXT /
PDF /
jpg
DEE4: TUB-test chart DEE4; Proposal for ISO/IEC 15775
ISO-test chart E4-2CSA34 similar to ISO/IEC 15775:1999
TUB-test chart 2 with 7 chromatic figures
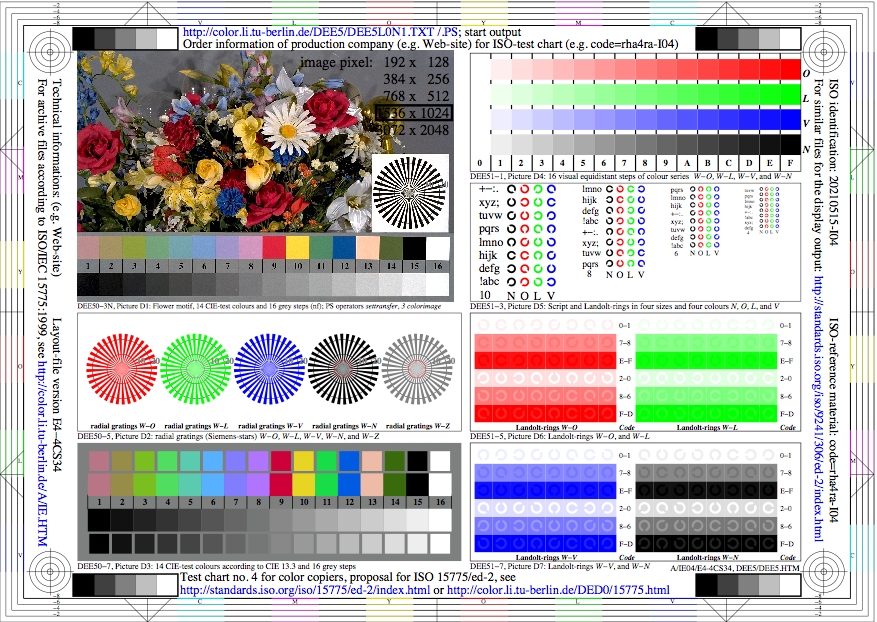
Figure DEE5L0N1.jpg: Output in format A6 of the file
DEE5L0NP.PDF, see
DEE5L0N1.
PS /
TXT /
PDF /
jpg
DEE5: TUB-test chart DEE5; Proposal for ISO/IEC 15775
ISO-test chart E4-4CSA34 similar to ISO/IEC 15775:1999
TUB-test chart 4 with 7 chromatic figures

Figure DEE6L0N1.jpg: Output in format A6 of the file
DEE6L0NP.PDF, see
DEE6L0N1.
PS /
TXT /
PDF /
jpg
DEE6: TUB-test chart DEE6; Proposal for ISO/IEC 15775
ISO-test chart AE49 according to ISO 9241-306:2018
TUB-test chart with 1080 colours for output linearisation
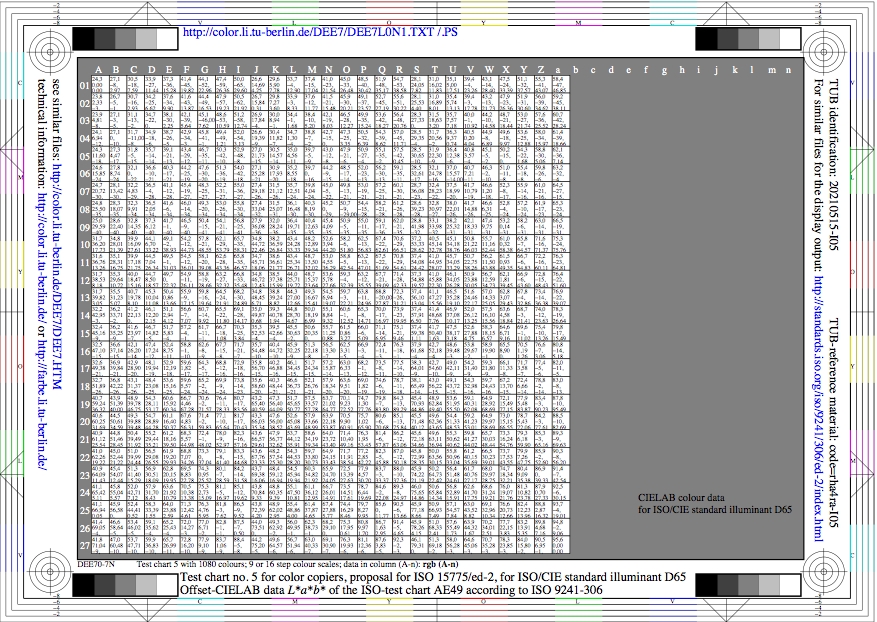
Figure DEE7L0N1.jpg: Output in format A6 of the file
DEE7L0NP.PDF, see
DEE7L0N1.
PS /
TXT /
PDF /
jpg
DEE7: TUB-test chart DEE7; Proposal for ISO/IEC 15775
ISO-test chart AE49 according to ISO 9241-306:2018
Table with 729 L*a*b* data for standard illuminant D65
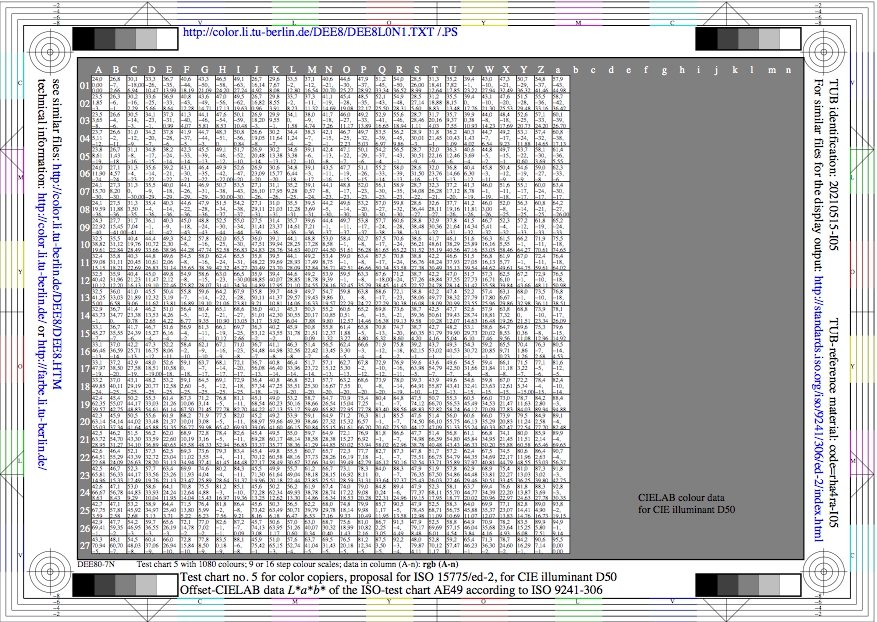
Figure DEE8L0N1.jpg: Output in format A6 of the file
DEE8L0NP.PDF, see
DEE8L0N1.
PS /
TXT /
PDF /
jpg
DEE8: TUB-test chart DEE8; Proposal for ISO/IEC 15775
ISO-test chart AE49 according to ISO 9241-306:2018
Table with 729 L*a*b* data for CIE illuminant D50
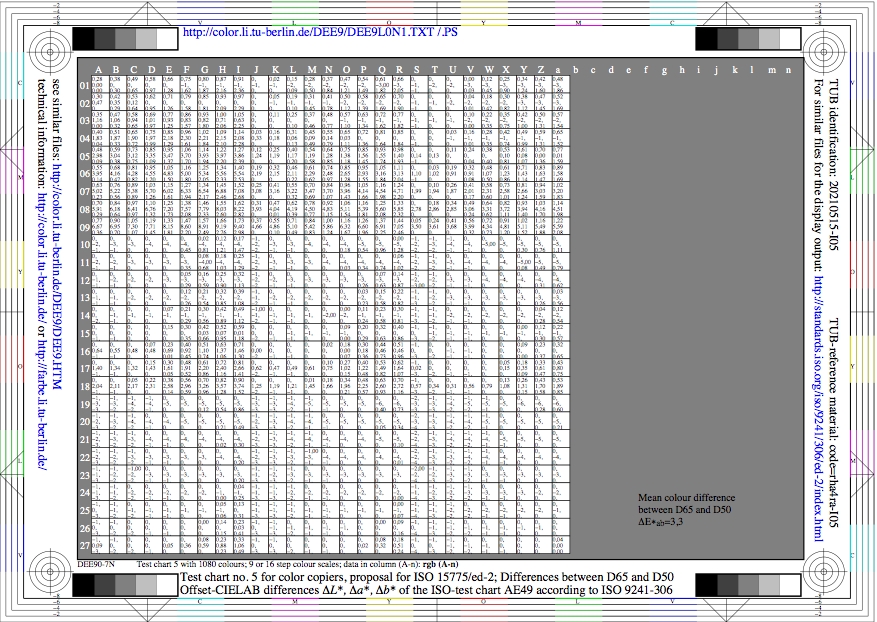
Figure DEE9L0N1.jpg: Output in format A6 of the file
DEE9L0NP.PDF, see
DEE9L0N1.
PS /
TXT /
PDF /
jpg
DEE9: TUB-test chart DEE9; Proposal for ISO/IEC 15775
ISO-test chart AE49 according to ISO 9241-306:2018
Table with 729 L*a*b* differences between D65 and D50

Figure DEF0L0N1.jpg: Output in format A6 of the file
DEF0L0NP.PDF, see
DEF0L0N1.
PS /
TXT /
PDF /
jpg
DEF0: TUB-test chart DEF0; Ostwald-optimal colours
YN=3,6, YW=90, CIE illuminant D65, CIE 02 degree
XYZ data, wavelength limits, and 8 colour diagrams
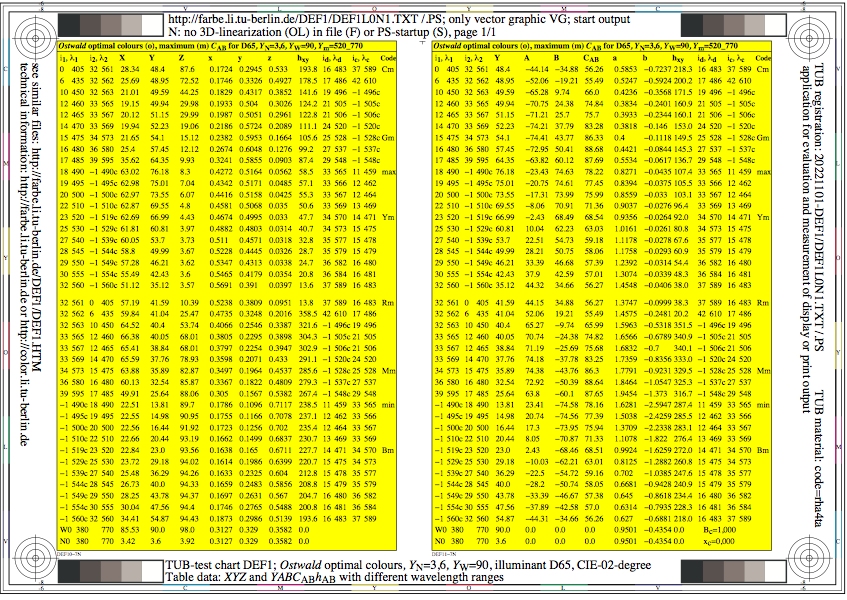
Figure DEF1L0N1.jpg: Output in format A6 of the file
DEF1L0NP.PDF, see
DEF1L0N1.
PS /
TXT /
PDF /
jpg
DEF1: TUB-test chart DEF1; Ostwald-optimal colours
YN=3,6, YW=90, CIE illuminant D65, CIE 02 degree
Table data XYZ and YABCh with wavelength limits
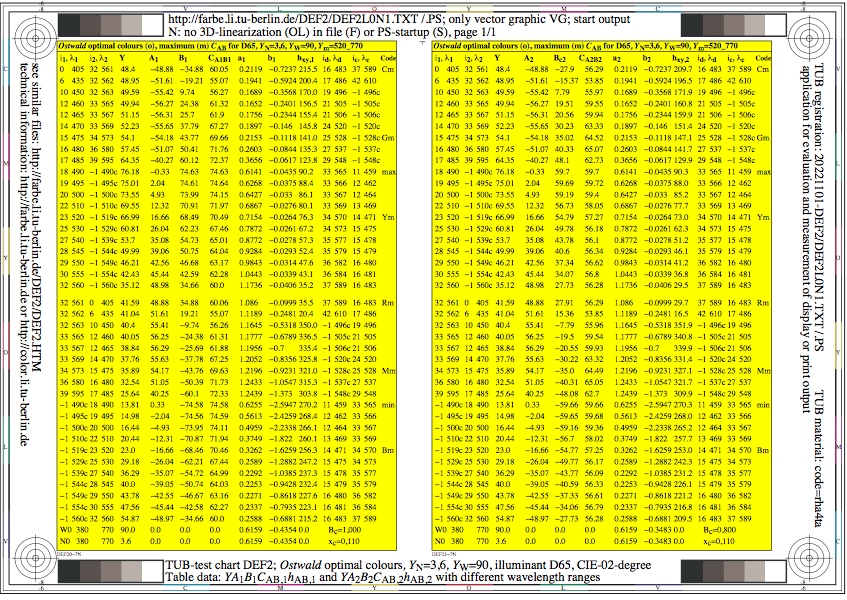
Figure DEF2L0N1.jpg: Output in format A6 of the file
DEF2L0NP.PDF, see
DEF2L0N1.
PS /
TXT /
PDF /
jpg
DEF2: TUB-test chart DEF2; Ostwald-optimal colours
YN=3,6, YW=90, CIE illuminant D65, CIE 02 degree
Table data YABCh1 and YABCh2 with wavelength limits

Figure DEF3L0N1.jpg: Output in format A6 of the file
DEF3L0NP.PDF, see
DEF3L0N1.
PS /
TXT /
PDF /
jpg
DEF3: TUB-test chart DEF3; Ostwald-optimal colours
YN=3,6, YW=90, CIE illuminant D50, CIE 02 degree
XYZ data, wavelength limits, and 8 colour diagrams
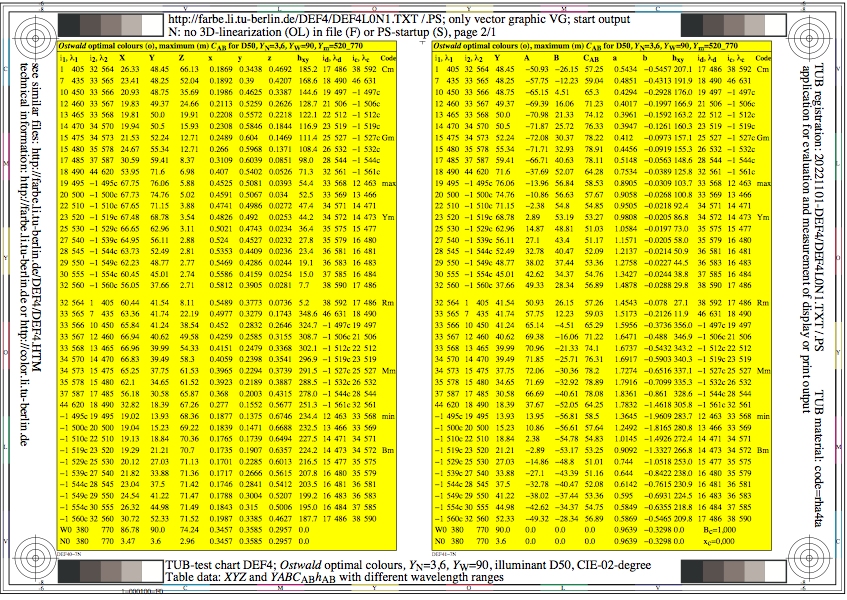
Figure DEF4L0N1.jpg: Output in format A6 of the file
DEF4L0NP.PDF, see
DEF4L0N1.
PS /
TXT /
PDF /
jpg
DEF4: TUB-test chart DEF4; Ostwald-optimal colours
YN=3,6, YW=90, CIE illuminant D50, CIE 02 degree
Table data XYZ and YABCh with wavelength limits
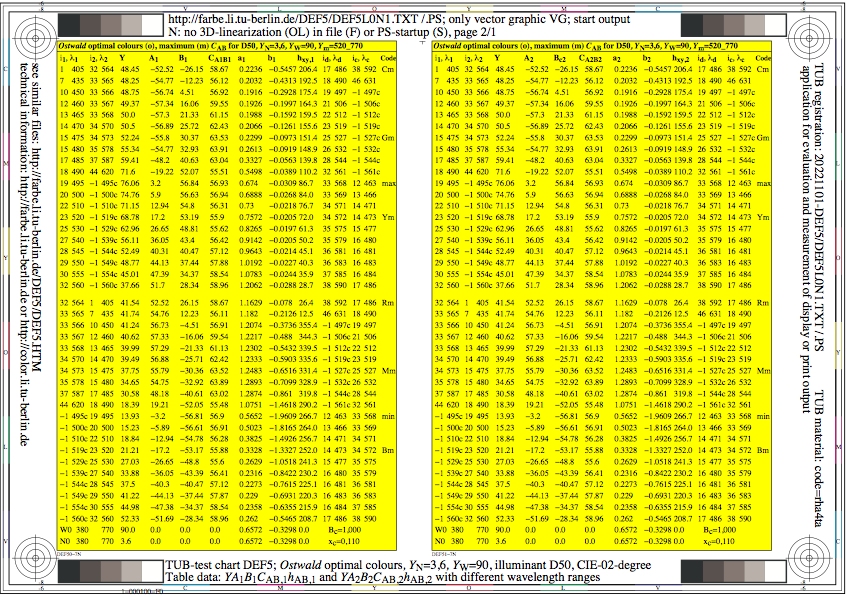
Figure DEF5L0N1.jpg: Output in format A6 of the file
DEF5L0NP.PDF, see
DEF5L0N1.
PS /
TXT /
PDF /
jpg
DEF5: TUB-test chart DEF5; Ostwald-optimal colours
YN=3,6, YW=90, CIE illuminant D50, CIE 02 degree
Table data YABCh1 and YABCh2 with wavelength limits

Figure DEF6L0N1.jpg: Output in format A6 of the file
DEF6L0NP.PDF, see
DEF6L0N1.
PS /
TXT /
PDF /
jpg
DEF6: TUB-test chart DEF6; Ostwald-optimal colours
YN=3,6, YW=90, CIE illuminant A, CIE 02 degree
XYZ data, wavelength limits, and 8 colour diagrams
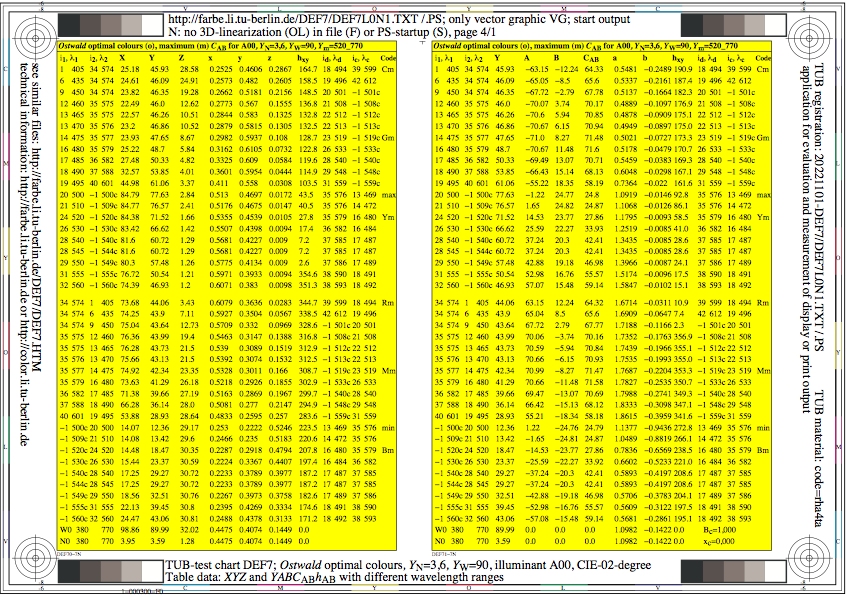
Figure DEF7L0N1.jpg: Output in format A6 of the file
DEF7L0NP.PDF, see
DEF7L0N1.
PS /
TXT /
PDF /
jpg
DEF7: TUB-test chart DEF7; Ostwald-optimal colours
YN=3,6, YW=90, CIE illuminant A, CIE 02 degree
Table data XYZ and YABCh with wavelength limits
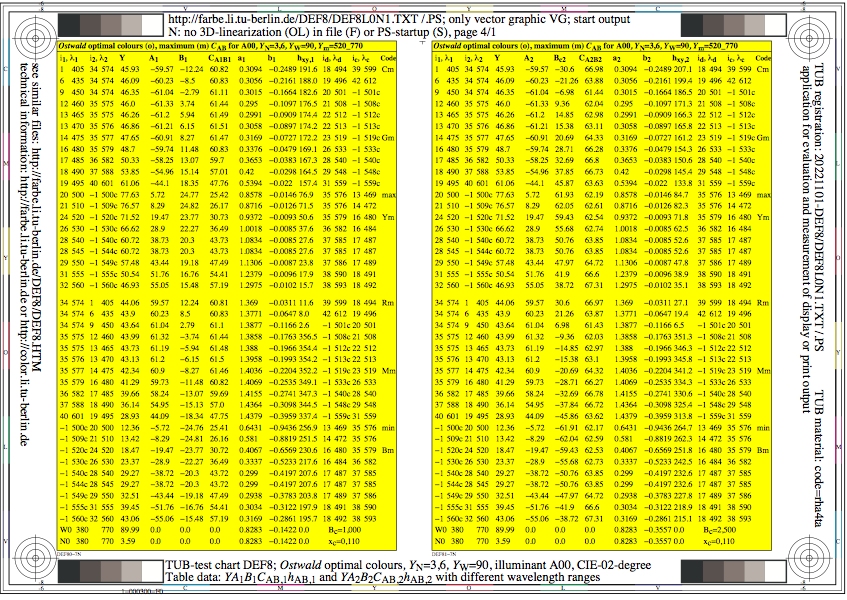
Figure DEF8L0N1.jpg: Output in format A6 of the file
DEF8L0NP.PDF, see
DEF8L0N1.
PS /
TXT /
PDF /
jpg
DEF8: TUB-test chart DEF8; Ostwald-optimal colours
YN=3,6, YW=90, CIE illuminant A, CIE 02 degree
Table data YABCh1 and YABCh2 with wavelength limits

Figure DEF9L0N1.jpg: Output in format A6 of the file
DEF9L0NP.PDF, see
DEF9L0N1.
PS /
TXT /
PDF /
jpg
DEF9: TUB-test chart DEF9; 8 spectral radiations of Pxx and Dxx
and Dxx for calculation of Ostwald optimal colours;
wavelength limits by (x,y)400,700; CIE 02-degree observer
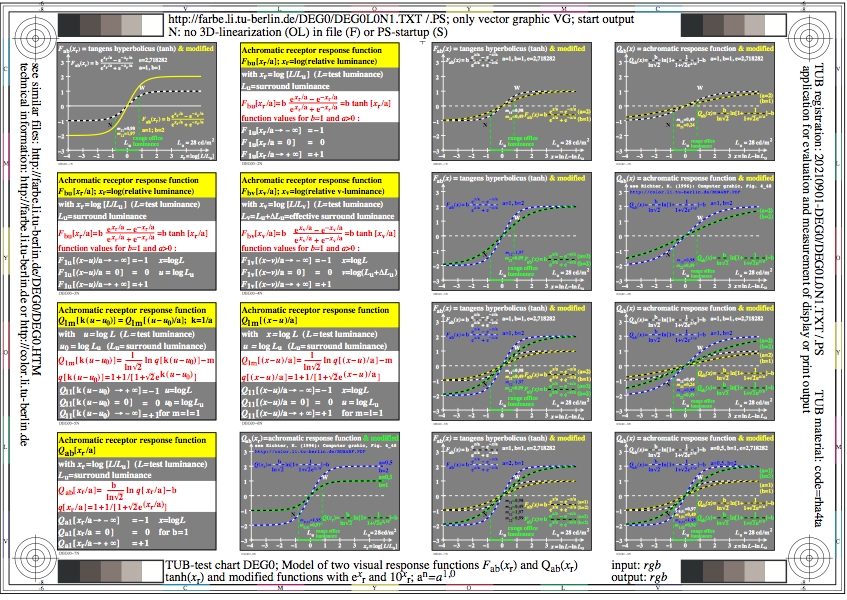
Figure DEG0L0N1.jpg: Output in format A6 of the file
DEG0L0NP.PDF, see
DEG0L0N1.
PS /
TXT /
PDF /
jpg
DEG0: TUB-test chart DEG0; Comparison of Qab(xr) & Fab(xr)
Line elements, contrast, and lightness
Comparison of the model functions

Figure DEG1L0N1.jpg: Output in format A6 of the file
DEG1L0NP.PDF, see
DEG1L0N1.
PS /
TXT /
PDF /
jpg
DEG1: TUB-test chart DEG1; Qab(xr)-model for visual responses
ln(xr) with e^xr/a and 10^xr/a'
a'=a ln(10); a^n = a^1,0
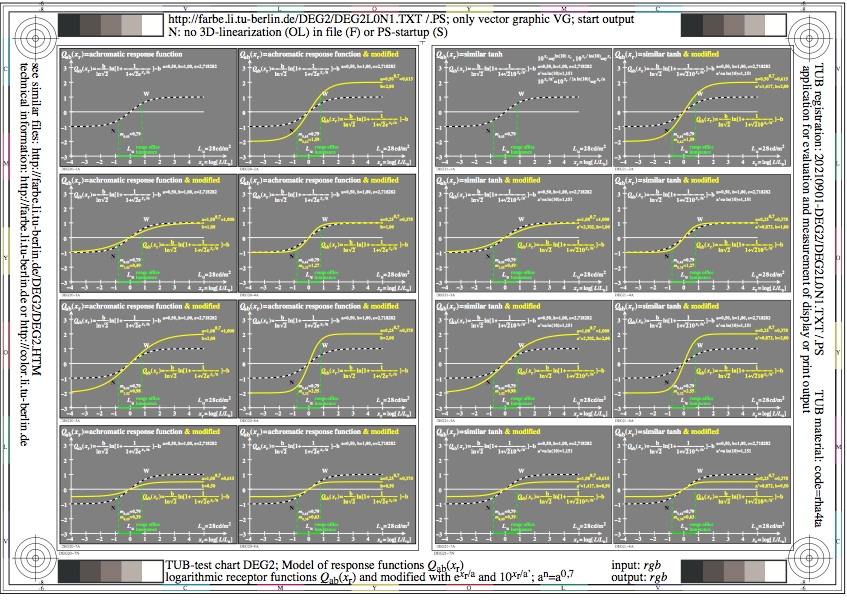
Figure DEG2L0N1.jpg: Output in format A6 of the file
DEG2L0NP.PDF, see
DEG2L0N1.
PS /
TXT /
PDF /
jpg
DEG2: TUB-test chart DEG2; Qab(xr)-model for visual responses
ln(xr) with e^xr/a and 10^xr/a'
a'=a ln(10); a^n = a^0,7
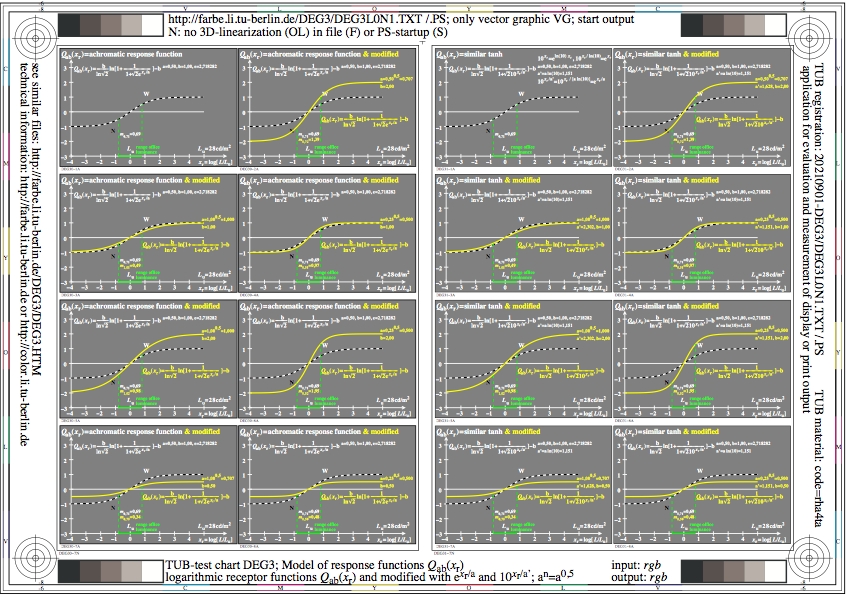
Figure DEG3L0N1.jpg: Output in format A6 of the file
DEG3L0NP.PDF, see
DEG3L0N1.
PS /
TXT /
PDF /
jpg
DEG3: TUB-test chart DEG3; Qab(xr)-model for visual responses
ln(xr) with e^xr/a and 10^xr/a'
a'=a ln(10); a^n = a^0,5

Figure DEG4L0N1.jpg: Output in format A6 of the file
DEG4L0NP.PDF, see
DEG4L0N1.
PS /
TXT /
PDF /
jpg
DEG4: TUB-test chart DEG4; Qab(xr)-model for visual responses
derivation of the responses; ln(xr) with e^xr/a and 10^xr/a'
a'=a ln(10); a^n = a^1,0
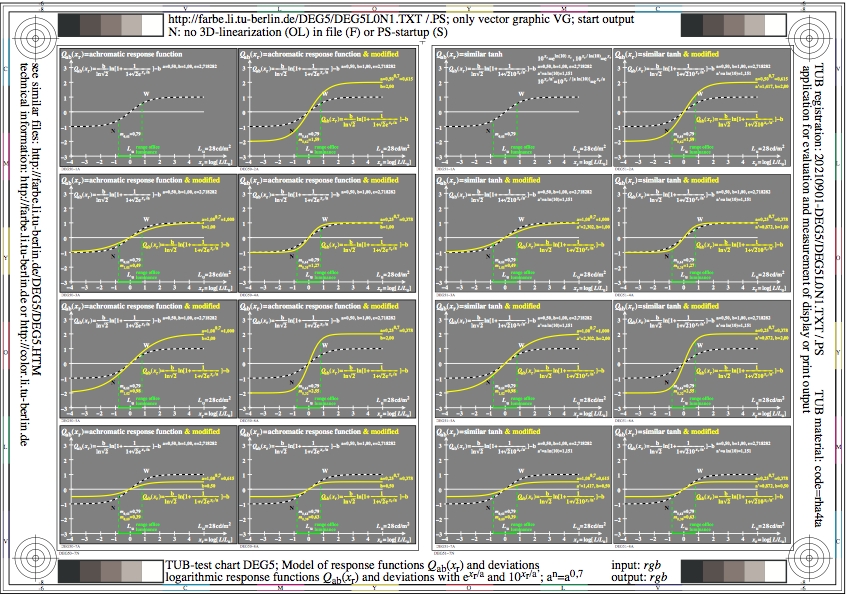
Figure DEG5L0N1.jpg: Output in format A6 of the file
DEG5L0NP.PDF, see
DEG5L0N1.
PS /
TXT /
PDF /
jpg
DEG5: TUB-test chart DEG5; Qab(xr)-model for visual responses
derivation of the responses; ln(xr) with e^xr/a and 10^xr/a'
a'=a ln(10); a^n = a^0,7
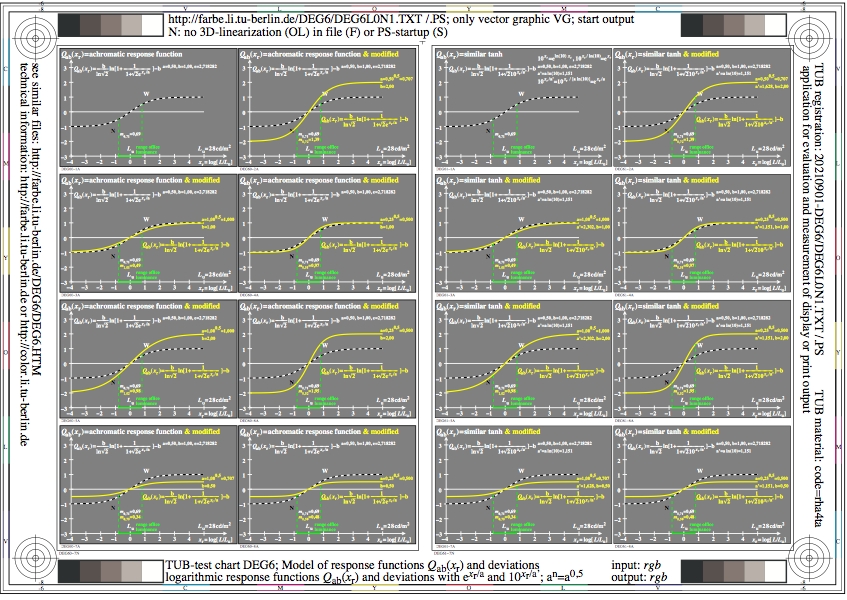
Figure DEG6L0N1.jpg: Output in format A6 of the file
DEG6L0NP.PDF, see
DEG6L0N1.
PS /
TXT /
PDF /
jpg
DEG6: TUB-test chart DEG6; Qab(xr)-model for visual responses
derivation of the responses; ln(xr) with e^xr/a and 10^xr/a'
a'=a ln(10); a^n = a^0,5

Figure DEG7L0N1.jpg: Output in format A6 of the file
DEG7L0NP.PDF, see
DEG7L0N1.
PS /
TXT /
PDF /
jpg
DEG7: TUB-test chart DEG7; Qab(xr)-model for visual responses
derivation of the responses; ln(xr) with e^xr/a and 10^xr/a'
a'=a ln(10); a^n = a^1,0

Figure DEG8L0N1.jpg: Output in format A6 of the file
DEG8L0NP.PDF, see
DEG8L0N1.
PS /
TXT /
PDF /
jpg
DEG8: TUB-test chart DEG8; Qab(xr)-model for visual responses
derivation of the responses; ln(xr) with e^xr/a and 10^xr/a'
a'=a ln(10); a^n = a^0,7
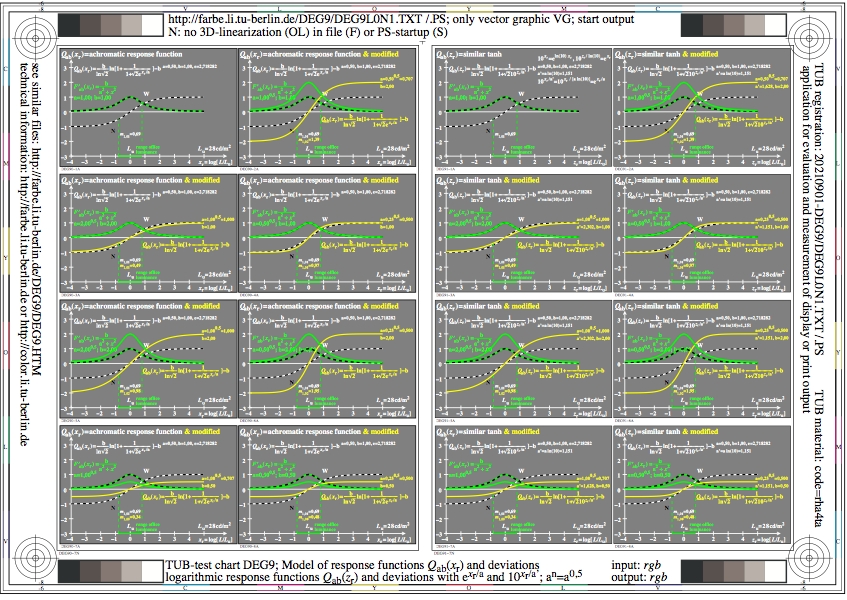
Figure DEG9L0N1.jpg: Output in format A6 of the file
DEG9L0NP.PDF, see
DEG9L0N1.
PS /
TXT /
PDF /
jpg
DEG9: TUB-test chart DEG9; Qab(xr)-model for visual responses
derivation of the responses; ln(xr) with e^xr/a and 10^xr/a'
a'=a ln(10); a^n = a^0,5
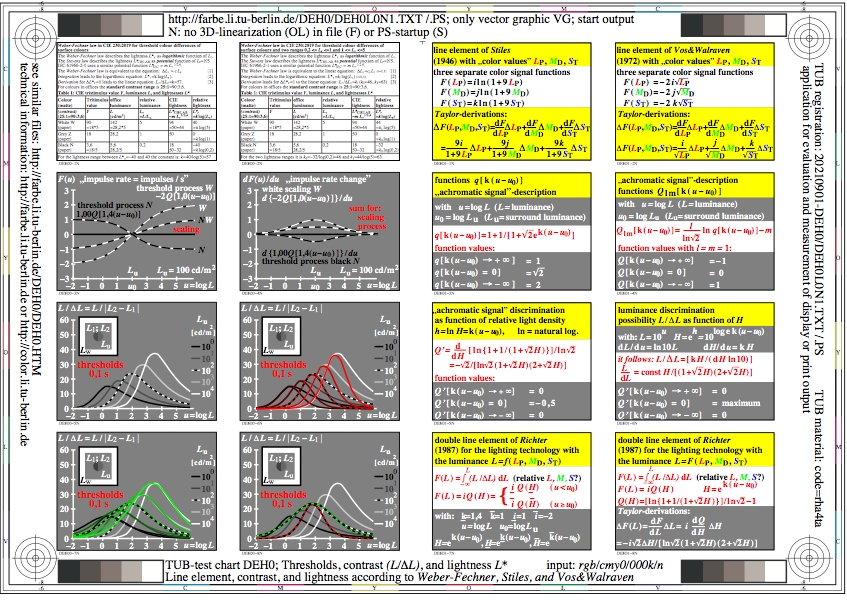
Figure DEH0L0N1.jpg: Output in format A6 of the file
DEH0L0NP.PDF, see
DEH0L0N1.
PS /
TXT /
PDF /
jpg
DEH0: TUB-test chart DEH0; Threshold, contrast, and lightness
Line elements, contrast, and lightness
of Weber-Fechner, Stiles, and Vos&Walraven

Figure DEH1L0N1.jpg: Output in format A6 of the file
DEH1L0NP.PDF, see
DEH1L0N1.
PS /
TXT /
PDF /
jpg
DEH1: TUB-test chart DEH1; Fab(xr)-model for visual responses
tanh(xr) with e^xr/a and 10^xr/a'
a'=a ln(10); a^n = a^1,0
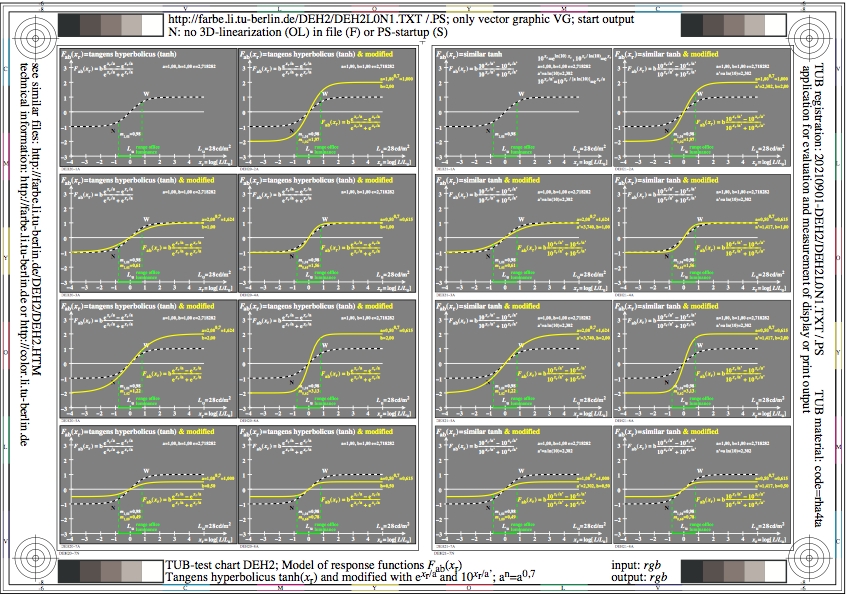
Figure DEH2L0N1.jpg: Output in format A6 of the file
DEH2L0NP.PDF, see
DEH2L0N1.
PS /
TXT /
PDF /
jpg
DEH2: TUB-test chart DEH2; Fab(xr)-model for visual responses
tanh(xr) with e^xr/a and 10^xr/a'
a'=a ln(10); a^n = a^0,7

Figure DEH3L0N1.jpg: Output in format A6 of the file
DEH3L0NP.PDF, see
DEH3L0N1.
PS /
TXT /
PDF /
jpg
DEH3: TUB-test chart DEH3; Fab(xr)-model for visual responses
tanh(xr) with e^xr/a and 10^xr/a'
a'=a ln(10); a^n = a^0,5
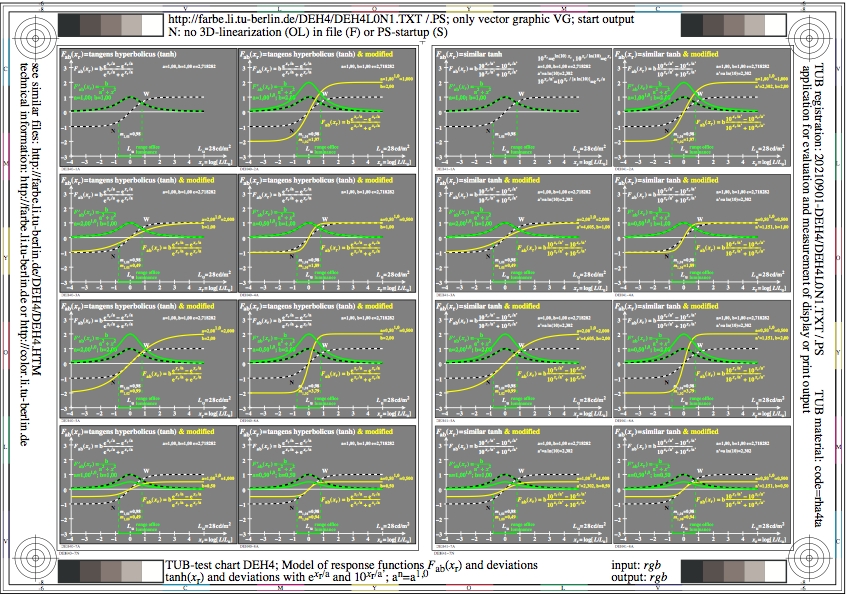
Figure DEH4L0N1.jpg: Output in format A6 of the file
DEH4L0NP.PDF, see
DEH4L0N1.
PS /
TXT /
PDF /
jpg
DEH4: TUB-test chart DEH4; Fab(xr)-model for visual responses
derivation of the responses; tanh(xr) with e^xr/a and 10^xr/a'
a'=a ln(10); a^n = a^1,0

Figure DEH5L0N1.jpg: Output in format A6 of the file
DEH5L0NP.PDF, see
DEH5L0N1.
PS /
TXT /
PDF /
jpg
DEH5: TUB-test chart DEH5; Fab(xr)-model for visual responses
derivation of the responses; tanh(xr) with e^xr/a and 10^xr/a'
a'=a ln(10); a^n = a^0,7
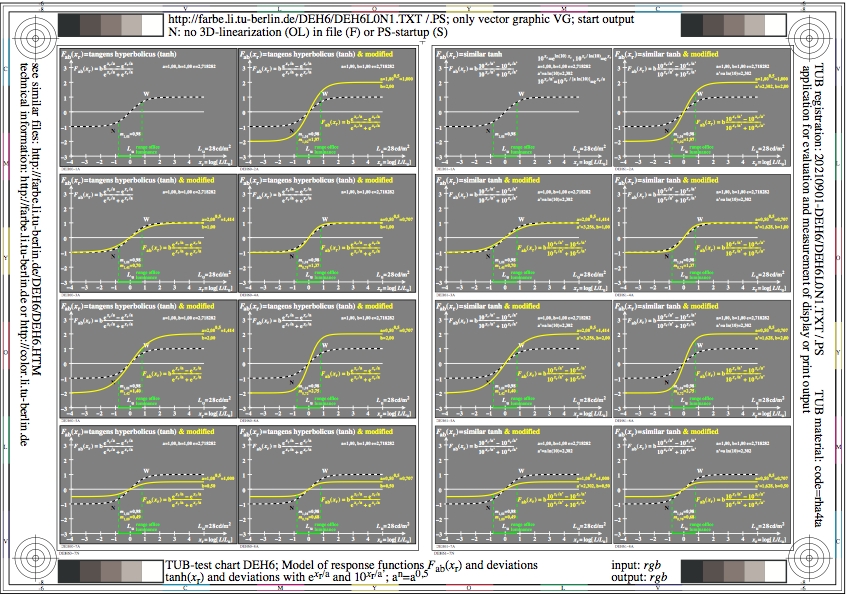
Figure DEH6L0N1.jpg: Output in format A6 of the file
DEH6L0NP.PDF, see
DEH6L0N1.
PS /
TXT /
PDF /
jpg
DEH6: TUB-test chart DEH6; Fab(xr)-model for visual responses
derivation of the responses; tanh(xr) with e^xr/a and 10^xr/a'
a'=a ln(10); a^n = a^0,5
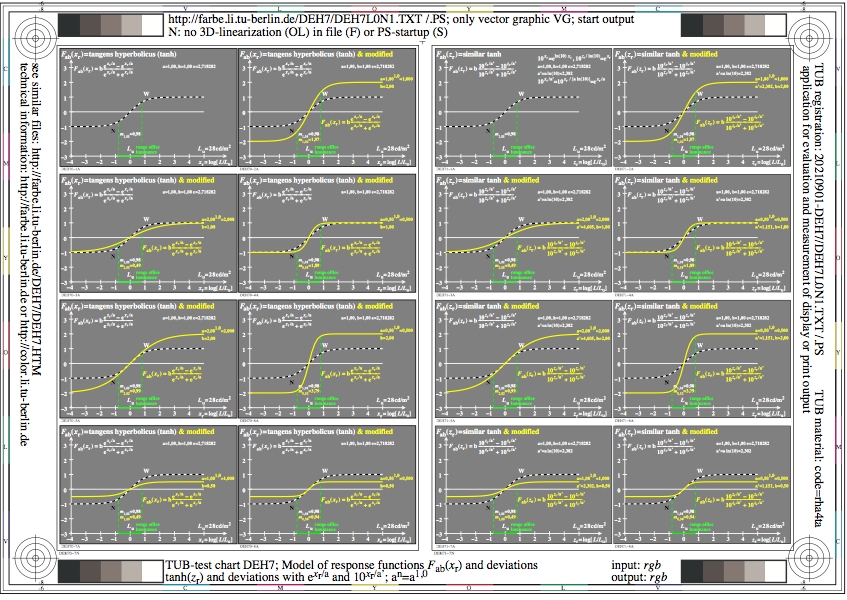
Figure DEH7L0N1.jpg: Output in format A6 of the file
DEH7L0NP.PDF, see
DEH7L0N1.
PS /
TXT /
PDF /
jpg
DEH7: TUB-test chart DEH7; Fab(xr)-model for visual responses
derivation of the responses; tanh(zr) with 10^zr instead of e^zr
a'=a ln(10); a^n = a^1,0
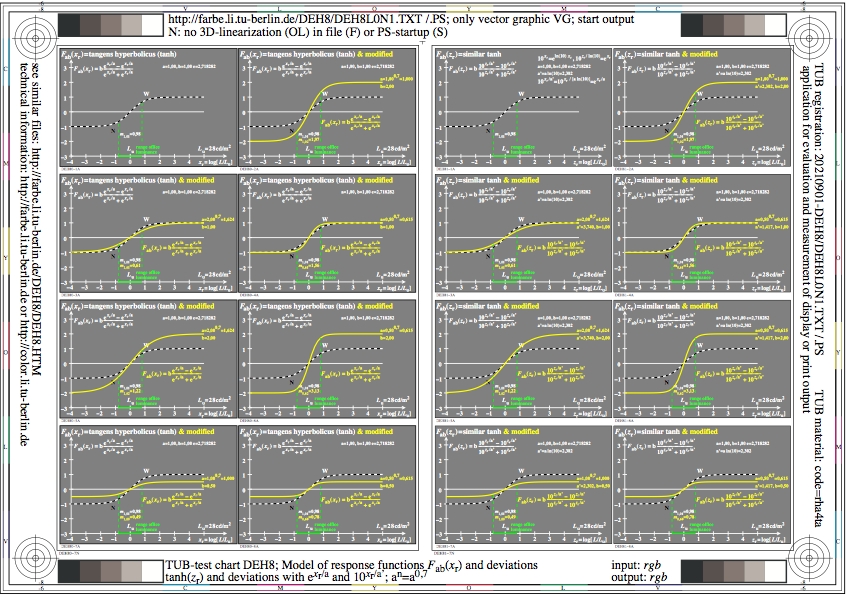
Figure DEH8L0N1.jpg: Output in format A6 of the file
DEH8L0NP.PDF, see
DEH8L0N1.
PS /
TXT /
PDF /
jpg
DEH8: TUB-test chart DEH8; Fab(xr)-model for visual responses
derivation of the responses; tanh(zr) with 10^zr instead of e^zr
a'=a ln(10); a^n = a^0,7
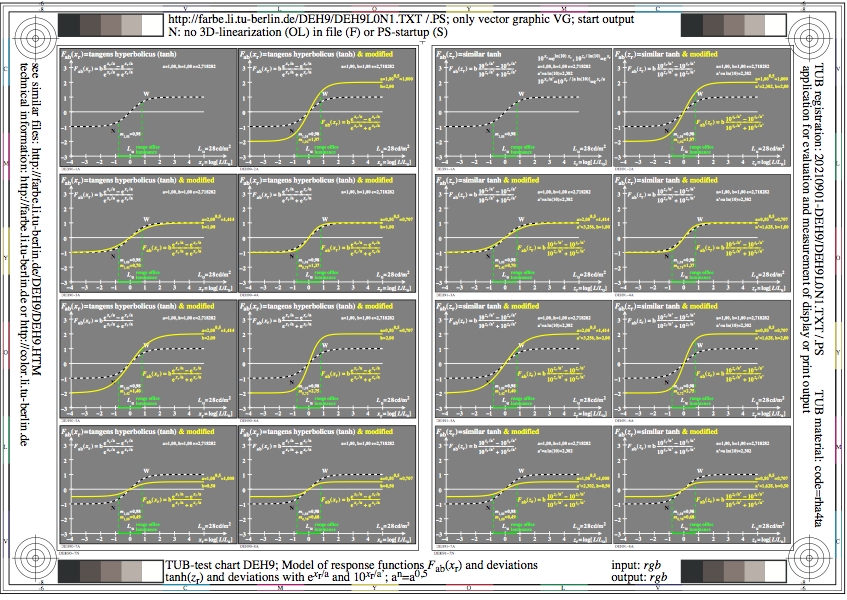
Figure DEH9L0N1.jpg: Output in format A6 of the file
DEH9L0NP.PDF, see
DEH9L0N1.
PS /
TXT /
PDF /
jpg
DEH9: TUB-test chart DEH9; Fab(xr)-model for visual responses
derivation of the responses; tanh(zr) with 10^zr instead of e^zr
a'=a ln(10); a^n = a^0,5
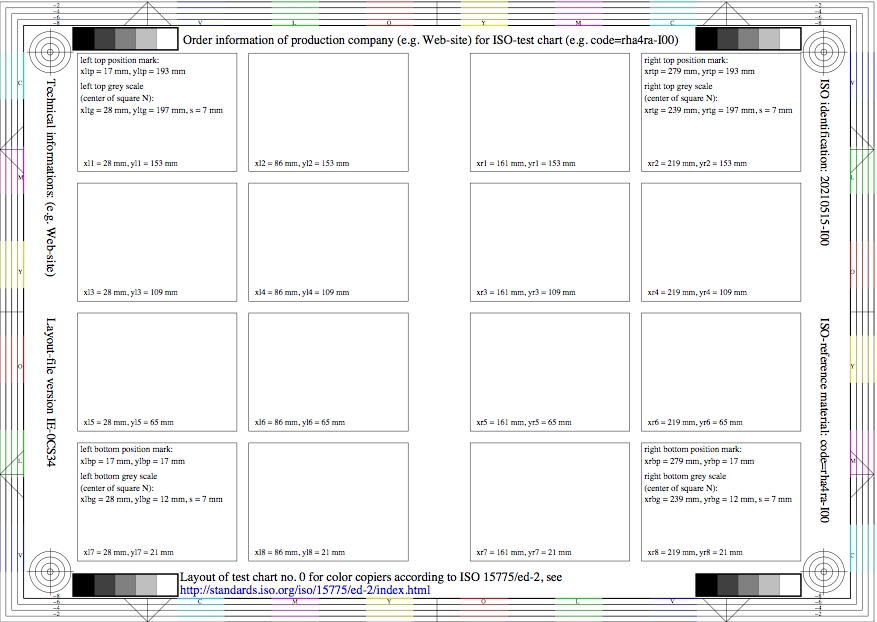
Figure DEI0L0N1.jpg: Output in format A6 of the file
DEI0L0NP.PDF, see
DEI0L0N1.
PS /
TXT /
PDF /
jpg
DEI0: TUB-test chart DEI0; Proposal for ISO/IEC 15775
ISO-test chart IE-0CSA34 similar to ISO/IEC 15775:1999
Layout with 16 figures and the (x,y) positions
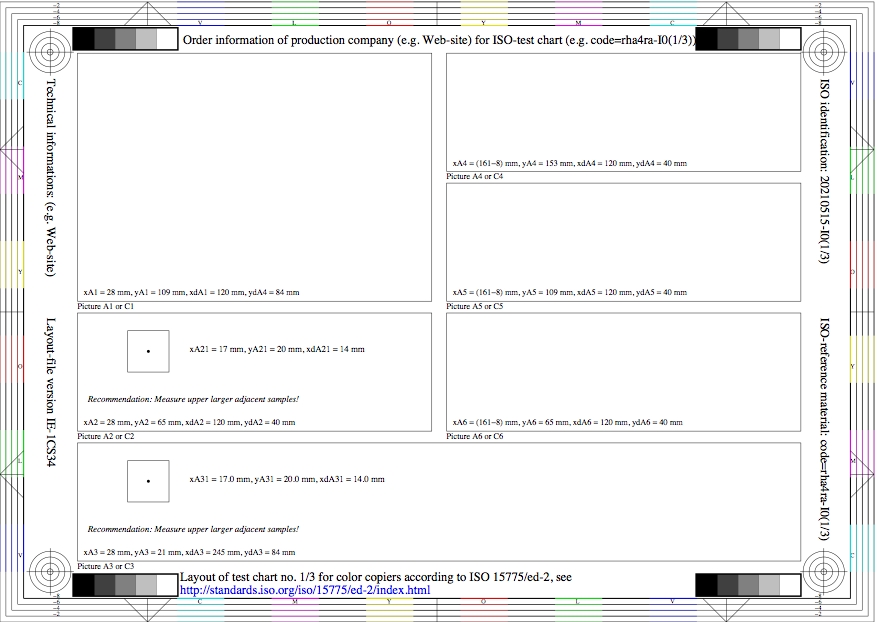
Figure DEI1L0N1.jpg: Output in format A6 of the file
DEI1L0NP.PDF, see
DEI1L0N1.
PS /
TXT /
PDF /
jpg
DEI1: TUB-test chart DEI1; Proposal for ISO/IEC 15775
ISO-test chart IE-1CSA34 similar to ISO/IEC 15775:1999
Layout with 6 figures and the (x,y) positions
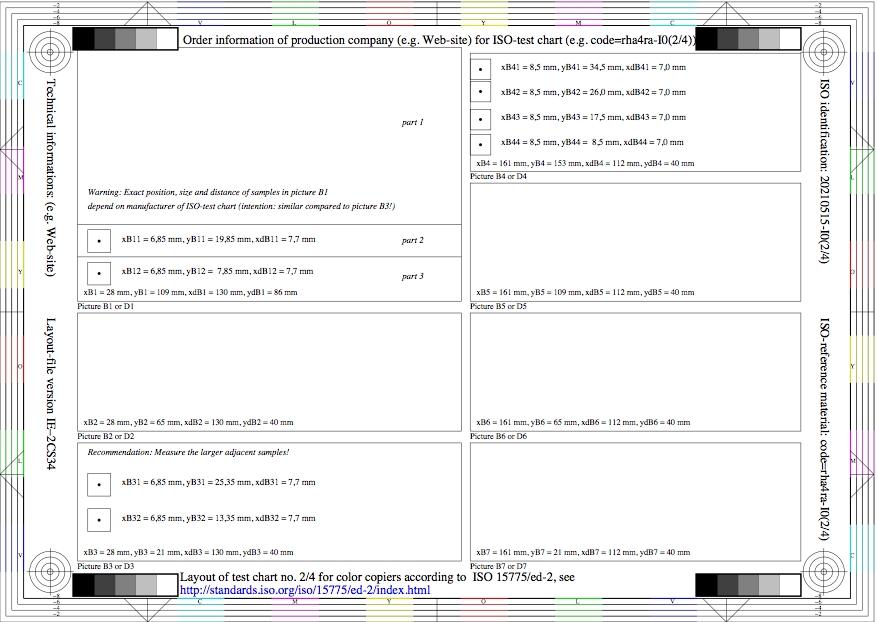
Figure DEI2L0N1.jpg: Output in format A6 of the file
DEI2L0NP.PDF, see
DEI2L0N1.
PS /
TXT /
PDF /
jpg
DEI2: TUB-test chart DEI2; Proposal for ISO/IEC 15775
ISO-test chart IE-2CSA34 similar to ISO/IEC 15775:1999
Layout with 7 figures and the (x,y) positions
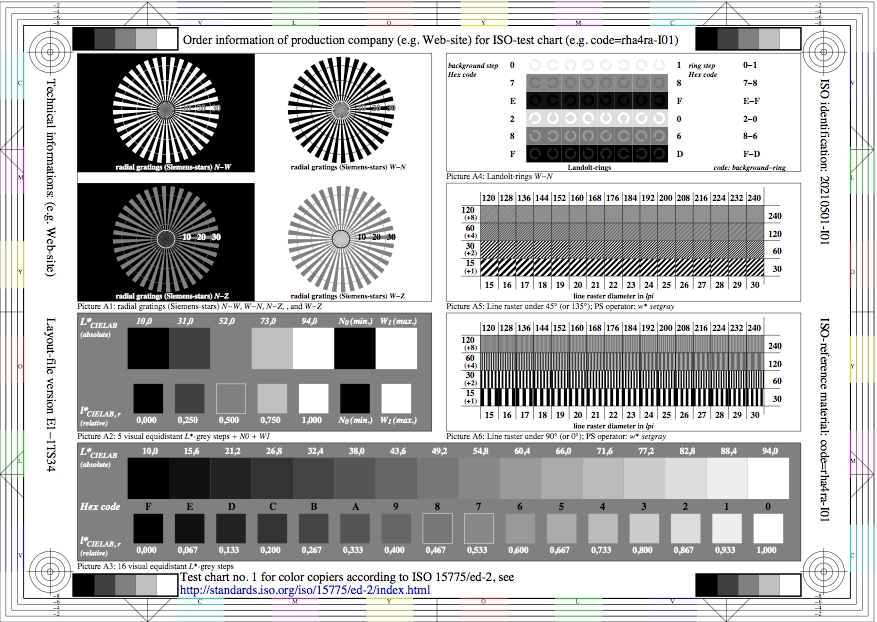
Figure DEI3L0N1.jpg: Output in format A6 of the file
DEI3L0NP.PDF, see
DEI3L0N1.
PS /
TXT /
PDF /
jpg
DEI3: TUB-test chart DEI3; Proposal for ISO/IEC 15775
ISO-test chart E1-1TSA34 similar to ISO/IEC 15775:1999
TUB-test chart 1 with 6 achromatic figures
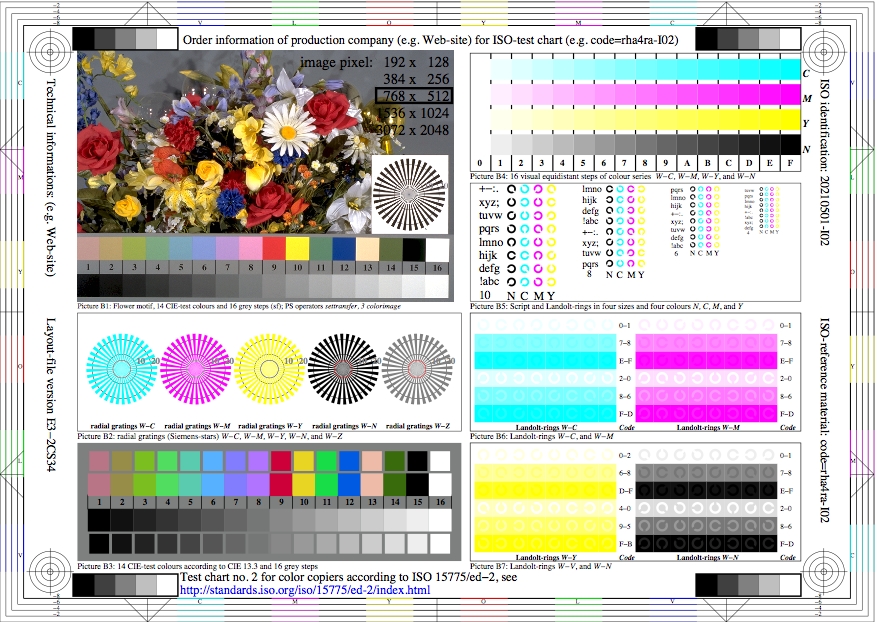
Figure DEI4L0N1.jpg: Output in format A6 of the file
DEI4L0NP.PDF, see
DEI4L0N1.
PS /
TXT /
PDF /
jpg
DEI4: TUB-test chart DEI4; Proposal for ISO/IEC 15775
ISO-test chart E3-2CSA34 similar to ISO/IEC 15775:1999
TUB-test chart 2 with 7 chromatic figures

Figure DEI5L0N1.jpg: Output in format A6 of the file
DEI5L0NP.PDF, see
DEI5L0N1.
PS /
TXT /
PDF /
jpg
DEI5: TUB-test chart DEI5; Proposal for ISO/IEC 15775
ISO-test chart E1-3TSA34 similar to ISO/IEC 15775:1999
TUB-test chart 1 with 6 achromatic figures
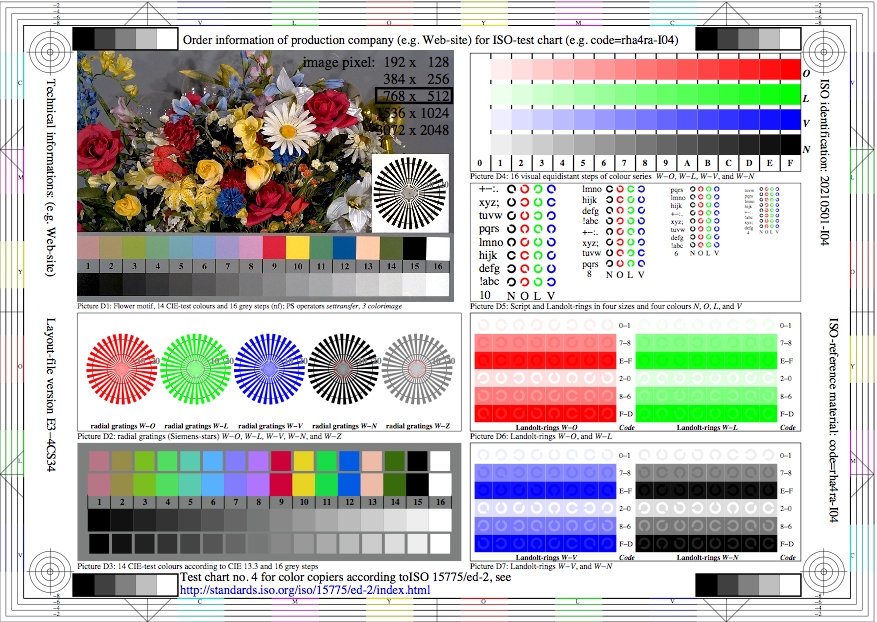
Figure DEI6L0N1.jpg: Output in format A6 of the file
DEI6L0NP.PDF, see
DEI6L0N1.
PS /
TXT /
PDF /
jpg
DEI6: TUB-test chart DEI6; Proposal for ISO/IEC 15775
ISO-test chart E3-4CSA34 similar to ISO/IEC 15775:1999
TUB-test chart 4 with 7 chromatic figures
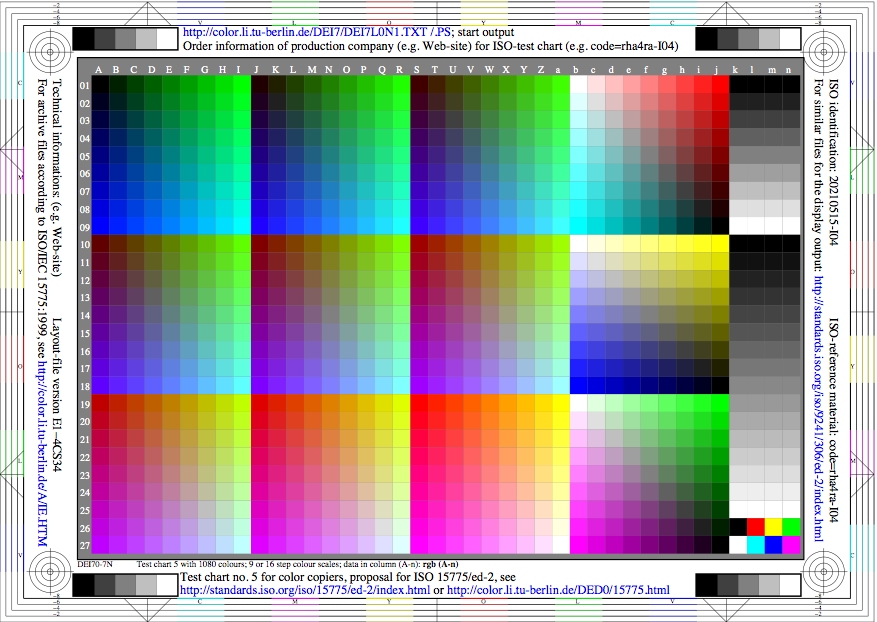
Figure DEI7L0N1.jpg: Output in format A6 of the file
DEI7L0NP.PDF, see
DEI7L0N1.
PS /
TXT /
PDF /
jpg
DEI7: TUB-test chart DEI7; Proposal for ISO/IEC 15775
ISO-test chart AE49 according to ISO 9241-306:2018
TUB-test chart with 1080 colours for output linearisation
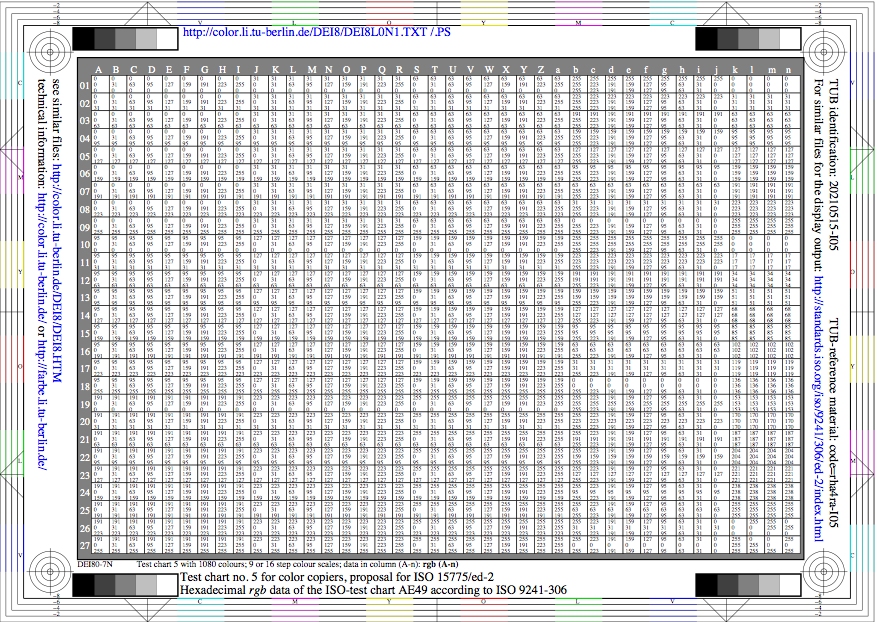
Figure DEI8L0N1.jpg: Output in format A6 of the file
DEI8L0NP.PDF, see
DEI8L0N1.
PS /
TXT /
PDF /
jpg
DEI8: TUB-test chart DEI8; Proposal for ISO/IEC 15775
ISO-test chart AE49 according to ISO 9241-306:2018
Table with 1080 hexadecimal rgb data
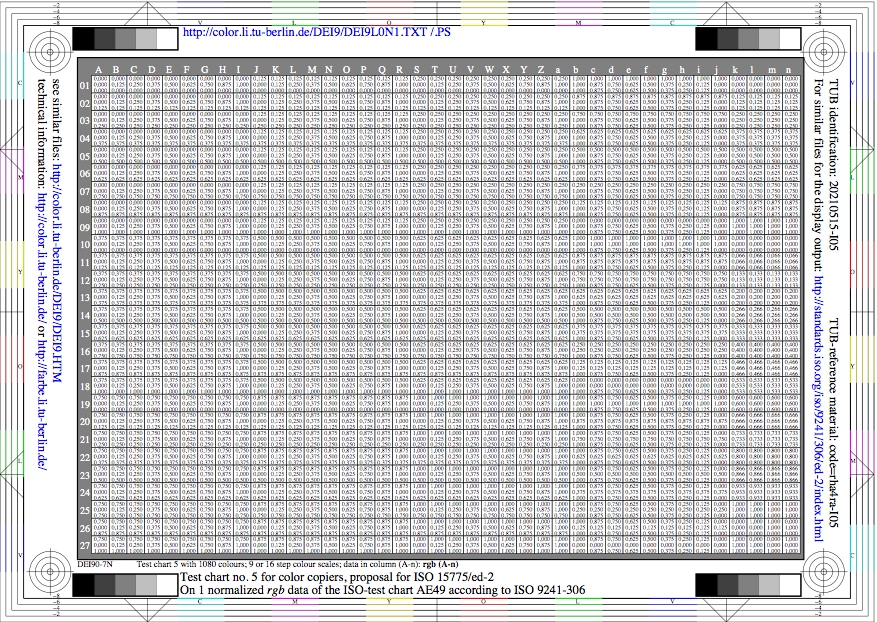
Figure DEI9L0N1.jpg: Output in format A6 of the file
DEI9L0NP.PDF, see
DEI9L0N1.
PS /
TXT /
PDF /
jpg
DEI9: TUB-test chart DEI9; Proposal for ISO/IEC 15775
ISO-test chart AE49 according to ISO 9241-306:2018
Table of the 1080 rgb data normalized to 1

Figure DEJ0L0N1.jpg: Output in format A6 of the file
DEJ0L0NP.PDF, see
DEJ0L0N1.
PS /
TXT /
PDF /
jpg
DEJ0: TUB-test chart DEJ0; Ostwald-optimal colours
YN=3,6, YW=90, CIE illuminant D65, CIE 10 degree
XYZ data, wavelength limits, and 8 colour diagrams

Figure DEJ1L0N1.jpg: Output in format A6 of the file
DEJ1L0NP.PDF, see
DEJ1L0N1.
PS /
TXT /
PDF /
jpg
DEJ1: TUB-test chart DEJ1; Ostwald-optimal colours
YN=3,6, YW=90, CIE illuminant D65, CIE 10 degree
Table data XYZ and YABCh with wavelength limits
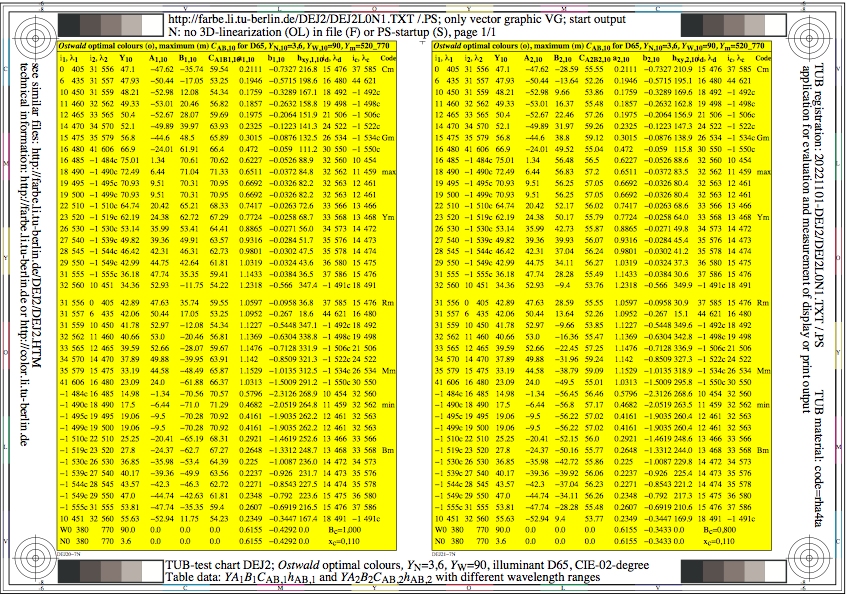
Figure DEJ2L0N1.jpg: Output in format A6 of the file
DEJ2L0NP.PDF, see
DEJ2L0N1.
PS /
TXT /
PDF /
jpg
DEJ2: TUB-test chart DEJ2; Ostwald-optimal colours
YN=3,6, YW=90, CIE illuminant D65, CIE 10 degree
Table data YABCh1 and YABCh2 with wavelength limits
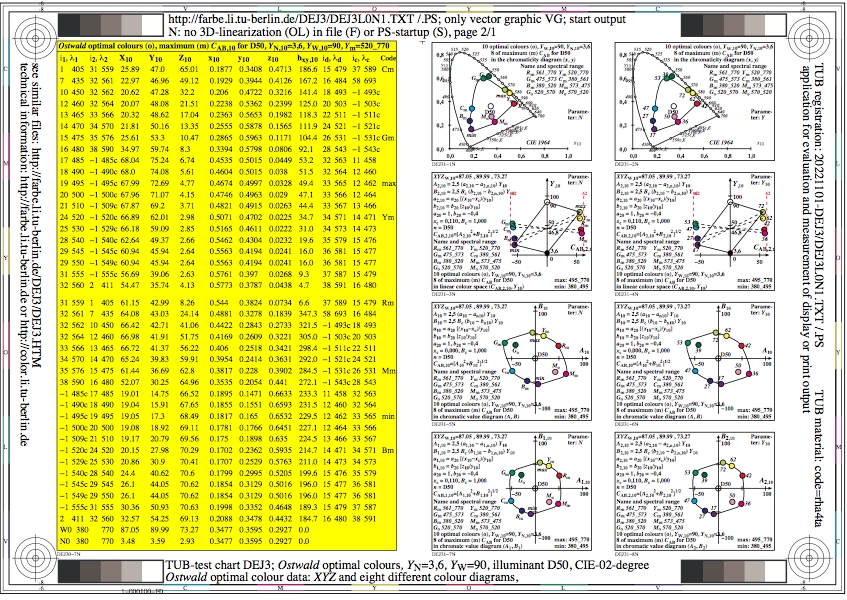
Figure DEJ3L0N1.jpg: Output in format A6 of the file
DEJ3L0NP.PDF, see
DEJ3L0N1.
PS /
TXT /
PDF /
jpg
DEJ3: TUB-test chart DEJ3; Ostwald-optimal colours
YN=3,6, YW=90, CIE illuminant D50, CIE 10 degree
XYZ data, wavelength limits, and 8 colour diagrams

Figure DEJ4L0N1.jpg: Output in format A6 of the file
DEJ4L0NP.PDF, see
DEJ4L0N1.
PS /
TXT /
PDF /
jpg
DEJ4: TUB-test chart DEJ4; Ostwald-optimal colours
YN=3,6, YW=90, CIE illuminant D50, CIE 10 degree
Table data XYZ and YABCh with wavelength limits

Figure DEJ5L0N1.jpg: Output in format A6 of the file
DEJ5L0NP.PDF, see
DEJ5L0N1.
PS /
TXT /
PDF /
jpg
DEJ5: TUB-test chart DEJ5; Ostwald-optimal colours
YN=3,6, YW=90, CIE illuminant D50, CIE 10 degree
Table data YABCh1 and YABCh2 with wavelength limits

Figure DEJ6L0N1.jpg: Output in format A6 of the file
DEJ6L0NP.PDF, see
DEJ6L0N1.
PS /
TXT /
PDF /
jpg
DEJ6: TUB-test chart DEJ6; Ostwald-optimal colours
YN=3,6, YW=90, CIE illuminant A, CIE 10 degree
XYZ data, wavelength limits, and 8 colour diagrams
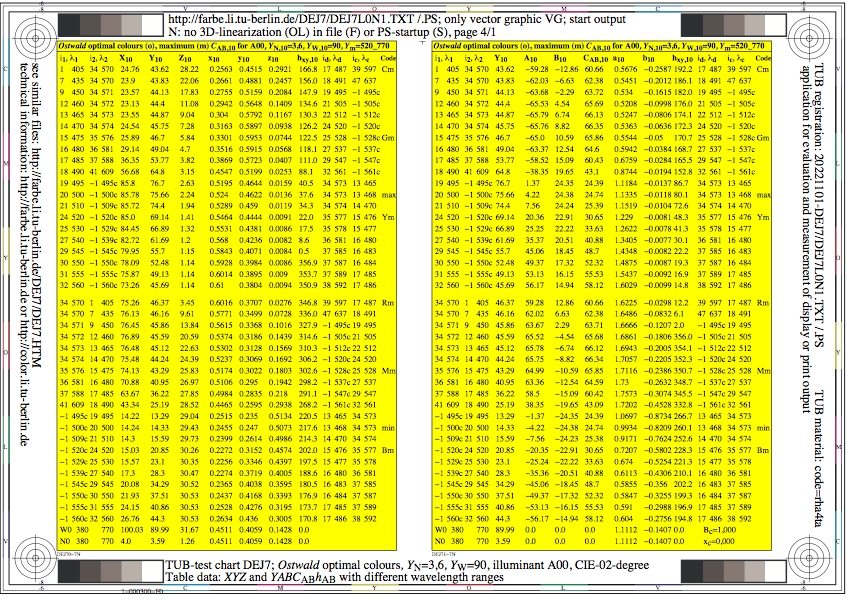
Figure DEJ7L0N1.jpg: Output in format A6 of the file
DEJ7L0NP.PDF, see
DEJ7L0N1.
PS /
TXT /
PDF /
jpg
DEJ7: TUB-test chart DEJ7; Ostwald-optimal colours
YN=3,6, YW=90, CIE illuminant A, CIE 10 degree
Table data XYZ and YABCh with wavelength limits
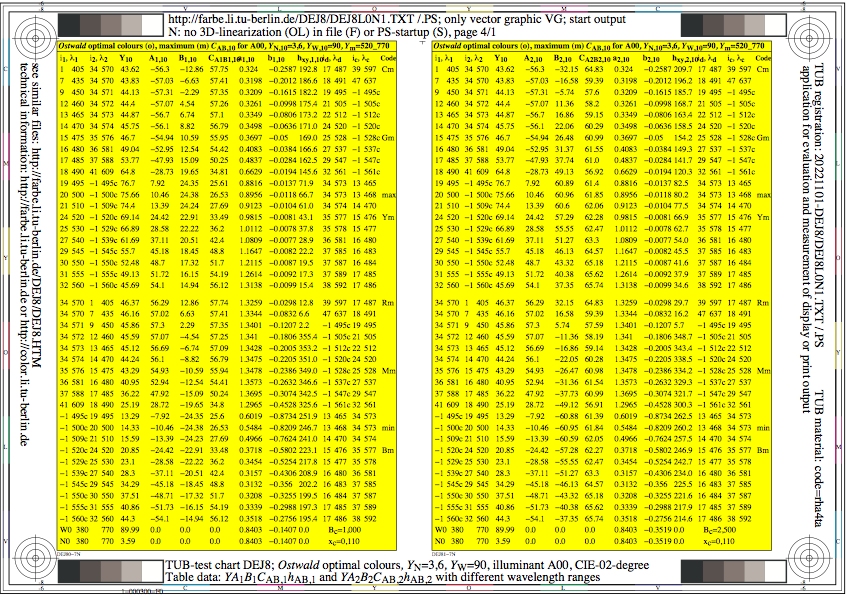
Figure DEJ8L0N1.jpg: Output in format A6 of the file
DEJ8L0NP.PDF, see
DEJ8L0N1.
PS /
TXT /
PDF /
jpg
DEJ8: TUB-test chart DEJ8; Ostwald-optimal colours
YN=3,6, YW=90, CIE illuminant A, CIE 10 degree
Table data YABCh1 and YABCh2 with wavelength limits
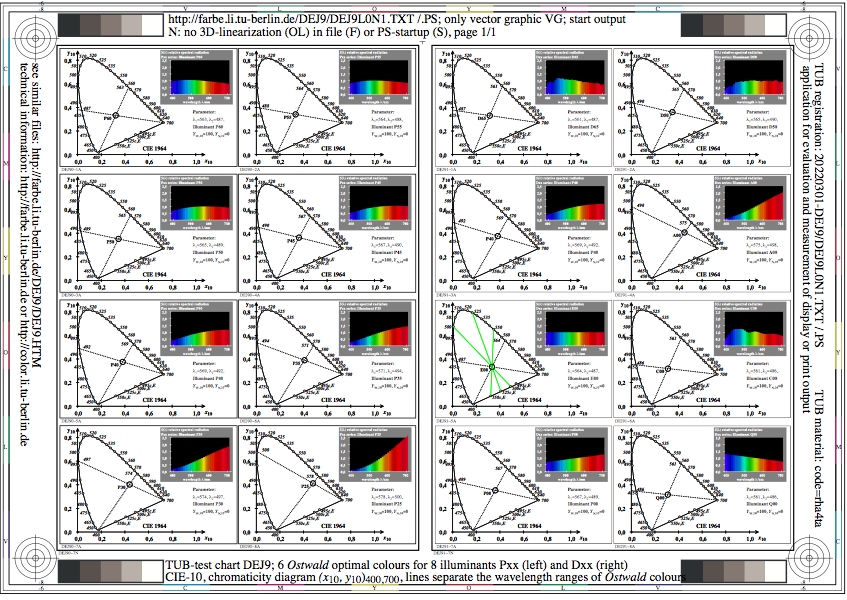
Figure DEJ9L0N1.jpg: Output in format A6 of the file
DEJ9L0NP.PDF, see
DEJ9L0N1.
PS /
TXT /
PDF /
jpg
DEJ9: TUB-test chart DEJ9; 8 spectral radiations of Pxx and Dxx
and Dxx for calculation of Ostwald optimal colours;
wavelength limits by (x,y)400,700; CIE 10-degree observer
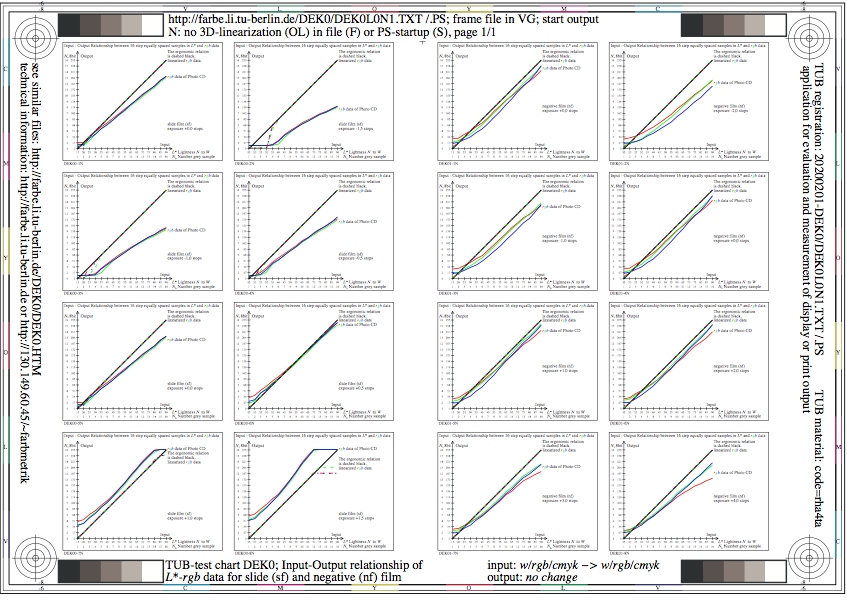
Figure DEK0L0N1.jpg: Output in format A6 of the file
DEK0L0NP.PDF, see
DEK0L0N1.
PS /
TXT /
PDF /
jpg
DEK0: TUB-test chart DEK0; Transfer: analog-digital
Photo-CD: slide (sf, left) and negative film (nf, right)
from under to over exposure in 7 steps, pixel: 192x128

Figure DEK1L0N1.jpg: Output in format A6 of the file
DEK1L0NP.PDF, see
DEK1L0N1.
PS /
TXT /
PDF /
jpg
DEK1: TUB-test chart DEK1; Raw scan, original size
Slide (sf, left) and negative film (nf, right), pixel: 192x128
Reflective original according to ISO/IEC 15775 & ISO 9241-306
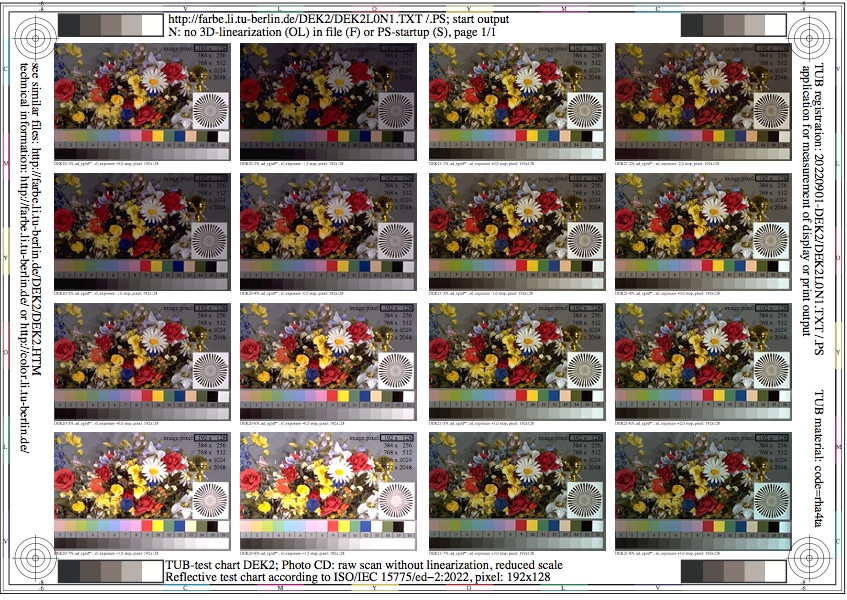
Figure DEK2L0N1.jpg: Output in format A6 of the file
DEK2L0NP.PDF, see
DEK2L0N1.
PS /
TXT /
PDF /
jpg
DEK2: TUB-test chart DEK2; Scan, reduced size
Slide (sf, left) and negative film (nf, right), pixel: 192x128
Reflective original according to ISO/IEC 15775 & ISO 9241-306

Figure DEK3L0N1.jpg: Output in format A6 of the file
DEK3L0NP.PDF, see
DEK3L0N1.
PS /
TXT /
PDF /
jpg
DEK3: TUB-test chart DEK3; Scan, reduced size with grid
Slide (sf, left) and negative film (nf, right), pixel: 192x128
Reflective original according to ISO/IEC 15775 & ISO 9241-306
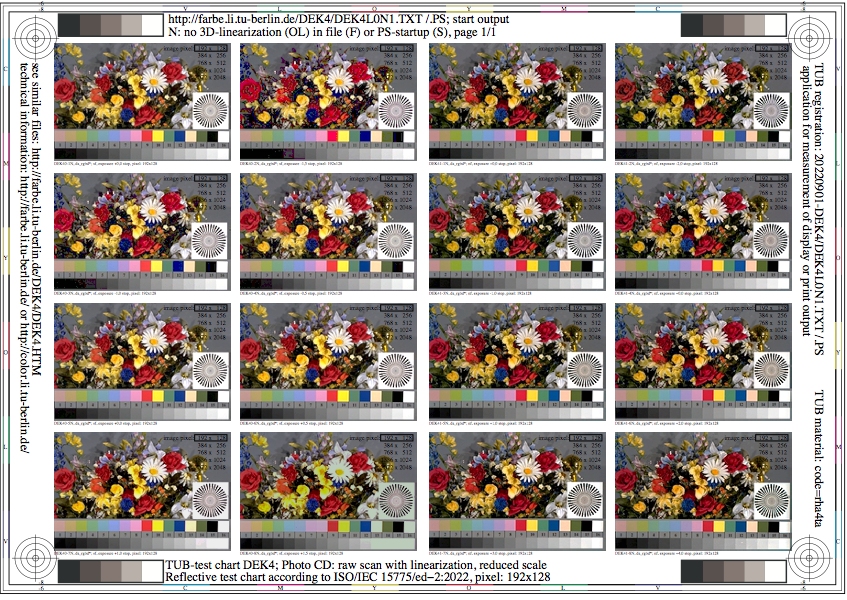
Figure DEK4L0N1.jpg: Output in format A6 of the file
DEK4L0NP.PDF, see
DEK4L0N1.
PS /
TXT /
PDF /
jpg
DEK4: TUB-test chart DEK4; Scan, reduced size, linearized
Slide (sf, left) and negative film (nf, right), pixel: 192x128
Reflective original according to ISO/IEC 15775 & ISO 9241-306
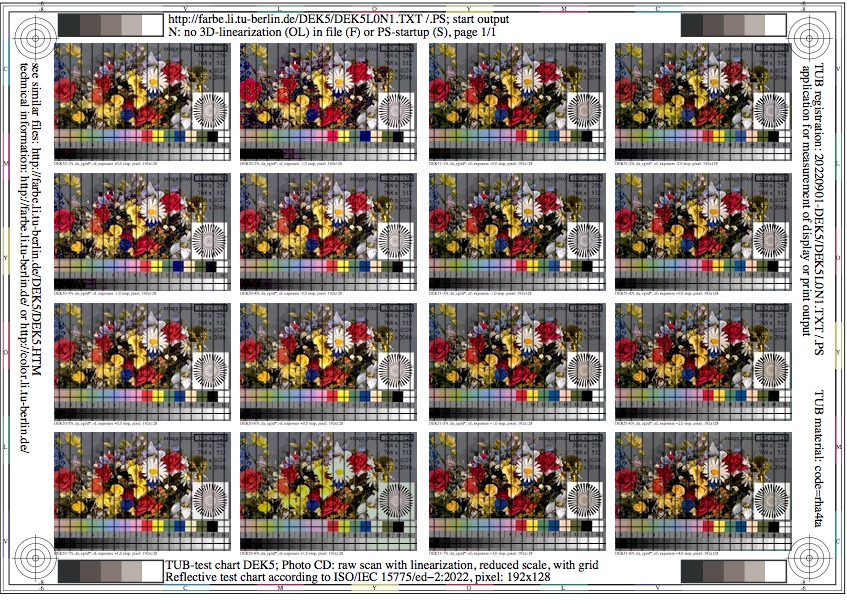
Figure DEK5L0N1.jpg: Output in format A6 of the file
DEK5L0NP.PDF, see
DEK5L0N1.
PS /
TXT /
PDF /
jpg
DEK5: TUB-test chart DEK5; Scan, reduced, linearized, with grid
Slide (sf, left) and negative film (nf, right), pixel: 192x128
Reflective original according to ISO/IEC 15775 & ISO 9241-306

Figure DEK6L0N1.jpg: Output in format A6 of the file
DEK6L0NP.PDF, see
DEK6L0N1.
PS /
TXT /
PDF /
jpg
DEK6: TUB-test chart DEK6; Scan of 16 CIE and 16 grey colours
Slide (sf, left) and negative film (nf, right), pixel: 192x128
Reflective original according to ISO/IEC 15775 & ISO 9241-306
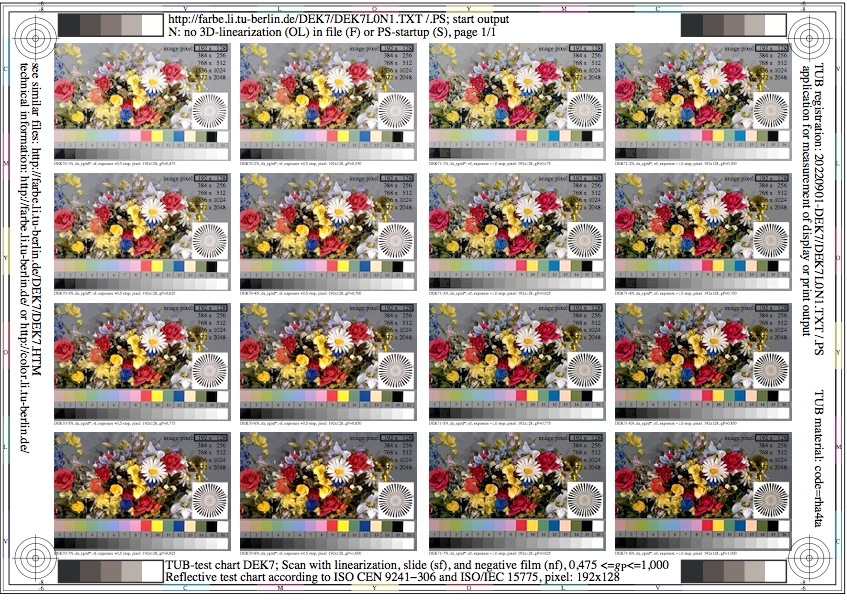
Figure DEK7L0N1.jpg: Output in format A6 of the file
DEK7L0NP.PDF, see
DEK7L0N1.
PS /
TXT /
PDF /
jpg
DEK7: TUB-test chart DEK7; Scan, reduced, linearized
Slide (sf) & negative film (nf), gamma 0,475<=gP<=1,000, 192x128
Reflective original according to ISO/IEC 15775 & ISO 9241-306

Figure DEK8L0N1.jpg: Output in format A6 of the file
DEK8L0NP.PDF, see
DEK8L0N1.
PS /
TXT /
PDF /
jpg
DEK8: TUB-test chart DEK7; Scan, reduced, linearized
Slide film (sf), relative gamma 0,475<=gP<=2,105, pixel: 192x128
Reflective original according to ISO/IEC 15775 & ISO 9241-306
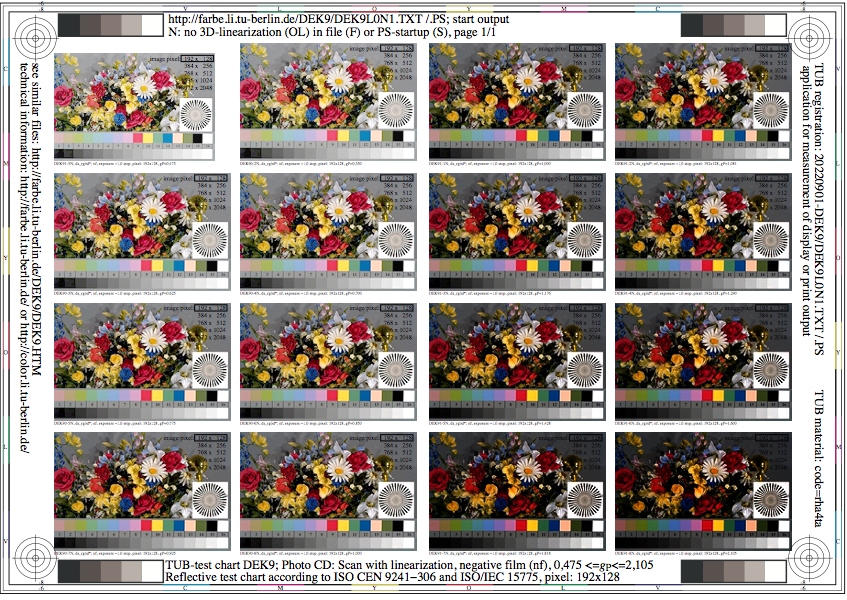
Figure DEK9L0N1.jpg: Output in format A6 of the file
DEK9L0NP.PDF, see
DEK9L0N1.
PS /
TXT /
PDF /
jpg
DEK9: TUB-test chart DEK8; Scan, reduced, linearized
Negative film (sf), rel. gamma 0,475<=gP<=2,105, pixel: 192x128
Reflective original according to ISO/IEC 15775 & ISO 9241-306
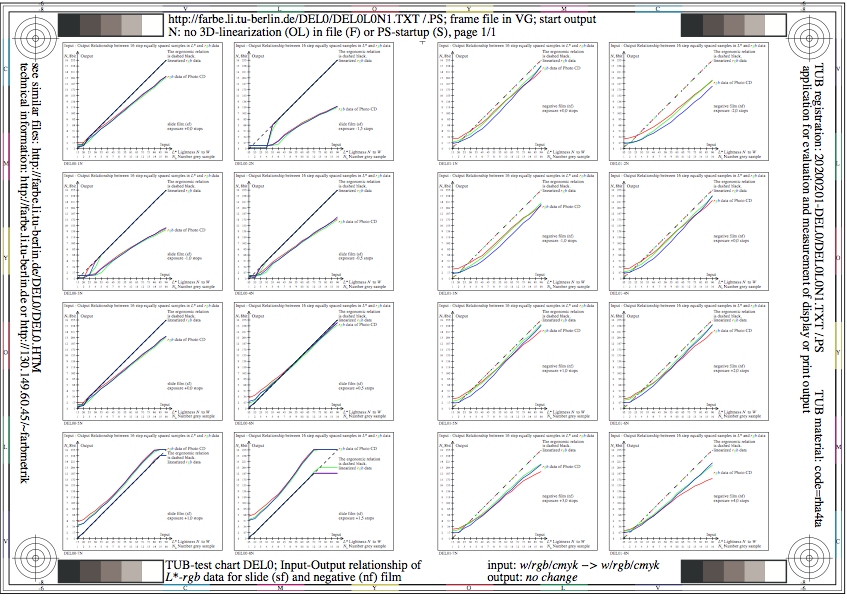
Figure DEL0L0N1.jpg: Output in format A6 of the file
DEL0L0NP.PDF, see
DEL0L0N1.
PS /
TXT /
PDF /
jpg
DEL0: TUB-test chart DEL0; Transfer: analog-digital
Photo-CD: slide (sf, left) and negative film (nf, right)
from under to over exposure in 7 steps, pixel: 384x256
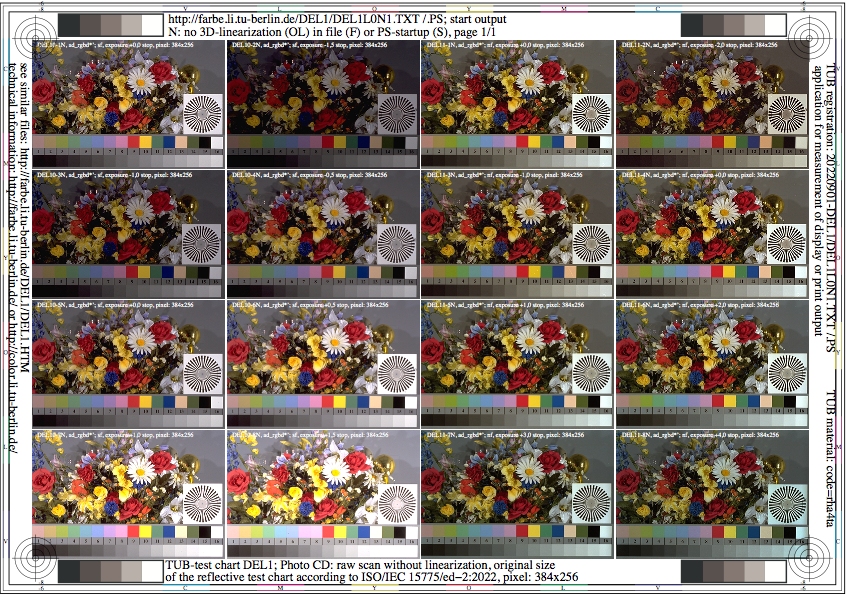
Figure DEL1L0N1.jpg: Output in format A6 of the file
DEL1L0NP.PDF, see
DEL1L0N1.
PS /
TXT /
PDF /
jpg
DEL1: TUB-test chart DEL1; Raw scan, original size
Slide (sf, left) and negative film (nf, right), pixel: 384x256
Reflective original according to ISO/IEC 15775 & ISO 9241-306
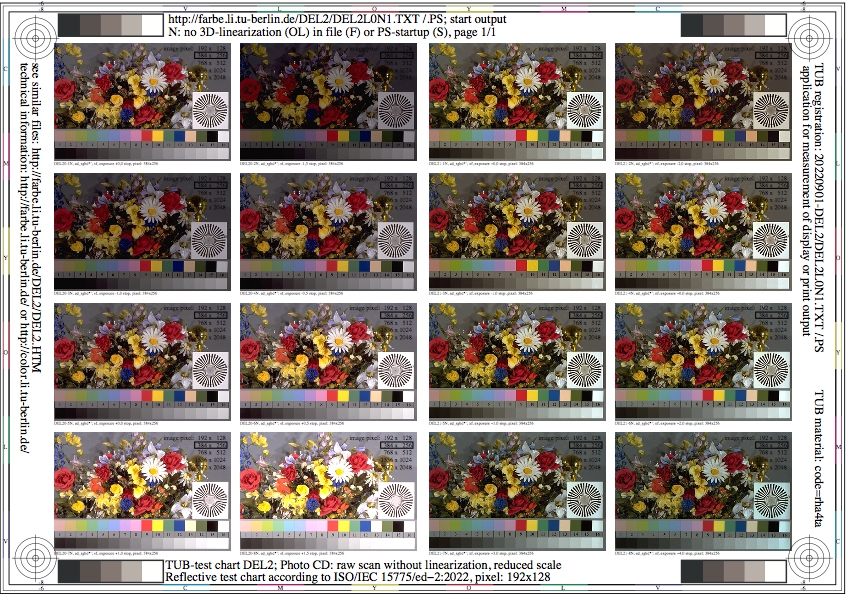
Figure DEL2L0N1.jpg: Output in format A6 of the file
DEL2L0NP.PDF, see
DEL2L0N1.
PS /
TXT /
PDF /
jpg
DEL2: TUB-test chart DEL2; Scan, reduced size
Slide (sf, left) and negative film (nf, right), pixel: 384x256
Reflective original according to ISO/IEC 15775 & ISO 9241-306
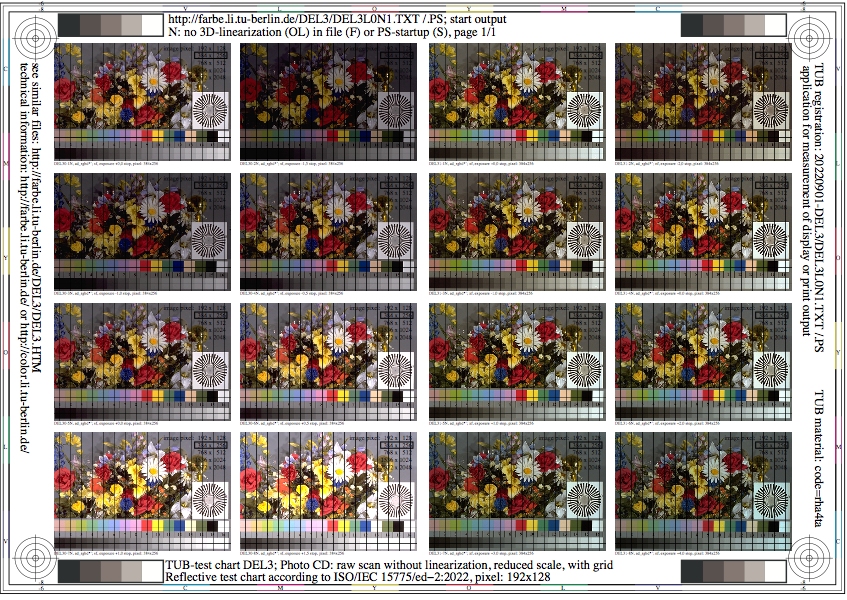
Figure DEL3L0N1.jpg: Output in format A6 of the file
DEL3L0NP.PDF, see
DEL3L0N1.
PS /
TXT /
PDF /
jpg
DEL3: TUB-test chart DEL3; Scan, reduced size with grid
Slide (sf, left) and negative film (nf, right), pixel: 384x256
Reflective original according to ISO/IEC 15775 & ISO 9241-306
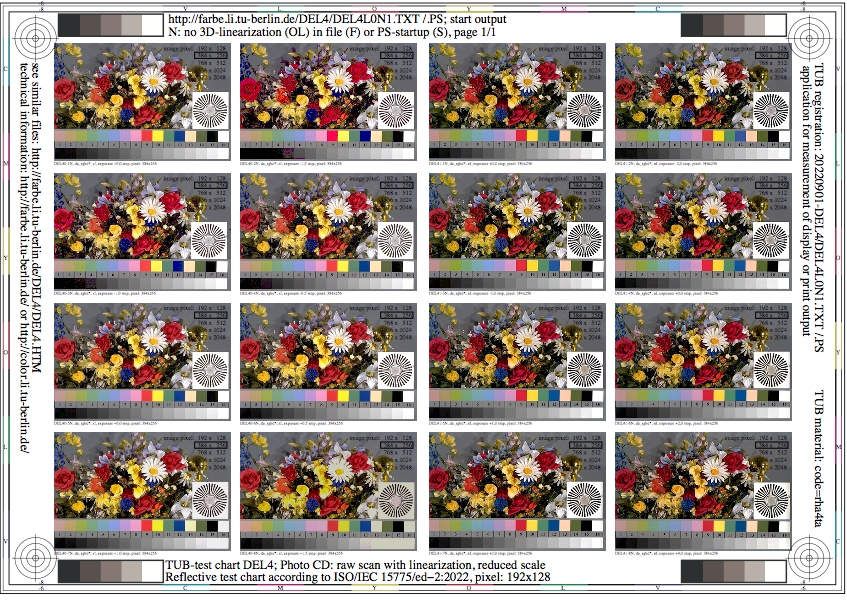
Figure DEL4L0N1.jpg: Output in format A6 of the file
DEL4L0NP.PDF, see
DEL4L0N1.
PS /
TXT /
PDF /
jpg
DEL4: TUB-test chart DEL4; Scan, reduced size, linearized
Slide (sf, left) and negative film (nf, right), pixel: 384x256
Reflective original according to ISO/IEC 15775 & ISO 9241-306
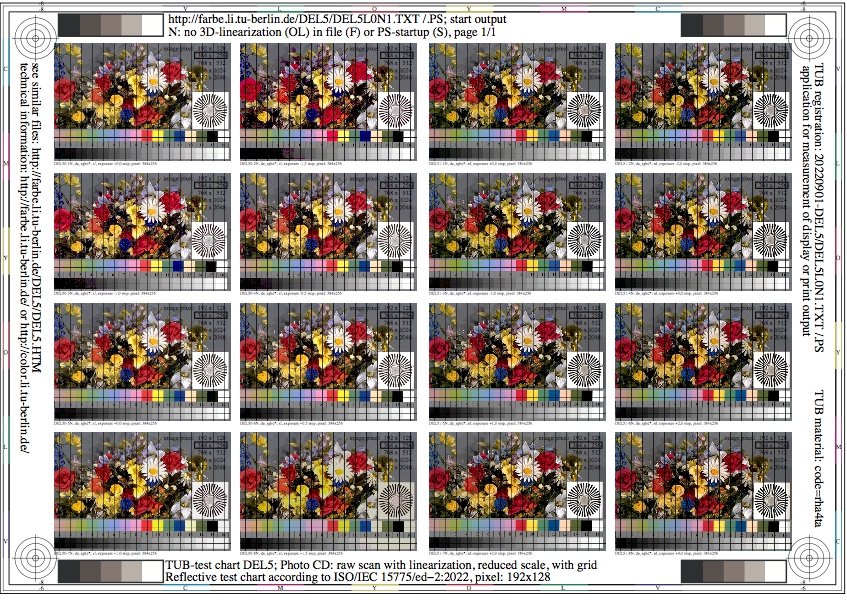
Figure DEL5L0N1.jpg: Output in format A6 of the file
DEL5L0NP.PDF, see
DEL5L0N1.
PS /
TXT /
PDF /
jpg
DEL5: TUB-test chart DEL5; Scan, reduced, linearized, with grid
Slide (sf, left) and negative film (nf, right), pixel: 384x256
Reflective original according to ISO/IEC 15775 & ISO 9241-306
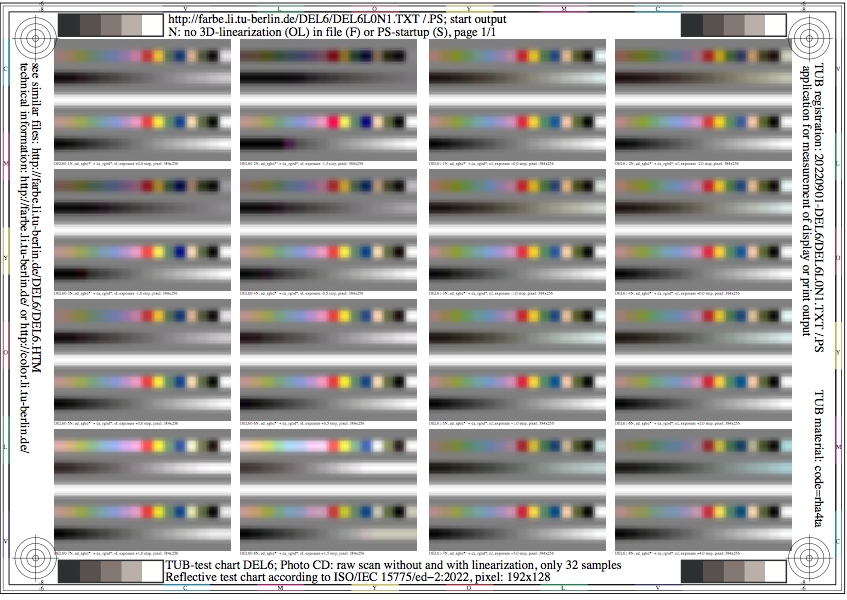
Figure DEL6L0N1.jpg: Output in format A6 of the file
DEL6L0NP.PDF, see
DEL6L0N1.
PS /
TXT /
PDF /
jpg
DEL6: TUB-test chart DEL6; Scan of 16 CIE and 16 grey colours
Slide (sf, left) and negative film (nf, right), pixel: 384x256
Reflective original according to ISO/IEC 15775 & ISO 9241-306
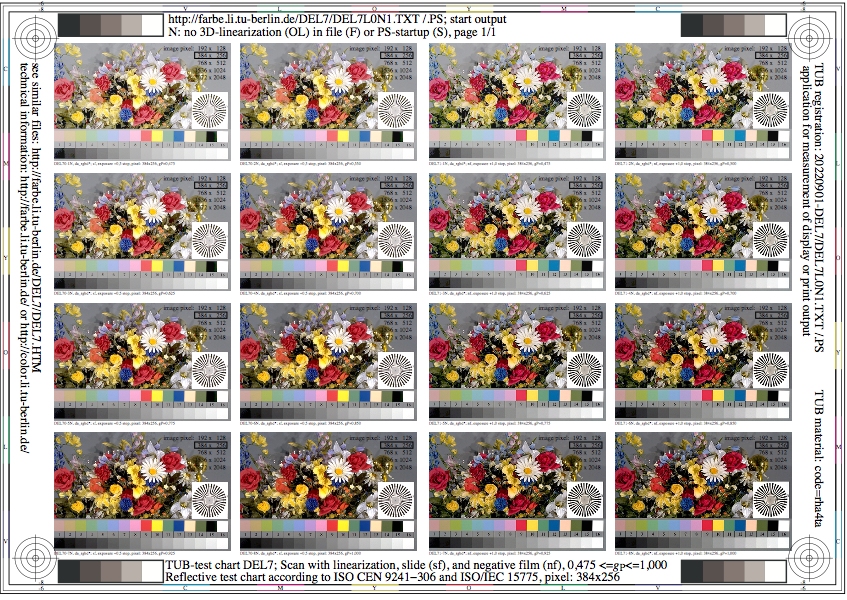
Figure DEL7L0N1.jpg: Output in format A6 of the file
DEL7L0NP.PDF, see
DEL7L0N1.
PS /
TXT /
PDF /
jpg
DEL7: TUB-test chart DEL7; Scan, reduced, linearized
Slide (sf) & negative film (nf), gamma 0,475<=gP<=1,000, 384x256
Reflective original according to ISO/IEC 15775 & ISO 9241-306
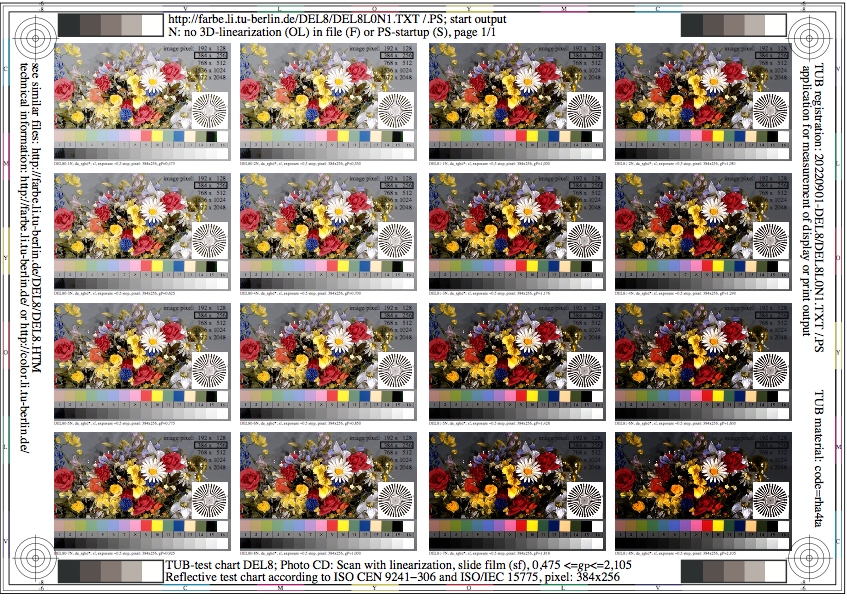
Figure DEL8L0N1.jpg: Output in format A6 of the file
DEL8L0NP.PDF, see
DEL8L0N1.
PS /
TXT /
PDF /
jpg
DEL8: TUB-test chart DEL7; Scan, reduced, linearized
Slide film (sf), relative gamma 0,475<=gP<=2,105, pixel: 384x256
Reflective original according to ISO/IEC 15775 & ISO 9241-306

Figure DEL9L0N1.jpg: Output in format A6 of the file
DEL9L0NP.PDF, see
DEL9L0N1.
PS /
TXT /
PDF /
jpg
DEL9: TUB-test chart DEL8; Scan, reduced, linearized
Negative film (sf), rel. gamma 0,475<=gP<=2,105, pixel: 384x256
Reflective original according to ISO/IEC 15775 & ISO 9241-306
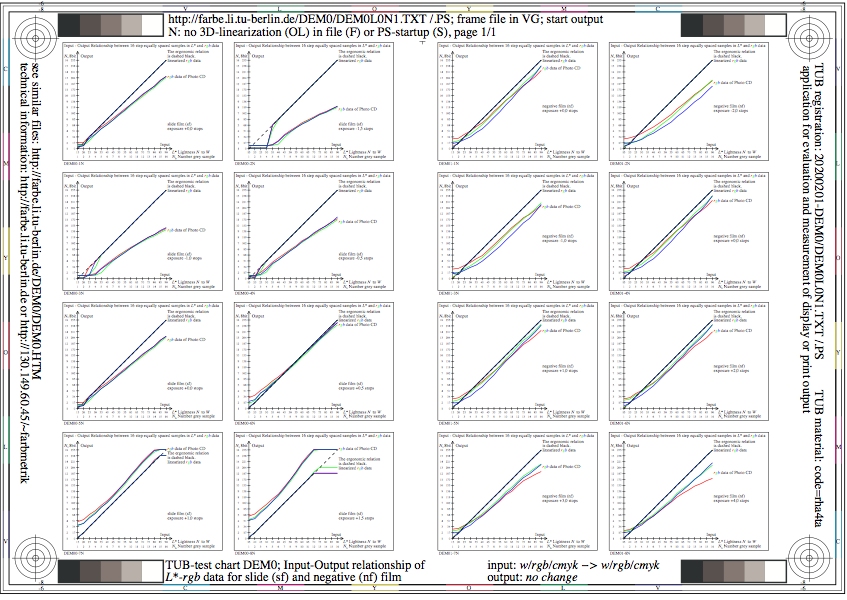
Figure DEM0L0N1.jpg: Output in format A6 of the file
DEM0L0NP.PDF, see
DEM0L0N1.
PS /
TXT /
PDF /
jpg
DEM0: TUB-test chart DEM0; Transfer: analog-digital
Photo-CD: slide (sf, left) and negative film (nf, right)
from under to over exposure in 7 steps, pixel: 768x512

Figure DEM1L0N1.jpg: Output in format A6 of the file
DEM1L0NP.PDF, see
DEM1L0N1.
PS /
TXT /
PDF /
jpg
DEM1: TUB-test chart DEM1; Raw scan, original size
Slide (sf, left) and negative film (nf, right), pixel: 768x512
Reflective original according to ISO/IEC 15775 & ISO 9241-306

Figure DEM2L0N1.jpg: Output in format A6 of the file
DEM2L0NP.PDF, see
DEM2L0N1.
PS /
TXT /
PDF /
jpg
DEM2: TUB-test chart DEM2; Scan, reduced size
Slide (sf, left) and negative film (nf, right), pixel: 768x512
Reflective original according to ISO/IEC 15775 & ISO 9241-306
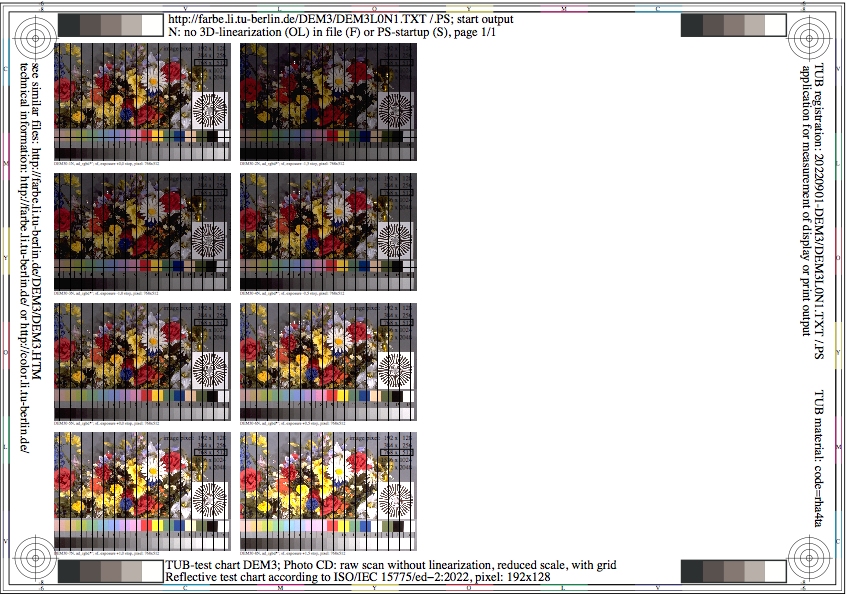
Figure DEM3L0N1.jpg: Output in format A6 of the file
DEM3L0NP.PDF, see
DEM3L0N1.
PS /
TXT /
PDF /
jpg
DEM3: TUB-test chart DEM3; Scan, reduced size with grid
Slide (sf, left) and negative film (nf, right), pixel: 768x512
Reflective original according to ISO/IEC 15775 & ISO 9241-306
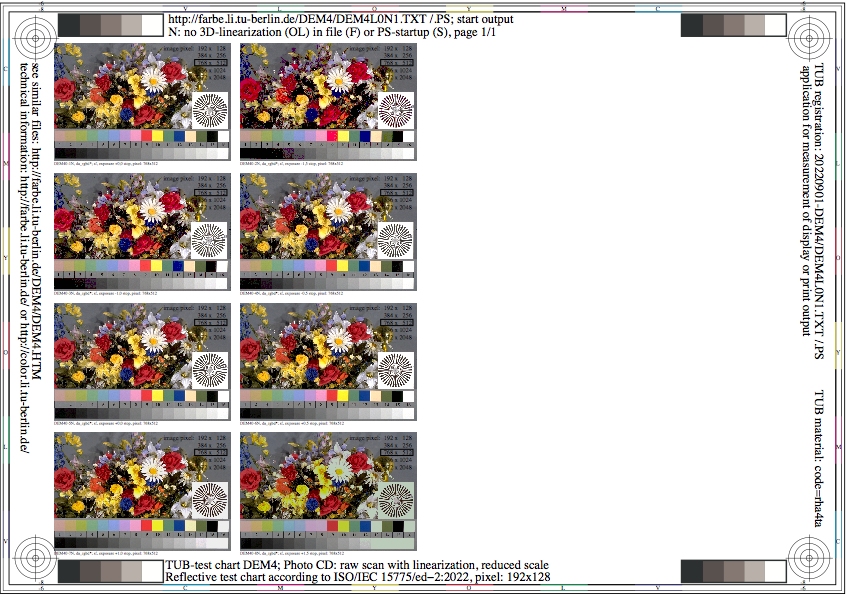
Figure DEM4L0N1.jpg: Output in format A6 of the file
DEM4L0NP.PDF, see
DEM4L0N1.
PS /
TXT /
PDF /
jpg
DEM4: TUB-test chart DEM4; Scan, reduced size, linearized
Slide (sf, left) and negative film (nf, right), pixel: 768x512
Reflective original according to ISO/IEC 15775 & ISO 9241-306
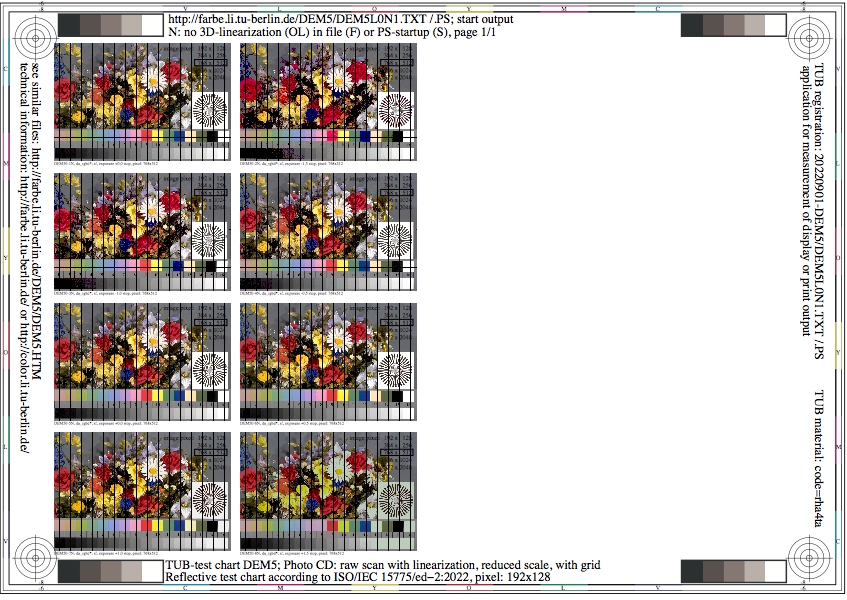
Figure DEM5L0N1.jpg: Output in format A6 of the file
DEM5L0NP.PDF, see
DEM5L0N1.
PS /
TXT /
PDF /
jpg
DEM5: TUB-test chart DEM5; Scan, reduced, linearized, with grid
Slide (sf, left) and negative film (nf, right), pixel: 768x512
Reflective original according to ISO/IEC 15775 & ISO 9241-306

Figure DEM6L0N1.jpg: Output in format A6 of the file
DEM6L0NP.PDF, see
DEM6L0N1.
PS /
TXT /
PDF /
jpg
DEM6: TUB-test chart DEM6; Scan of 16 CIE and 16 grey colours
Slide (sf, left) and negative film (nf, right), pixel: 768x512
Reflective original according to ISO/IEC 15775 & ISO 9241-306
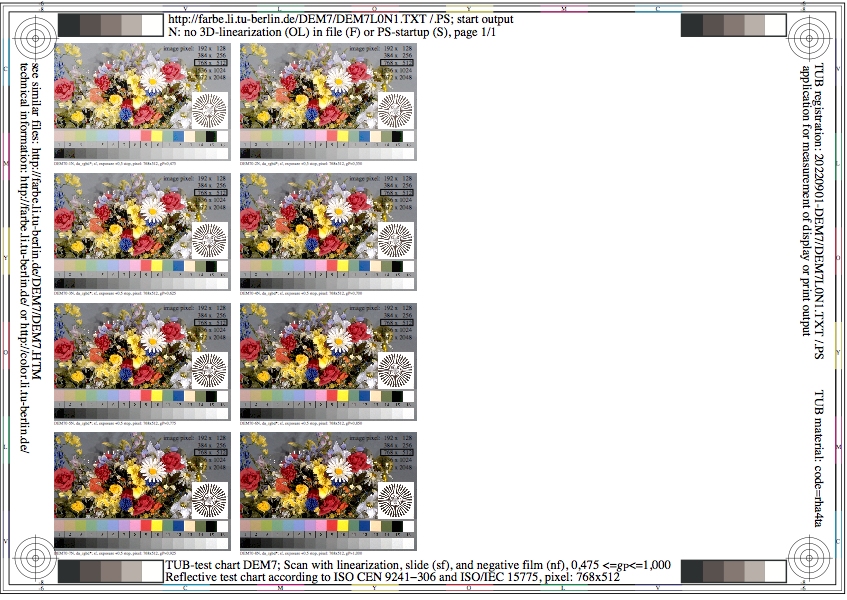
Figure DEM7L0N1.jpg: Output in format A6 of the file
DEM7L0NP.PDF, see
DEM7L0N1.
PS /
TXT /
PDF /
jpg
DEM7: TUB-test chart DEM7; Scan, reduced, linearized
Slide (sf) & negative film (nf), gamma 0,475<=gP<=1,000, 768x512
Reflective original according to ISO/IEC 15775 & ISO 9241-306

Figure DEM8L0N1.jpg: Output in format A6 of the file
DEM8L0NP.PDF, see
DEM8L0N1.
PS /
TXT /
PDF /
jpg
DEM8: TUB-test chart DEM7; Scan, reduced, linearized
Slide film (sf), relative gamma 0,475<=gP<=2,105, pixel: 768x512
Reflective original according to ISO/IEC 15775 & ISO 9241-306
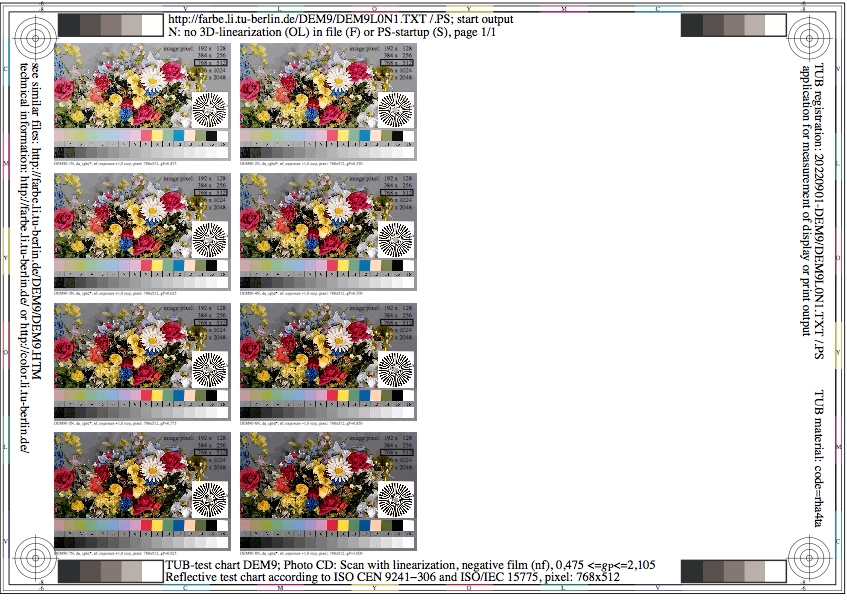
Figure DEM9L0N1.jpg: Output in format A6 of the file
DEM9L0NP.PDF, see
DEM9L0N1.
PS /
TXT /
PDF /
jpg
DEM9: TUB-test chart DEM8; Scan, reduced, linearized
Negative film (sf), rel. gamma 0,475<=gP<=2,105, pixel: 768x512
Reflective original according to ISO/IEC 15775 & ISO 9241-306

Figure DEN0L0N1.jpg: Output in format A6 of the file
DEN0L0NP.PDF, see
DEN0L0N1.
PS /
TXT /
PDF /
jpg
DEN0: TUB-test chart DEN0; Transfer: analog-digital
Photo-CD: slide (sf, left) and negative film (nf, right)
from under to over exposure in 7 steps, pixel: 040x027

Figure DEN1L0N1.jpg: Output in format A6 of the file
DEN1L0NP.PDF, see
DEN1L0N1.
PS /
TXT /
PDF /
jpg
DEN1: TUB-test chart DEN1; Raw scan, original size
Slide (sf, left) and negative film (nf, right), pixel: 040x027
Reflective original according to ISO/IEC 15775 & ISO 9241-306

Figure DEN2L0N1.jpg: Output in format A6 of the file
DEN2L0NP.PDF, see
DEN2L0N1.
PS /
TXT /
PDF /
jpg
DEN2: TUB-test chart DEN2; Scan, reduced size
Slide (sf, left) and negative film (nf, right), pixel: 040x027
Reflective original according to ISO/IEC 15775 & ISO 9241-306

Figure DEN3L0N1.jpg: Output in format A6 of the file
DEN3L0NP.PDF, see
DEN3L0N1.
PS /
TXT /
PDF /
jpg
DEN3: TUB-test chart DEN3; Scan, reduced size with grid
Slide (sf, left) and negative film (nf, right), pixel: 040x027
Reflective original according to ISO/IEC 15775 & ISO 9241-306

Figure DEN4L0N1.jpg: Output in format A6 of the file
DEN4L0NP.PDF, see
DEN4L0N1.
PS /
TXT /
PDF /
jpg
DEN4: TUB-test chart DEN4; Scan, reduced size, linearized
Slide (sf, left) and negative film (nf, right), pixel: 040x027
Reflective original according to ISO/IEC 15775 & ISO 9241-306

Figure DEN5L0N1.jpg: Output in format A6 of the file
DEN5L0NP.PDF, see
DEN5L0N1.
PS /
TXT /
PDF /
jpg
DEN5: TUB-test chart DEN5; Scan, reduced, linearized, with grid
Slide (sf, left) and negative film (nf, right), pixel: 040x027
Reflective original according to ISO/IEC 15775 & ISO 9241-306

Figure DEN6L0N1.jpg: Output in format A6 of the file
DEN6L0NP.PDF, see
DEN6L0N1.
PS /
TXT /
PDF /
jpg
DEN6: TUB-test chart DEN6; Scan of 16 CIE and 16 grey colours
Slide (sf, left) and negative film (nf, right), pixel: 040x027
Reflective original according to ISO/IEC 15775 & ISO 9241-306
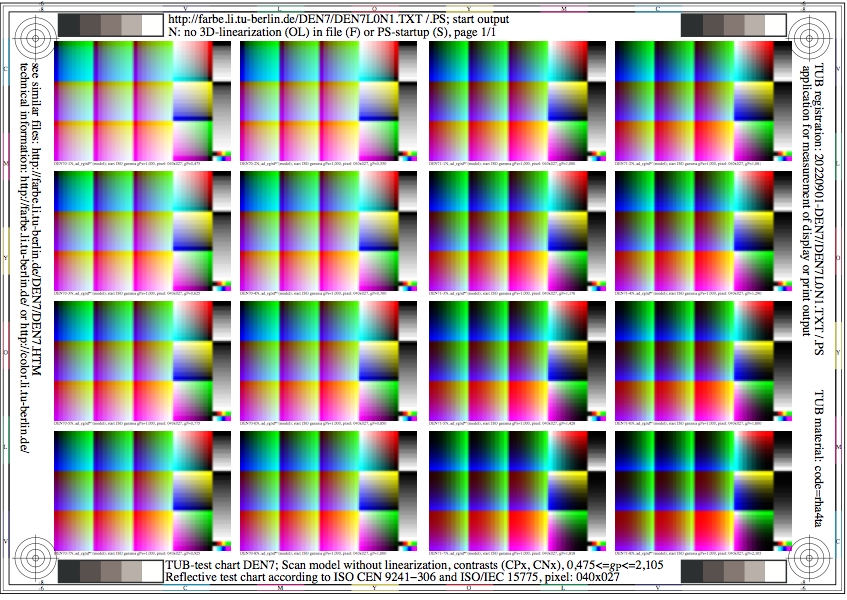
Figure DEN7L0N1.jpg: Output in format A6 of the file
DEN7L0NP.PDF, see
DEN7L0N1.
PS /
TXT /
PDF /
jpg
DEN7: TUB-test chart DEN7; Scan model, not linearized
Start-ISO-Gamma gPs=1,0, gamma 0,475<=gP<=2,105, 040x027
Reflective original according to AE49 of ISO 9241-306
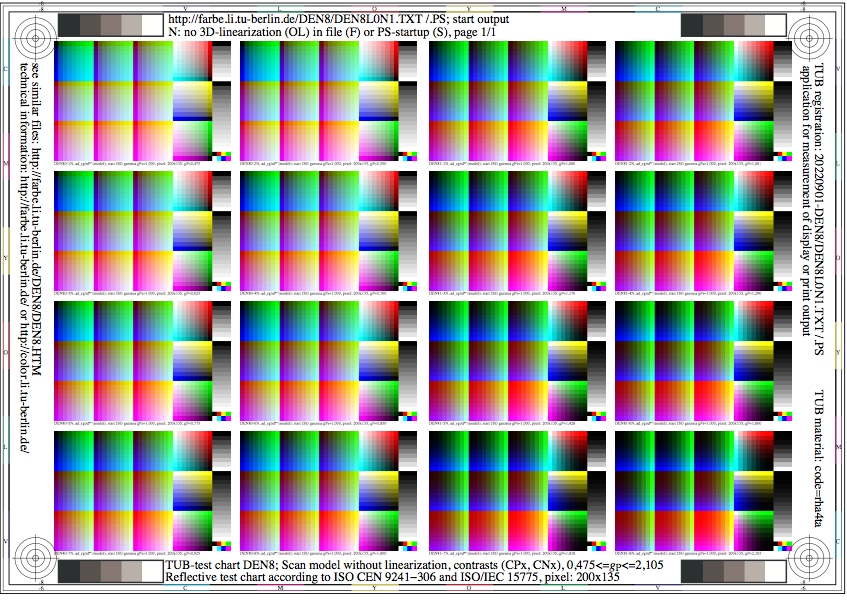
Figure DEN8L0N1.jpg: Output in format A6 of the file
DEN8L0NP.PDF, see
DEN8L0N1.
PS /
TXT /
PDF /
jpg
DEN8: TUB-test chart DEN7; Scan model, not linearized
Start-ISO-Gamma gPs=1,0, gamma 0,475<=gP<=2,105, 200x135
Reflective original according to AE49 of ISO 9241-306

Figure DEN9L0N1.jpg: Output in format A6 of the file
DEN9L0NP.PDF, see
DEN9L0N1.
PS /
TXT /
PDF /
jpg
DEN9: TUB-test chart DEN8; Scan model, not linearized
Start-ISO-Gamma gPs=1,0, gamma 0,475<=gP<=2,105, 400x270
Reflective original according to AE49 of ISO 9241-306
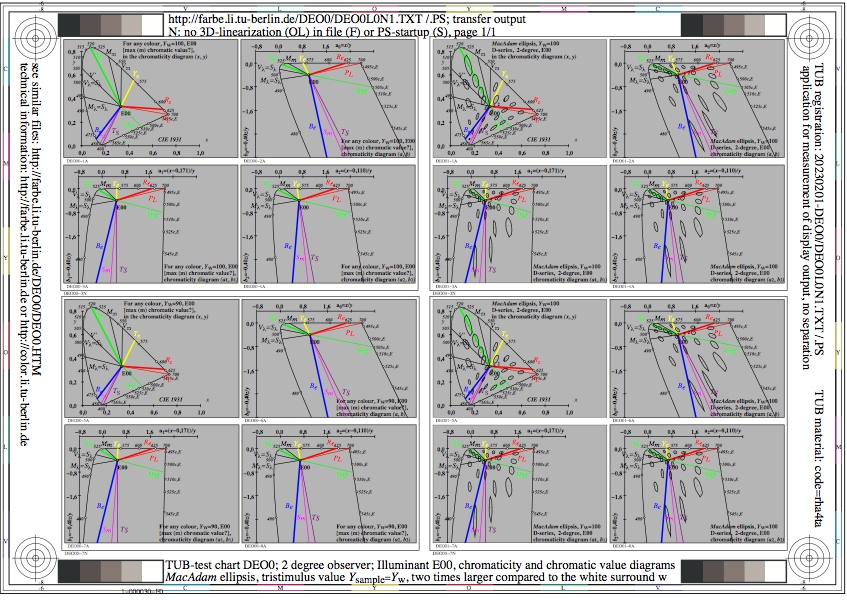
Figure DEO0L0N1.jpg: Output in format A6 of the file
DEO0L0NP.PDF, see
DEO0L0N1.
PS /
TXT /
PDF /
jpg
DEO0: TUB-test chart DEO0; MacAdam ellipses
all samples, Y=180, lightness L*CIELAB=125
illuminant E00, 4 chromaticity diagrams

Figure DEO1L0N1.jpg: Output in format A6 of the file
DEO1L0NP.PDF, see
DEO1L0N1.
PS /
TXT /
PDF /
jpg
DEO1: TUB-test chart DEO1; OSA colour system
all samples, lightness L*OSA=-4 near L*CIELAB=20
standard illuminant D65, 4 chromaticity diagrams

Figure DEO2L0N1.jpg: Output in format A6 of the file
DEO2L0NP.PDF, see
DEO2L0N1.
PS /
TXT /
PDF /
jpg
DEO2: TUB-test chart DEO2; OSA colour system
all samples, lightness L*OSA=0 near L*CIELAB=50
standard illuminant D65, 4 chromaticity diagrams

Figure DEO3L0N1.jpg: Output in format A6 of the file
DEO3L0NP.PDF, see
DEO3L0N1.
PS /
TXT /
PDF /
jpg
DEO3: TUB-test chart DEO3; OSA colour system
all samples, lightness L*OSA=4 near L*CIELAB=80
standard illuminant D65, 4 chromaticity diagrams
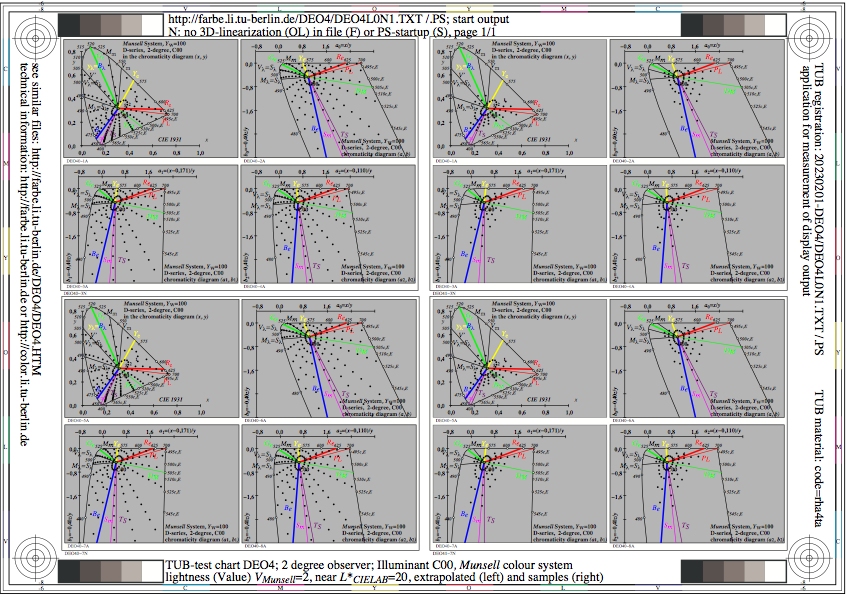
Figure DEO4L0N1.jpg: Output in format A6 of the file
DEO4L0NP.PDF, see
DEO4L0N1.
PS /
TXT /
PDF /
jpg
DEO4: TUB-test chart DEO4; Munsell colour system
all samples, lightness Value 2 near L*CIELAB=20
illuminant C00, 4 chromaticity diagrams
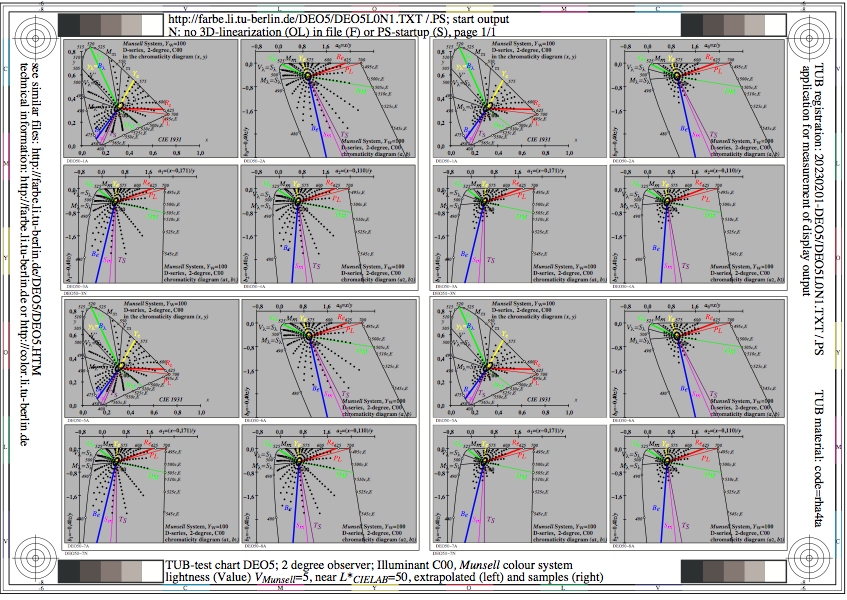
Figure DEO5L0N1.jpg: Output in format A6 of the file
DEO5L0NP.PDF, see
DEO5L0N1.
PS /
TXT /
PDF /
jpg
DEO5: TUB-test chart DEO5; Munsell colour system
all samples, lightness Value 5 near L*CIELAB=50
illuminant C00, 4 chromaticity diagrams
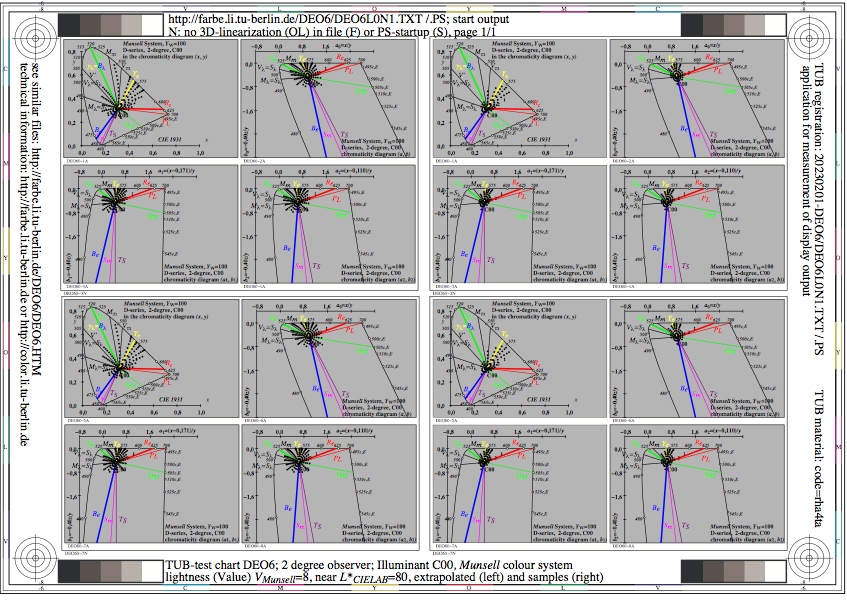
Figure DEO6L0N1.jpg: Output in format A6 of the file
DEO6L0NP.PDF, see
DEO6L0N1.
PS /
TXT /
PDF /
jpg
DEO6: TUB-test chart DEO6; Munsell colour system
all samples, lightness Value 8 near L*CIELAB=80
illuminant C00, 4 chromaticity diagrams

Figure DEO7L0N1.jpg: Output in format A6 of the file
DEO7L0NP.PDF, see
DEO7L0N1.
PS /
TXT /
PDF /
jpg
DEO7: TUB-test chart DEO7; Munsell colour system
Chroma 2, Value 1,2,5,8, and 9, L*CIELAB=10, 20, 50, 80, 90
TITLO7C
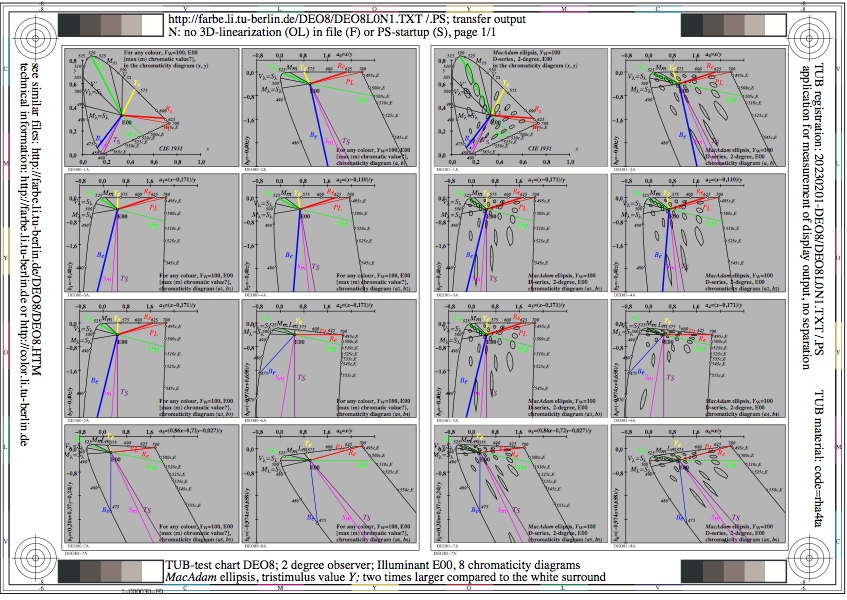
Figure DEO8L0N1.jpg: Output in format A6 of the file
DEO8L0NP.PDF, see
DEO8L0N1.
PS /
TXT /
PDF /
jpg
DEO8: TUB-test chart DEO8; MacAdam ellipses
all samples, Y=180, lightness L*CIELAB=125
illuminant E00, 8 chromaticity diagrams
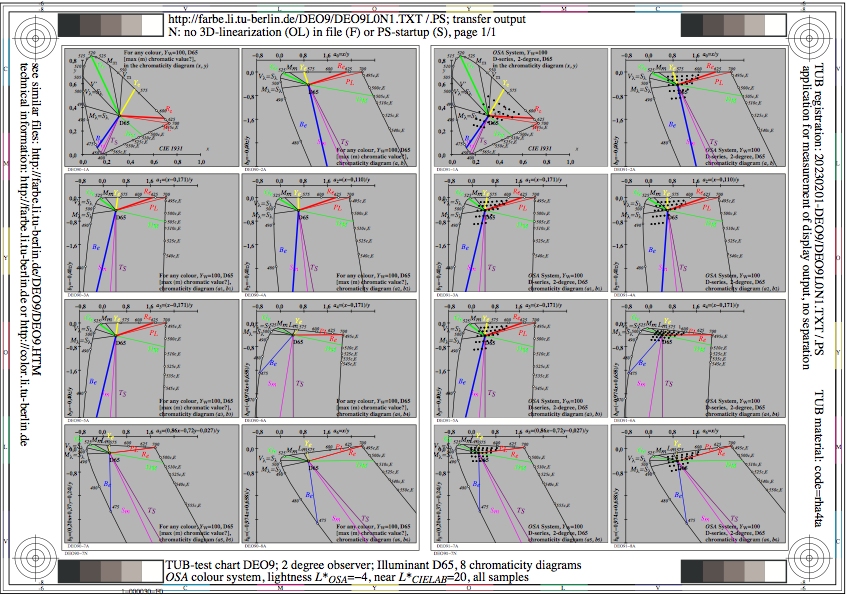
Figure DEO9L0N1.jpg: Output in format A6 of the file
DEO9L0NP.PDF, see
DEO9L0N1.
PS /
TXT /
PDF /
jpg
DEO9: TUB-test chart DEO9; OSA colour system
all samples, lightness L*OSA=-4 near L*CIELAB=20
standard illuminant D65, 8 chromaticity diagrams

Figure DEP0L0N1.jpg: Output in format A6 of the file
DEP0L0NP.PDF, see
DEP0L0N1.
PS /
TXT /
PDF /
jpg
DEP0: TUB-test chart DEQ0; Colour threholds and colour spaces
CIELAB and LABJND colour spaces, and colour differences
for different applications
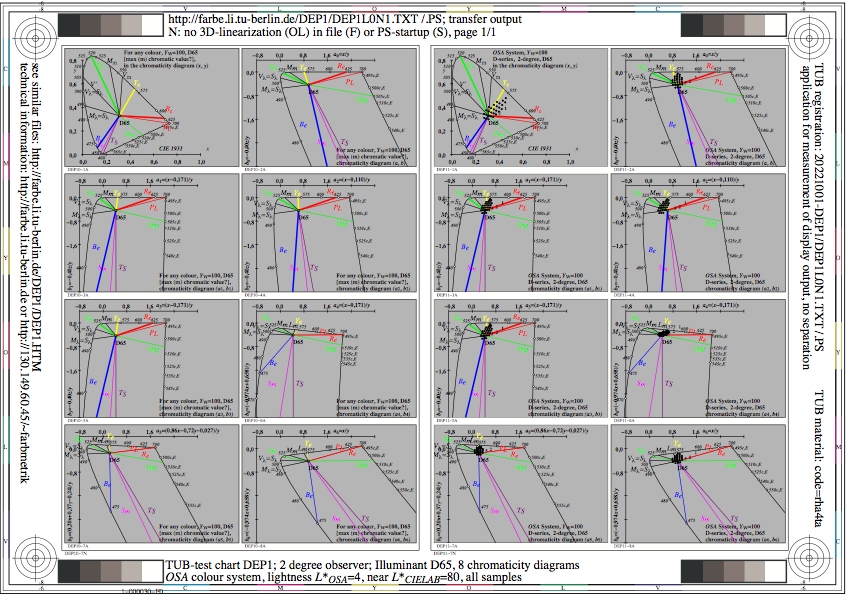
Figure DEP1L0N1.jpg: Output in format A6 of the file
DEP1L0NP.PDF, see
DEP1L0N1.
PS /
TXT /
PDF /
jpg
DEP1: TUB-test chart DEQ1; LABJND-line elements of CIE 230:2019
log[lightness L*], threshold delta Y
sensitivity (delta Y)/Y and contrast Y/(delta Y)]
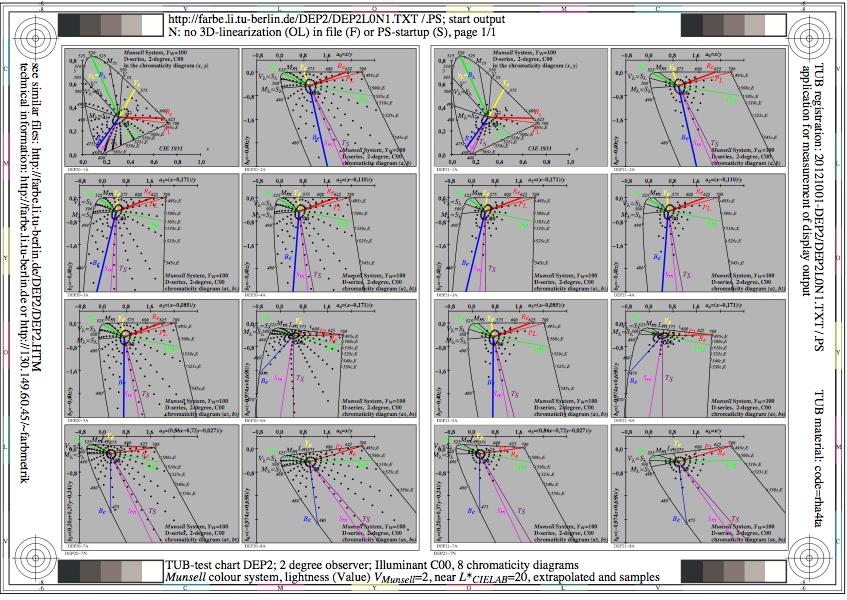
Figure DEP2L0N1.jpg: Output in format A6 of the file
DEP2L0NP.PDF, see
DEP2L0N1.
PS /
TXT /
PDF /
jpg
DEP2: TUB-test chart DEQ2; CIELAB-line elements of ISO/CIE 11664-4
log[lightness L*], threshold delta Y
sensitivity (delta Y)/Y and contrast Y/(delta Y)]
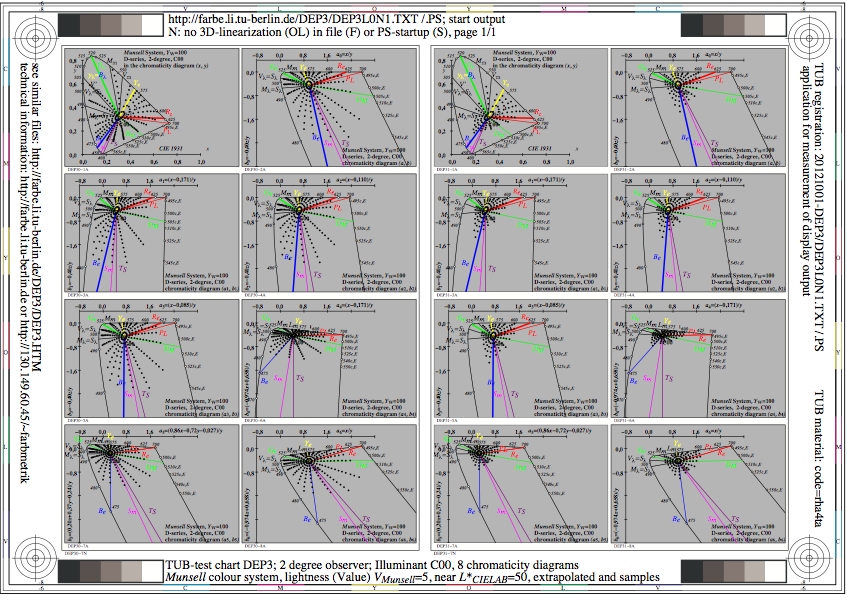
Figure DEP3L0N1.jpg: Output in format A6 of the file
DEP3L0NP.PDF, see
DEP3L0N1.
PS /
TXT /
PDF /
jpg
DEP3: TUB-test chart DEQ3; CIE Y an lightness L*
for surface colours and emissive displays
Chromaticity and chromatic values of Ostwald- colours
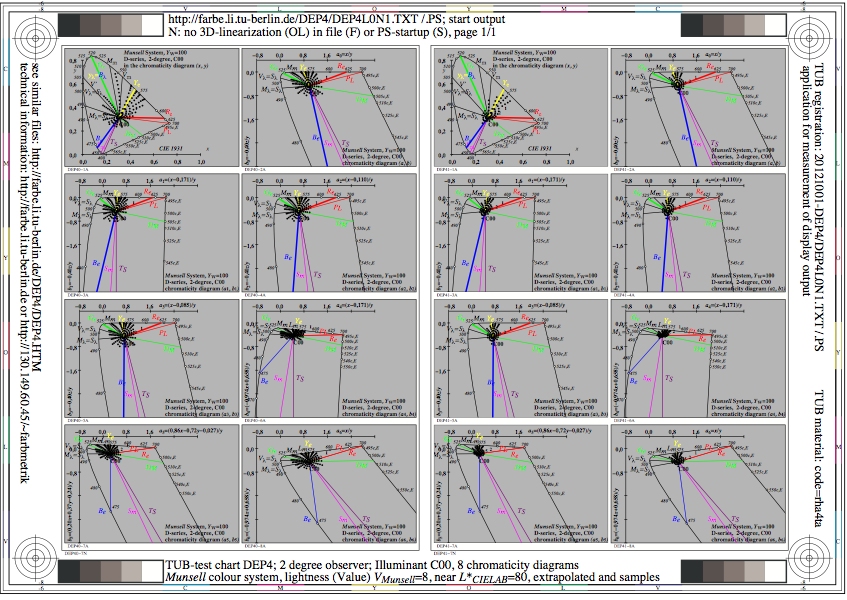
Figure DEP4L0N1.jpg: Output in format A6 of the file
DEP4L0NP.PDF, see
DEP4L0N1.
PS /
TXT /
PDF /
jpg
DEP4: TUB-test chart DEQ4; Equally spaced 9 step grey scales for
reflection Yref=0,0, normalisation: white W, L*N_L*W(YN_YW):
18_96(2,5_90), 14_96(1,8_90), 14_125(1,8_180), 8_163(0,9_360)
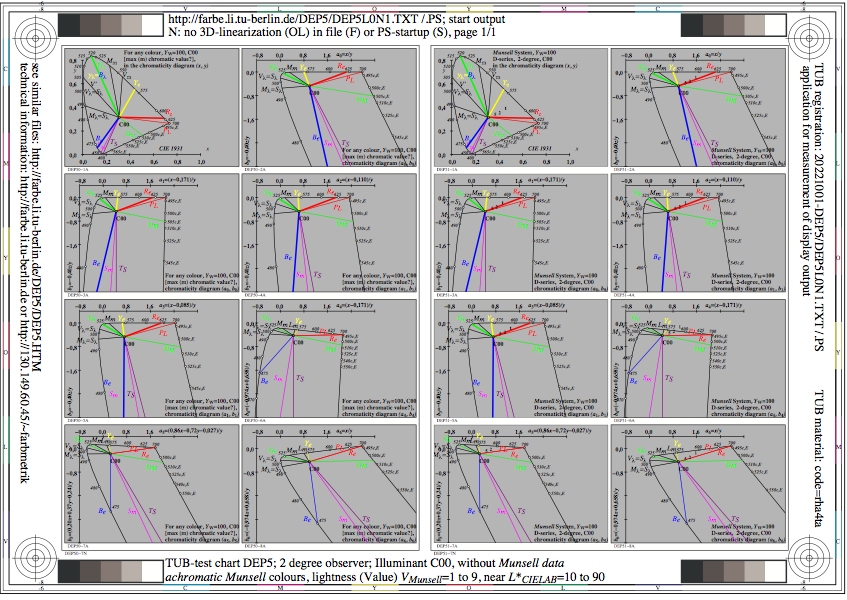
Figure DEP5L0N1.jpg: Output in format A6 of the file
DEP5L0NP.PDF, see
DEP5L0N1.
PS /
TXT /
PDF /
jpg
DEP5: TUB-test chart DEQ5; Equally spaced 9 step grey scales for
reflection Yref=0,0, normalisation: white W, L*N_L*W(YN_YW):
18_96(2,5_90), 14_96(1,8_90), 22_125(3,6_180), 22_163(3,6_360)
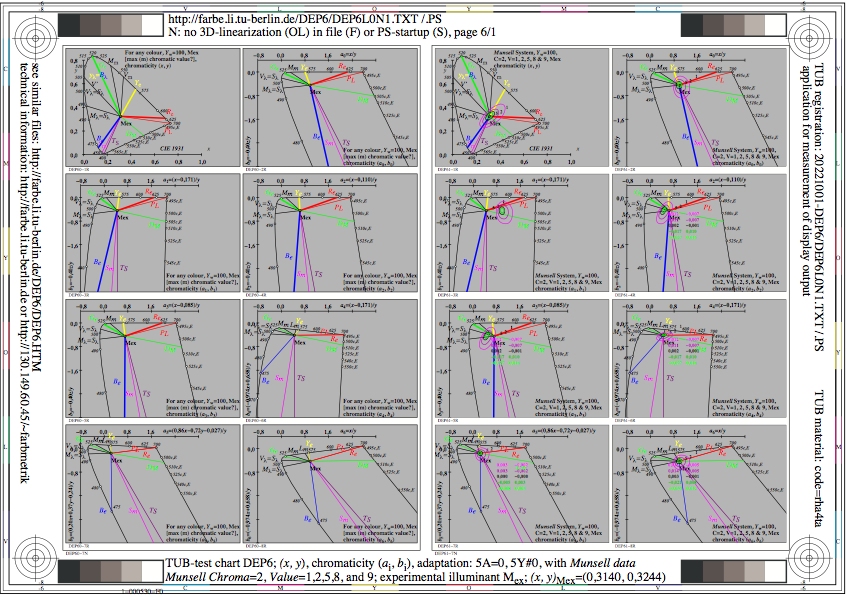
Figure DEP6L0N1.jpg: Output in format A6 of the file
DEP6L0NP.PDF, see
DEP6L0N1.
PS /
TXT /
PDF /
jpg
DEP6: TUB-test chart DEQ6; Threshold experiments
Description of the experimental threshold delta Y
Formulae for the description of the lightness F*(Y)

Figure DEP7L0N1.jpg: Output in format A6 of the file
DEP7L0NP.PDF, see
DEP7L0N1.
PS /
TXT /
PDF /
jpg
DEP7: TUB-test chart DEQ7; 8 contrast steps according to ISO 9241-306
Luminance reflection between 2,5% and 40% for sRGB dislays
Thesholds delta L* of grey steps with and without linearisation

Figure DEP8L0N1.jpg: Output in format A6 of the file
DEP8L0NP.PDF, see
DEP8L0N1.
PS /
TXT /
PDF /
jpg
DEP8: TUB-test chart DEQ8; Equally spaced 9 step grey scales
for four display reflections Yref=0,4, 90,0, 1,8, 3,6
L*N=4,0 or YN=0,4 and L*W=96 or YW=90, normalisation: white W
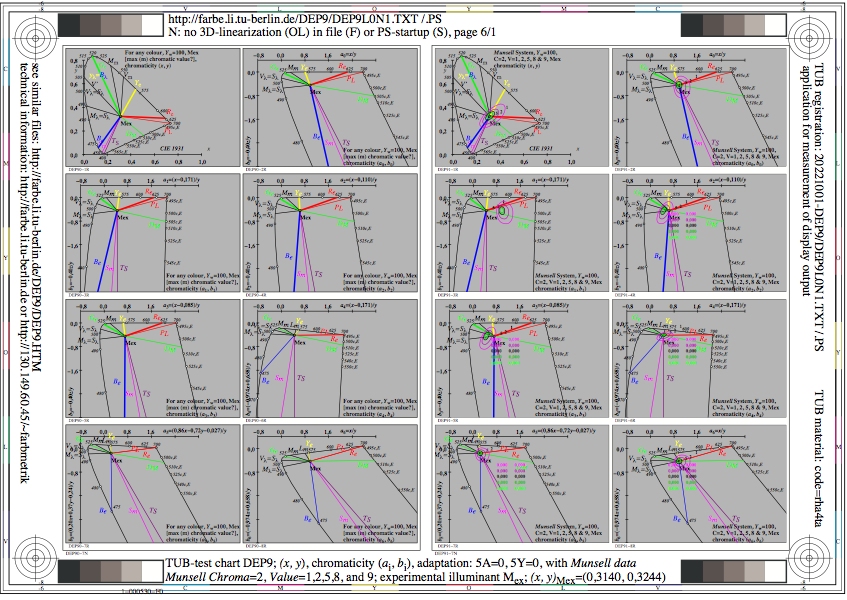
Figure DEP9L0N1.jpg: Output in format A6 of the file
DEP9L0NP.PDF, see
DEP9L0N1.
PS /
TXT /
PDF /
jpg
DEP9: TUB-test chart DEQ9; Equally spaced 9 step grey scales
for four display reflections Yref=0,4, 90, 1,8, 3,6
L*N=4,0 or YN=0,4 and L*W=96 or YW=90, normalisation: grey U
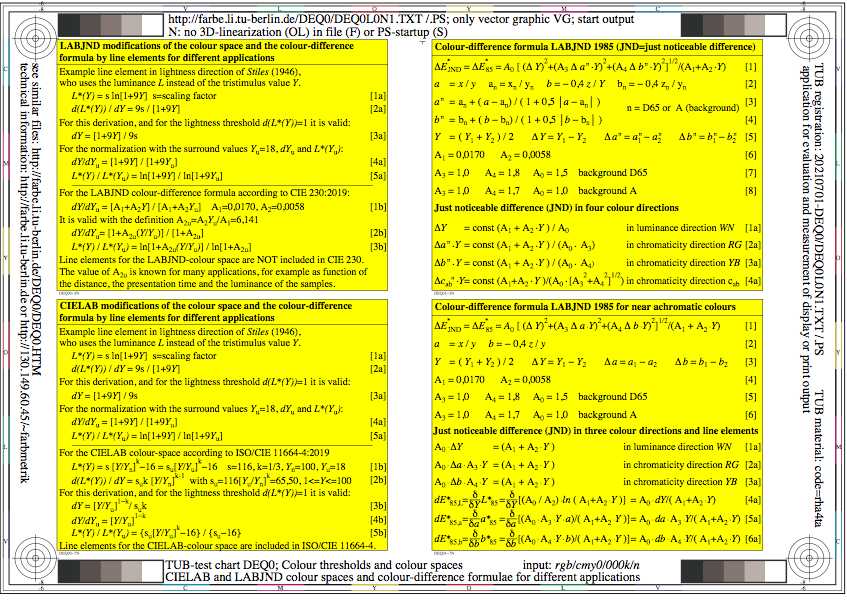
Figure DEQ0L0N1.jpg: Output in format A6 of the file
DEQ0L0NP.PDF, see
DEQ0L0N1.
PS /
TXT /
PDF /
jpg
DEQ0: TUB-test chart DEQ0; Colour threholds and colour spaces
CIELAB and LABJND colour spaces, and colour differences
for different applications
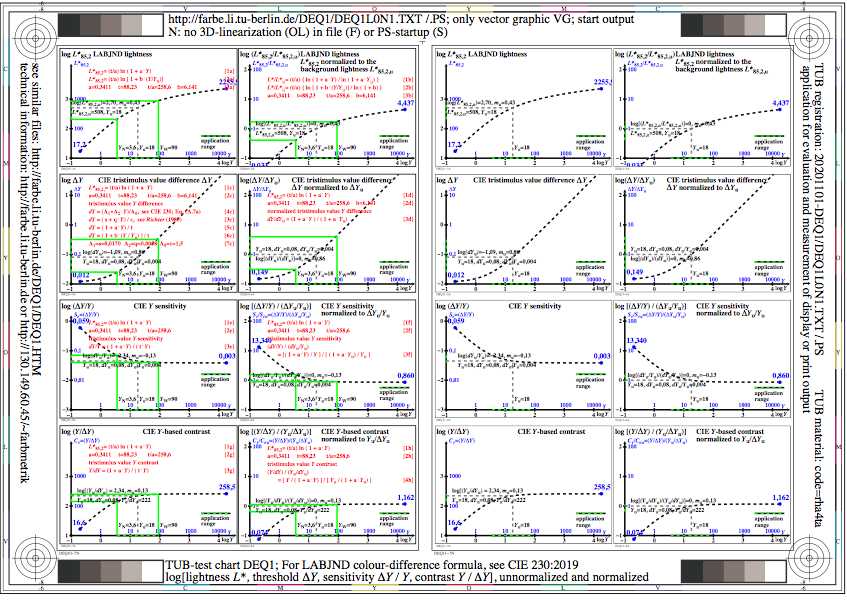
Figure DEQ1L0N1.jpg: Output in format A6 of the file
DEQ1L0NP.PDF, see
DEQ1L0N1.
PS /
TXT /
PDF /
jpg
DEQ1: TUB-test chart DEQ1; LABJND-line elements of CIE 230:2019
log[lightness L*], threshold delta Y
sensitivity (delta Y)/Y and contrast Y/(delta Y)]
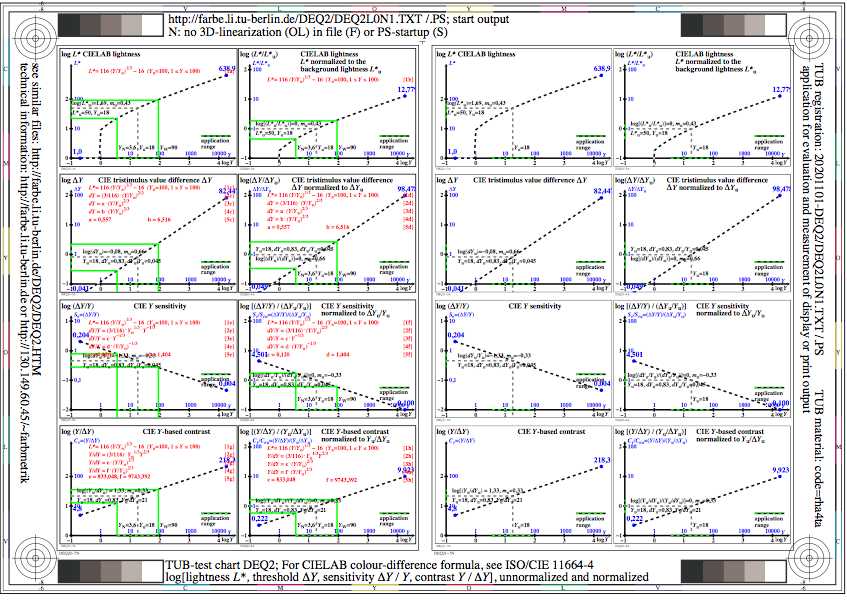
Figure DEQ2L0N1.jpg: Output in format A6 of the file
DEQ2L0NP.PDF, see
DEQ2L0N1.
PS /
TXT /
PDF /
jpg
DEQ2: TUB-test chart DEQ2; CIELAB-line elements of ISO/CIE 11664-4
log[lightness L*], threshold delta Y
sensitivity (delta Y)/Y and contrast Y/(delta Y)]
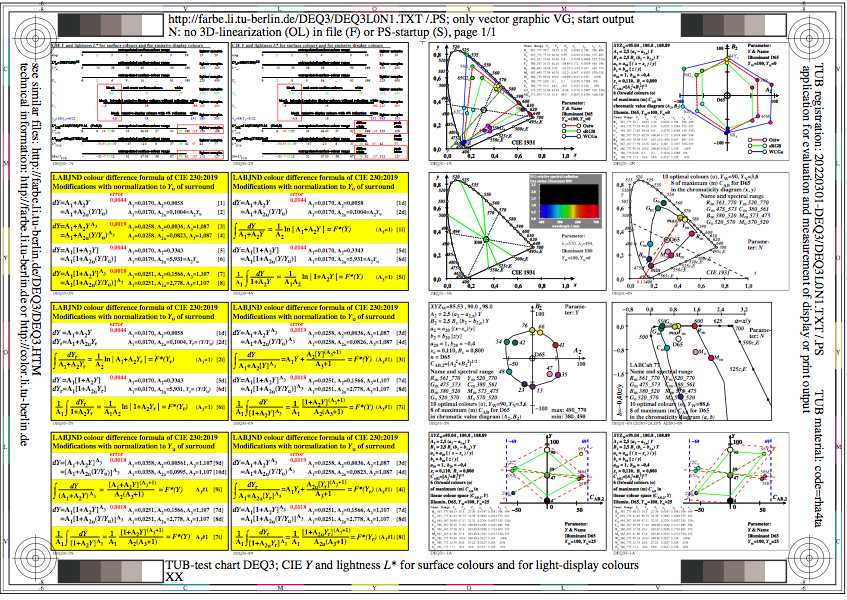
Figure DEQ3L0N1.jpg: Output in format A6 of the file
DEQ3L0NP.PDF, see
DEQ3L0N1.
PS /
TXT /
PDF /
jpg
DEQ3: TUB-test chart DEQ3; CIE Y an lightness L*
for surface colours and emissive displays
Chromaticity and chromatic values of Ostwald- colours

Figure DEQ4L0N1.jpg: Output in format A6 of the file
DEQ4L0NP.PDF, see
DEQ4L0N1.
PS /
TXT /
PDF /
jpg
DEQ4: TUB-test chart DEQ4; Equally spaced 9 step grey scales for
reflection Yref=0,0, normalisation: white W, L*N_L*W(YN_YW):
18_96(2,5_90), 14_96(1,8_90), 14_125(1,8_180), 8_163(0,9_360)
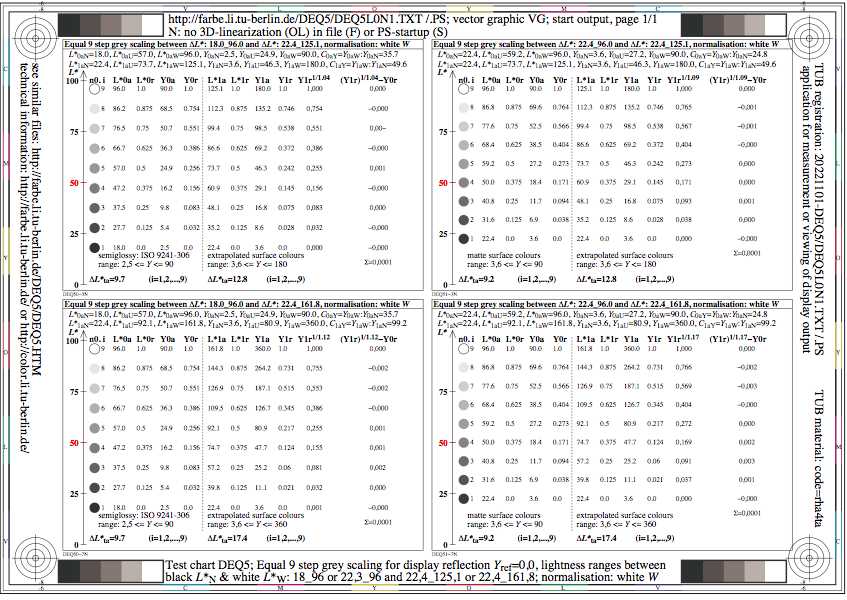
Figure DEQ5L0N1.jpg: Output in format A6 of the file
DEQ5L0NP.PDF, see
DEQ5L0N1.
PS /
TXT /
PDF /
jpg
DEQ5: TUB-test chart DEQ5; Equally spaced 9 step grey scales for
reflection Yref=0,0, normalisation: white W, L*N_L*W(YN_YW):
18_96(2,5_90), 14_96(1,8_90), 22_125(3,6_180), 22_163(3,6_360)
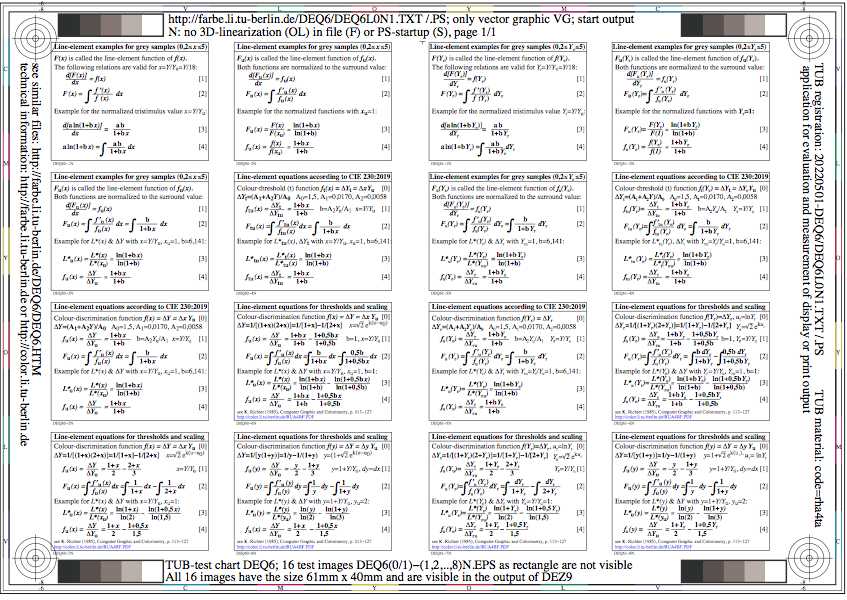
Figure DEQ6L0N1.jpg: Output in format A6 of the file
DEQ6L0NP.PDF, see
DEQ6L0N1.
PS /
TXT /
PDF /
jpg
DEQ6: TUB-test chart DEQ6; Threshold experiments
Description of the experimental threshold delta Y
Formulae for the description of the lightness F*(Y)
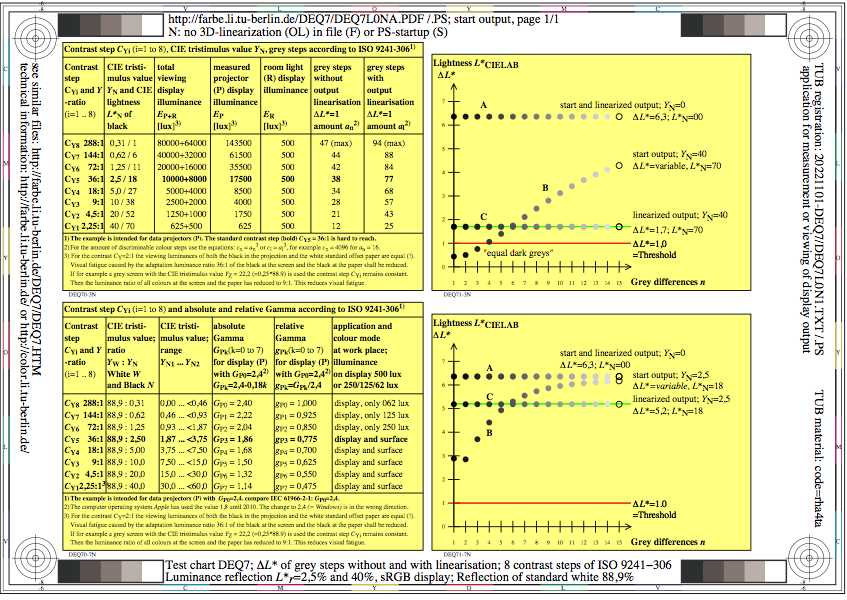
Figure DEQ7L0N1.jpg: Output in format A6 of the file
DEQ7L0NP.PDF, see
DEQ7L0N1.
PS /
TXT /
PDF /
jpg
DEQ7: TUB-test chart DEQ7; 8 contrast steps according to ISO 9241-306
Luminance reflection between 2,5% and 40% for sRGB dislays
Thesholds delta L* of grey steps with and without linearisation

Figure DEQ8L0N1.jpg: Output in format A6 of the file
DEQ8L0NP.PDF, see
DEQ8L0N1.
PS /
TXT /
PDF /
jpg
DEQ8: TUB-test chart DEQ8; Equally spaced 9 step grey scales
for four display reflections Yref=0,4, 90,0, 1,8, 3,6
L*N=4,0 or YN=0,4 and L*W=96 or YW=90, normalisation: white W
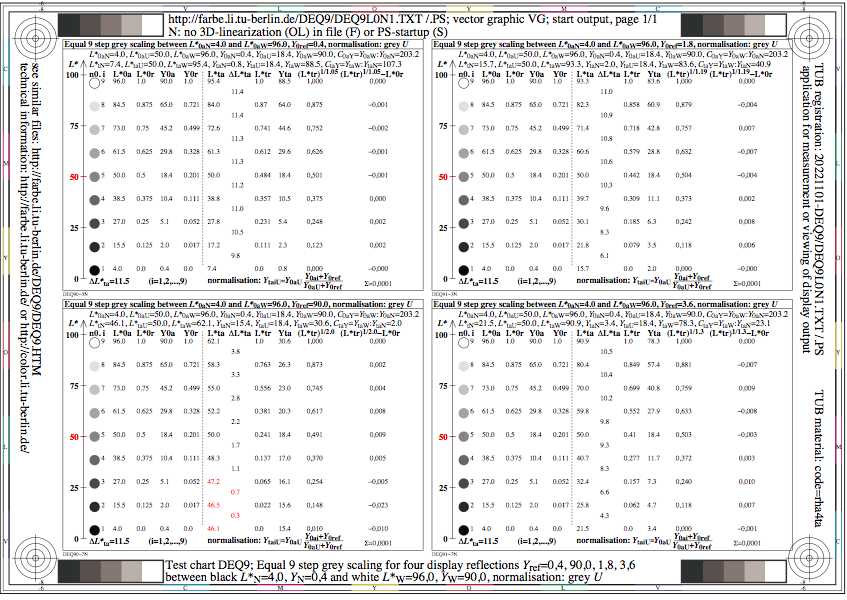
Figure DEQ9L0N1.jpg: Output in format A6 of the file
DEQ9L0NP.PDF, see
DEQ9L0N1.
PS /
TXT /
PDF /
jpg
DEQ9: TUB-test chart DEQ9; Equally spaced 9 step grey scales
for four display reflections Yref=0,4, 90, 1,8, 3,6
L*N=4,0 or YN=0,4 and L*W=96 or YW=90, normalisation: grey U
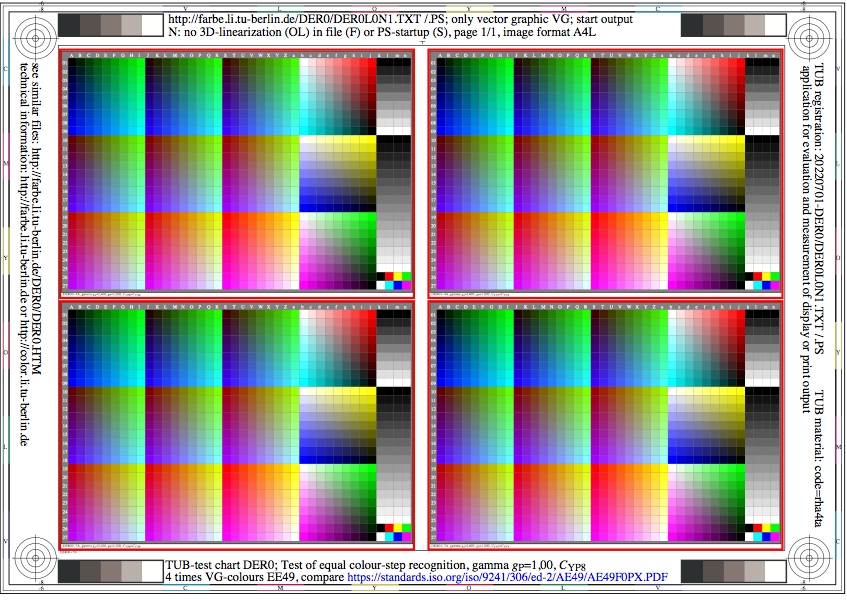
Figure DER0L0N1.jpg: Output in format A6 of the file
DER0L0NP.PDF, see
DER0L0N1.
PS /
TXT /
PDF /
jpg
DER0: TUB-test chart DER0; Test of equal colour-step recognition
4 times 1080 VG-standard colours, similar ISO 9241-306:AE49
Gamma ga=2,40, Gamma gP=1,00, ISO-contrast step CYP8
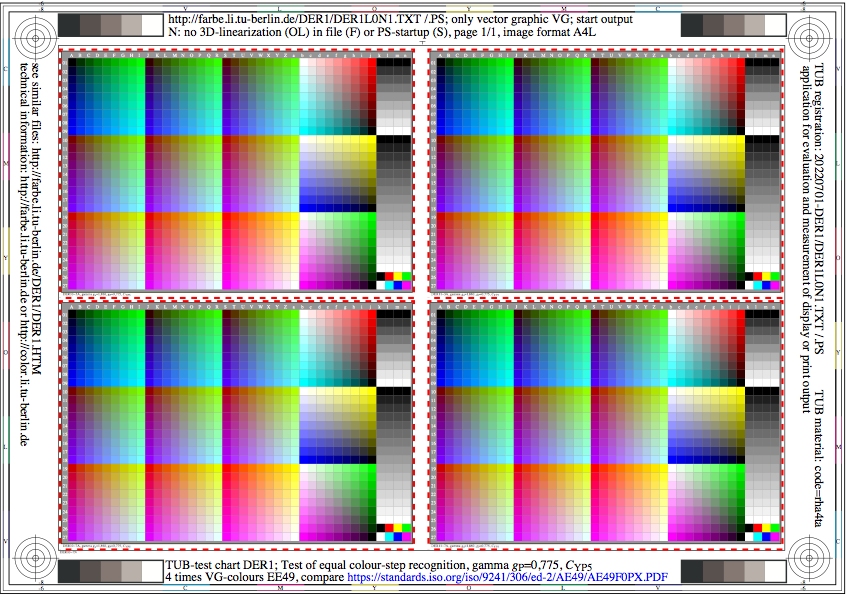
Figure DER1L0N1.jpg: Output in format A6 of the file
DER1L0NP.PDF, see
DER1L0N1.
PS /
TXT /
PDF /
jpg
DER1: TUB-test chart DER1; Test of equal colour-step recognition
4 times 1080 VG-standard colours, similar ISO 9241-306:AE49
Gamma ga=1,86, Gamma gP=0,775, ISO-contrast step CYP5
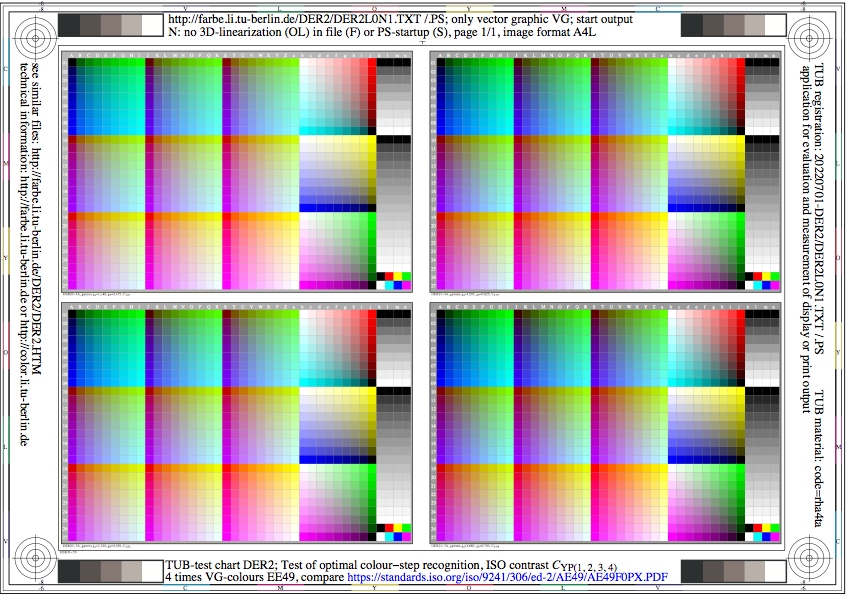
Figure DER2L0N1.jpg: Output in format A6 of the file
DER2L0NP.PDF, see
DER2L0N1.
PS /
TXT /
PDF /
jpg
DER2: TUB-test chart DER2; Test of optimal colour-step recognition
4 times 1080 VG-standard colours, similar ISO 9241-306:AE49
relative gamma 0,475<=gP<=0,700, ISO-contrast steps CYP1 to CYP4
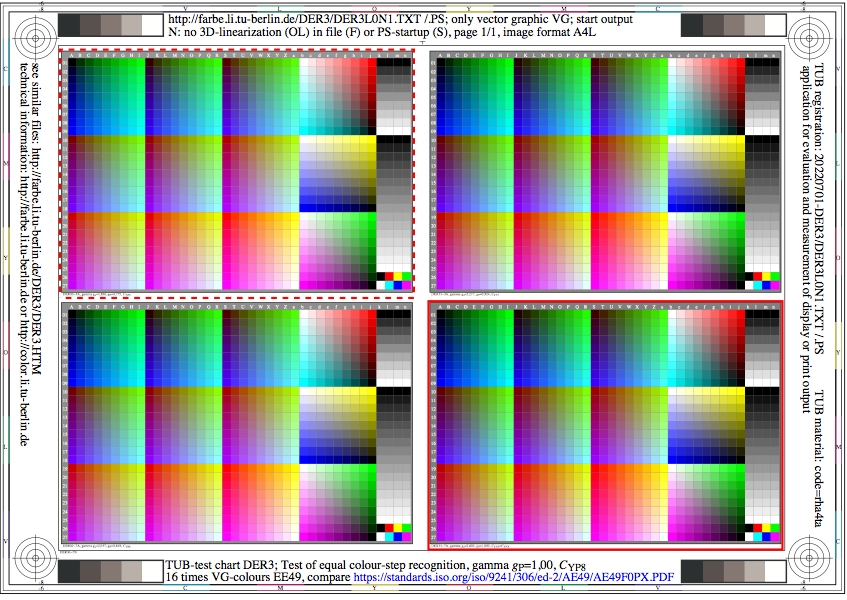
Figure DER3L0N1.jpg: Output in format A6 of the file
DER3L0NP.PDF, see
DER3L0N1.
PS /
TXT /
PDF /
jpg
DER3: TUB-test chart DER3; Test of optimal colour-step recognition
4 times 1080 VG-standard colours, similar ISO 9241-306:AE49
relative gamma 0,775<=gP<=1,000, ISO-contrast steps CYP5 to CYP8
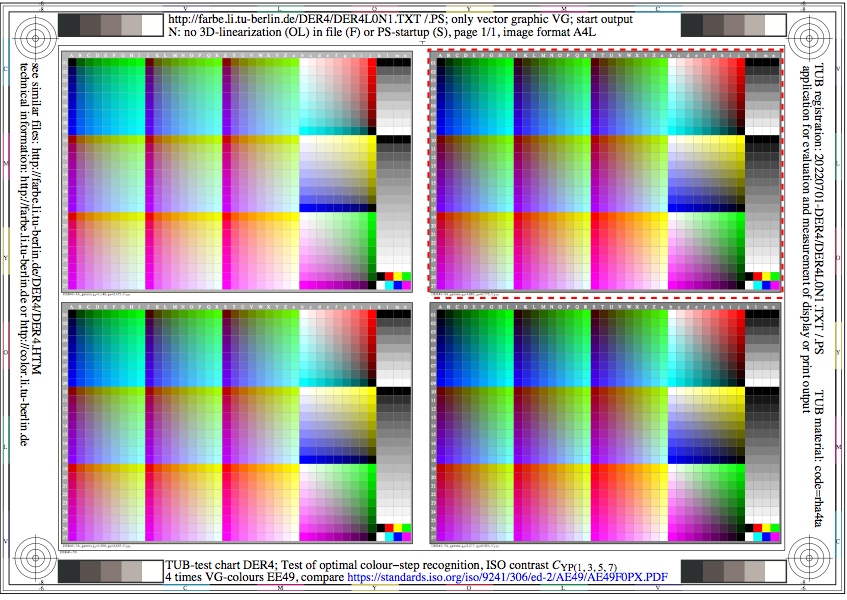
Figure DER4L0N1.jpg: Output in format A6 of the file
DER4L0NP.PDF, see
DER4L0N1.
PS /
TXT /
PDF /
jpg
DER4: TUB-test chart DER4; Test of optimal colour-step recognition
4 times 1080 VG-standard colours, similar ISO 9241-306:AE49
relative gamma 0,475<=gP<=0,924, contrast steps CYP(1, 3, 5, 7)

Figure DER5L0N1.jpg: Output in format A6 of the file
DER5L0NP.PDF, see
DER5L0N1.
PS /
TXT /
PDF /
jpg
DER5: TUB-test chart DER5; Test of optimal colour-step recognition
4 times 1080 VG-standard colours, similar ISO 9241-306:AE49
relative gamma 0,550<=gP<=1,000, contrast steps CYP(2, 4, 6, 8)
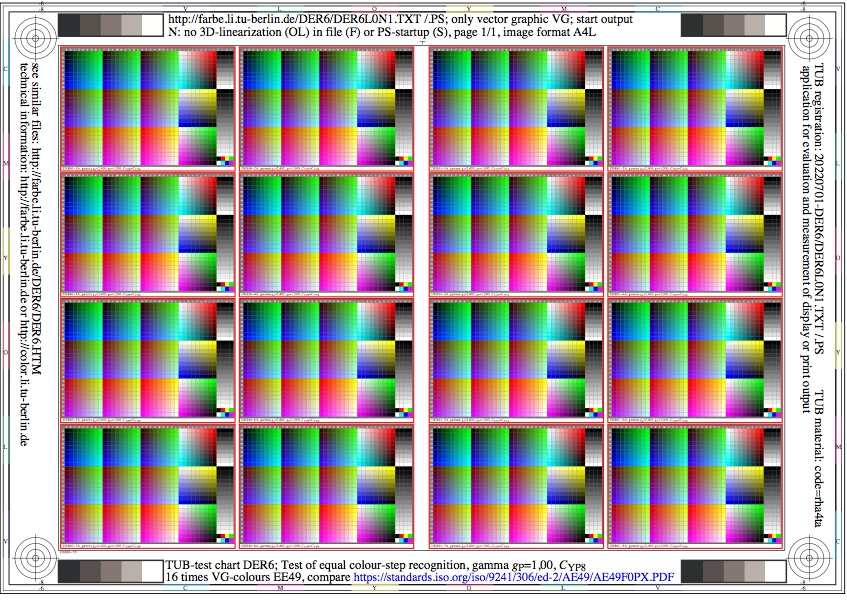
Figure DER6L0N1.jpg: Output in format A6 of the file
DER6L0NP.PDF, see
DER6L0N1.
PS /
TXT /
PDF /
jpg
DER6: TUB-test chart DER6; Test of equal colour-step recognition
16 times 1080 VG-standard colours, similar ISO 9241-306:AE49
Gamma ga=2,40, Gamma gP=1,00, ISO-contrast step CYP8

Figure DER7L0N1.jpg: Output in format A6 of the file
DER7L0NP.PDF, see
DER7L0N1.
PS /
TXT /
PDF /
jpg
DER7: TUB-test chart DER7; Test of equal colour-step recognition
16 times 1080 VG-standard colours, similar ISO 9241-306:AE49
Gamma ga=1,86, Gamma gP=0,775, ISO-contrast step CYP5
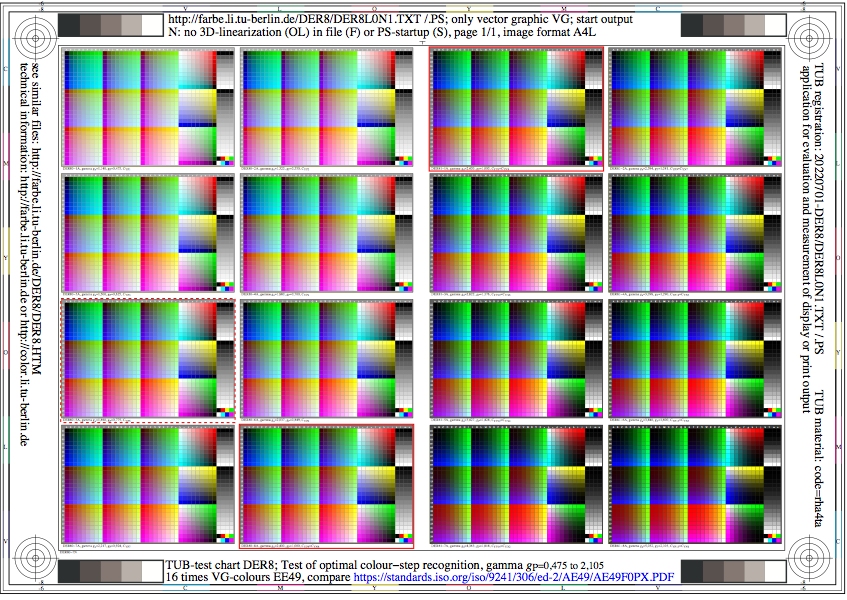
Figure DER8L0N1.jpg: Output in format A6 of the file
DER8L0NP.PDF, see
DER8L0N1.
PS /
TXT /
PDF /
jpg
DER8: TUB-test chart DER8; Test of optimal colour-step recognition
16 times 1080 VG-standard colours, similar ISO 9241-306:AE49
relative gamma 0,475<=gP<=2,11, ISO-contrast steps CYP1 to CYP15
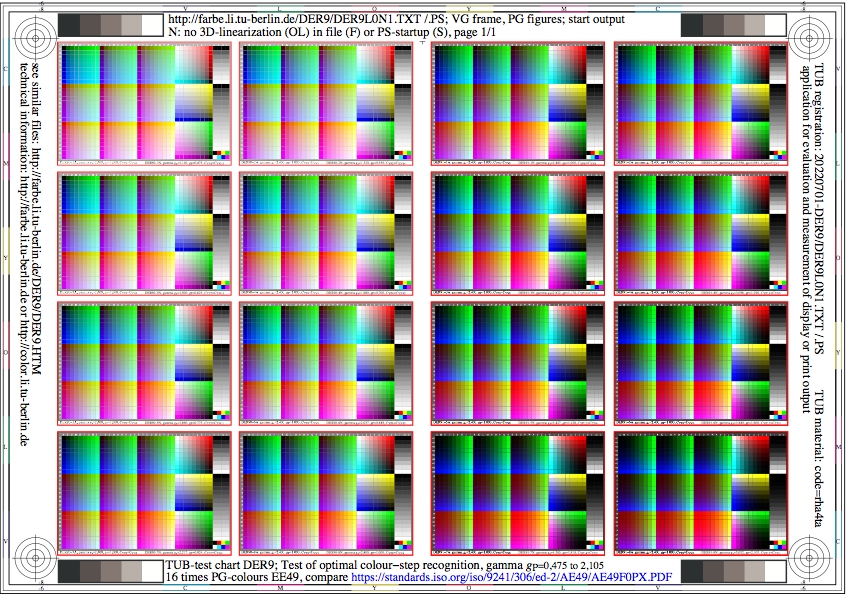
Figure DER9L0N1.jpg: Output in format A6 of the file
DER9L0NP.PDF, see
DER9L0N1.
PS /
TXT /
PDF /
jpg
DER9: TUB-test chart DER9; Test of optimal colour-step recognition
16 times 1080 PG-standard colours, similar ISO 9241-306:AE49
relative gamma 0,475<=gP<=2,11, ISO-contrast steps CYP1 to CYP15
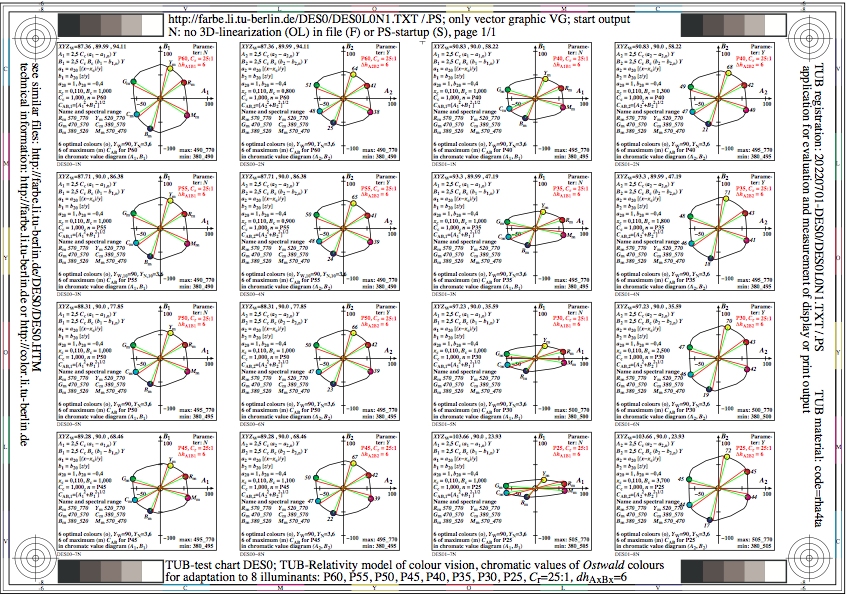
Figure DES0L0N1.jpg: Output in format A6 of the file
DES0L0NP.PDF, see
DES0L0N1.
PS /
TXT /
PDF /
jpg
DES0: TUB-test chart DES0; Chromatic adaptation: TUBLAB2 model
Ostwald optimal, threshold dhA2B2=6, 8 illuminants:
P60 (6000K), P55, P50, P45, P40, P35, P30, P25 (2500K)
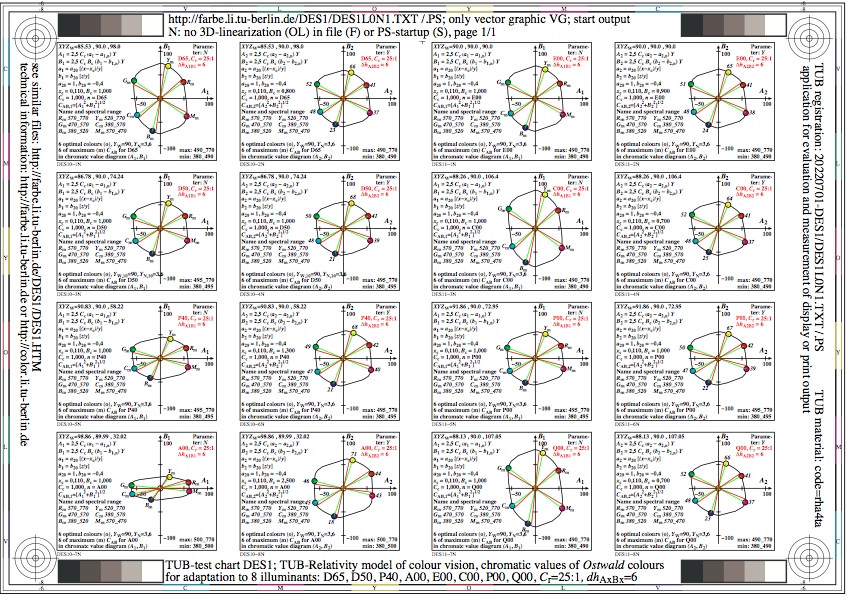
Figure DES1L0N1.jpg: Output in format A6 of the file
DES1L0NP.PDF, see
DES1L0N1.
PS /
TXT /
PDF /
jpg
DES1: TUB-test chart DES1; Chromatic adaptation: TUBLAB2 model
Ostwald colours, threshold dhA2B2=6, 8 illuminants:
D65 (6500K), D50, P40 (4000K), A00, E00, C00, P00, Q00
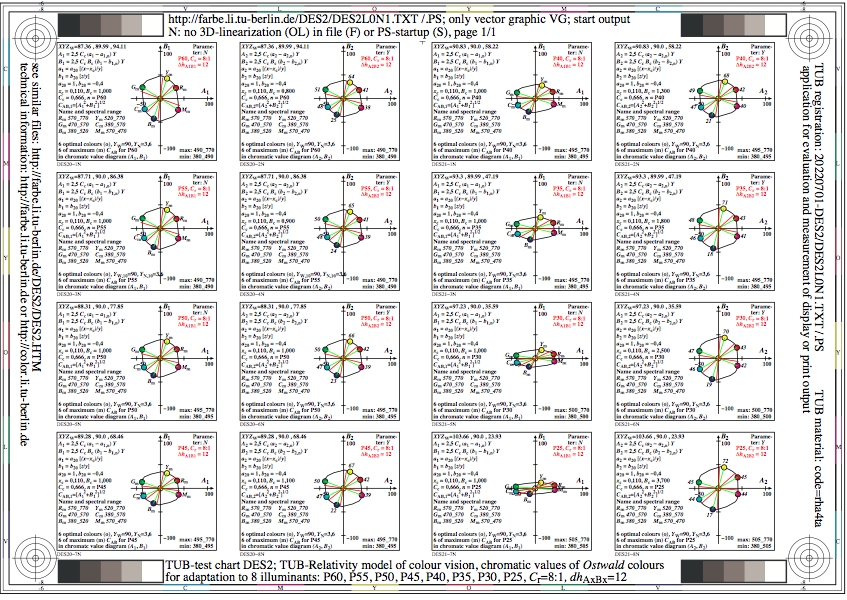
Figure DES2L0N1.jpg: Output in format A6 of the file
DES2L0NP.PDF, see
DES2L0N1.
PS /
TXT /
PDF /
jpg
DES2: TUB-test chart DES2; Chromatic adaptation: TUBLAB2 model
Ostwald colours, threshold dhA2B2=12, 8 illuminants:
P60 (6000K), P55, P50, P45, P40, P35, P30, P25 (2500K)
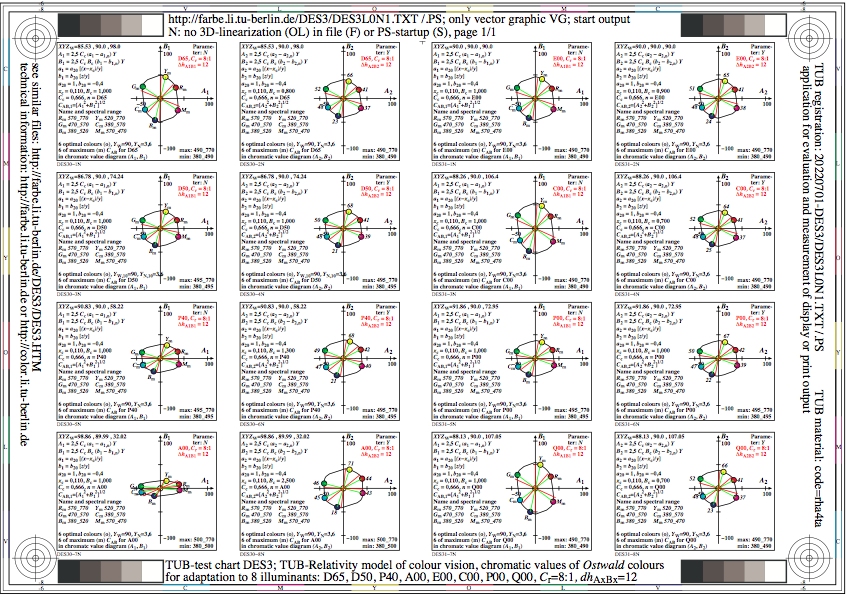
Figure DES3L0N1.jpg: Output in format A6 of the file
DES3L0NP.PDF, see
DES3L0N1.
PS /
TXT /
PDF /
jpg
DES3: TUB-test chart DES3; Chromatic adaptation: TUBLAB2 model
Ostwald colours, threshold dhA2B2=12, 8 illuminants:
D65 (6500K), D50, P40 (4000K), A00, E00, C00, P00, Q00
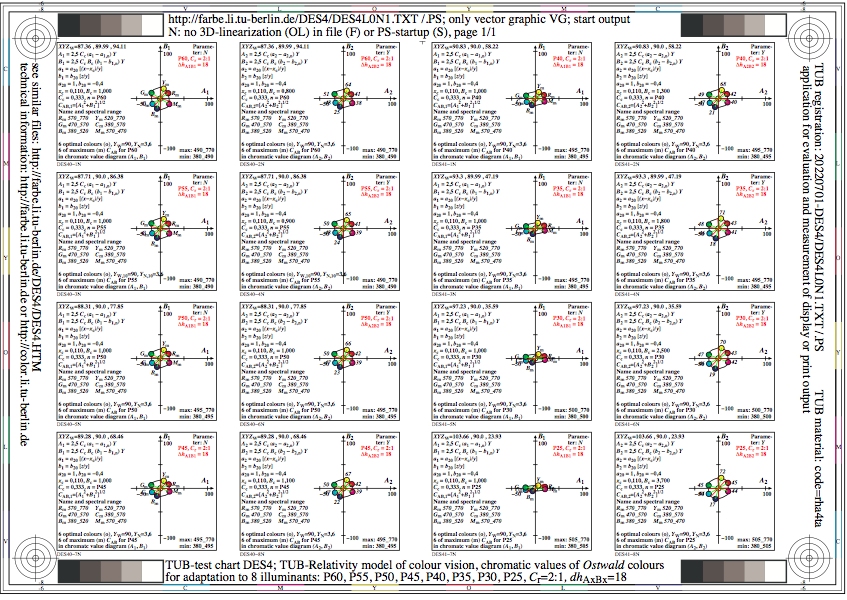
Figure DES4L0N1.jpg: Output in format A6 of the file
DES4L0NP.PDF, see
DES4L0N1.
PS /
TXT /
PDF /
jpg
DES4: TUB-test chart DES4; Chromatic adaptation: TUBLAB2 model
Ostwald colours, threshold dhA2B2=18, 8 illuminants:
P60 (6000K), P55, P50, P45, P40, P35, P30, P25 (2500K)
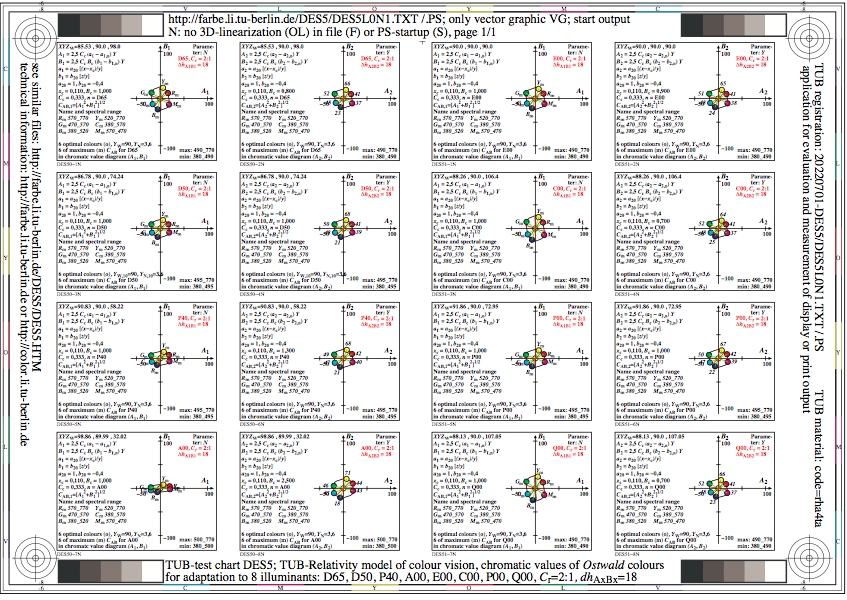
Figure DES5L0N1.jpg: Output in format A6 of the file
DES5L0NP.PDF, see
DES5L0N1.
PS /
TXT /
PDF /
jpg
DES5: TUB-test chart DES5; Chromatic adaptation: TUBLAB2 model
Ostwald colours, threshold dhA2B2=18, 8 illuminants:
D65 (6500K), D50, P40 (4000K), A00, E00, C00, P00, Q00
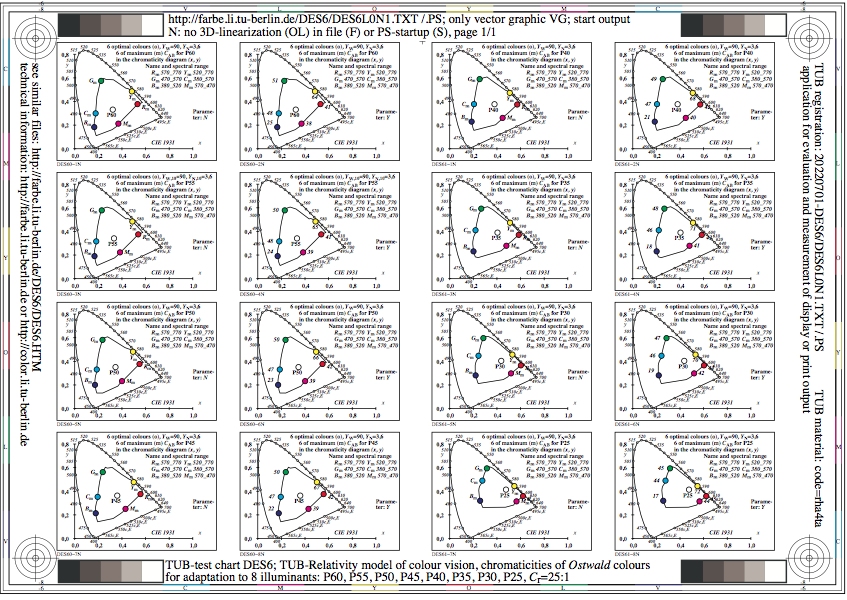
Figure DES6L0N1.jpg: Output in format A6 of the file
DES6L0NP.PDF, see
DES6L0N1.
PS /
TXT /
PDF /
jpg
DES6: TUB-test chart DES6; Chromatic adaptation: TUBLAB2 model
Ostwald colours, (x,y) chromaticities, 8 illuminants:
P60 (6000K), P55, P50, P45, P40, P35, P30, P25 (2500K)
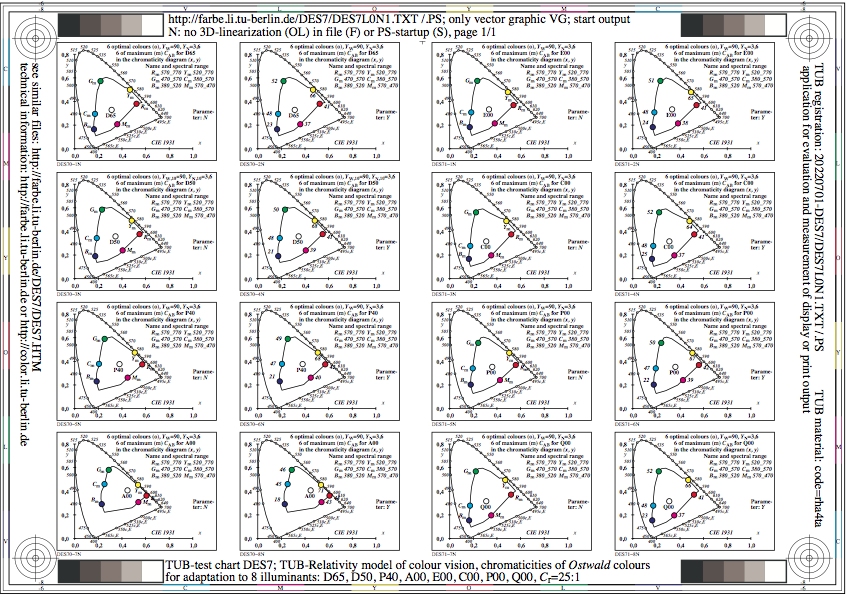
Figure DES7L0N1.jpg: Output in format A6 of the file
DES7L0NP.PDF, see
DES7L0N1.
PS /
TXT /
PDF /
jpg
DES7: TUB-test chart DES7; Chromatic adaptation: TUBLAB2 model
Ostwald colours, (x,y) chromaticities, 8 illuminants:
D65 (6500K), D50, P40 (4000K), A00, E00, C00, P00, Q00
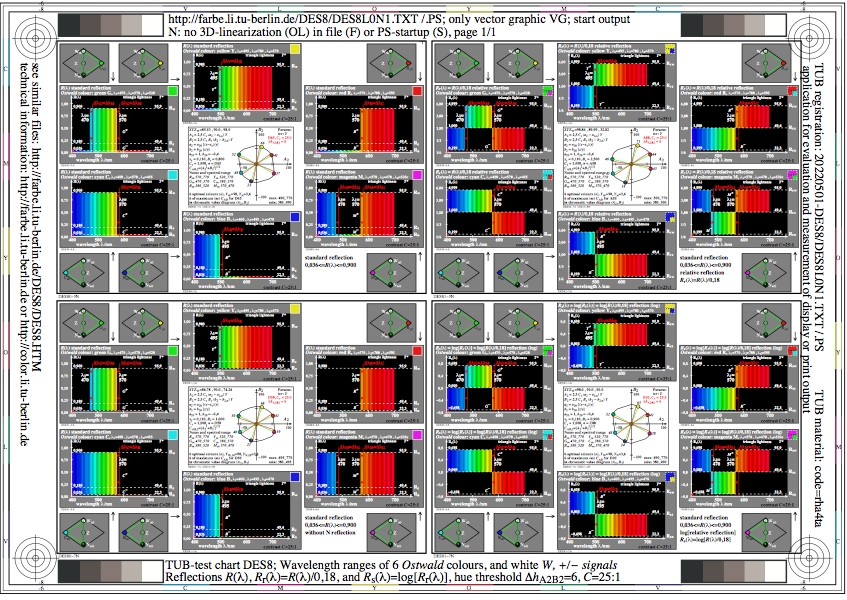
Figure DES8L0N1.jpg: Output in format A6 of the file
DES8L0NP.PDF, see
DES8L0N1.
PS /
TXT /
PDF /
jpg
DES8: TUB-test chart DES8; Wavelength ranges of 6
Ostwald colours, chromatic values, C=25:1, +-signals
Reflections R, Rr=R/0,18, Rs=log(Rr), hue threshold dhA2B2=6
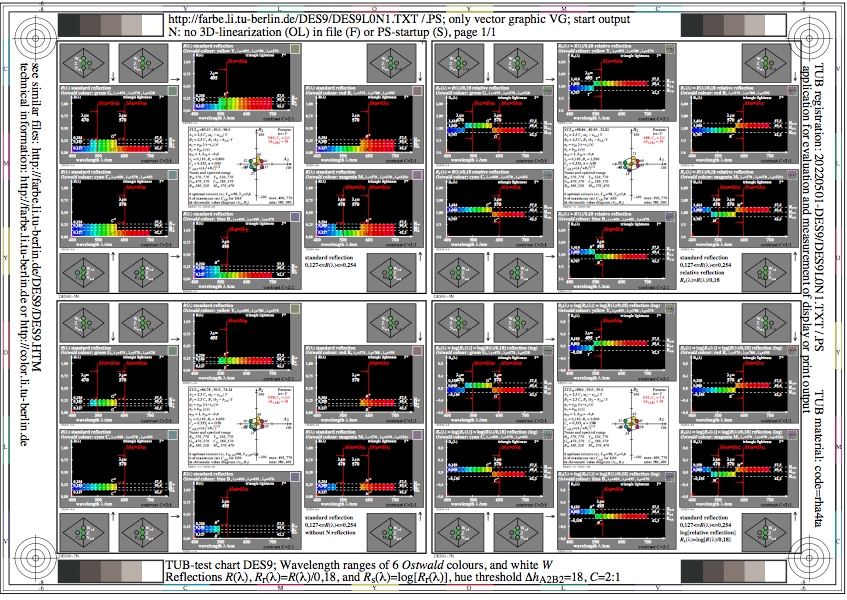
Figure DES9L0N1.jpg: Output in format A6 of the file
DES9L0NP.PDF, see
DES9L0N1.
PS /
TXT /
PDF /
jpg
DES9: TUB-test chart DES9; Wavelength ranges of 6
Ostwald colours, chromatic values, C=2:1, +-signals
Reflections R, Rr=R/0,18, Rs=log(Rr), hue threshold dhA2B2=18

Figure DET0L0N1.jpg: Output in format A6 of the file
DET0L0NP.PDF, see
DET0L0N1.
PS /
TXT /
PDF /
jpg
DET0: TUB-Prüfvorlage DET0; Ostwald optimal colours
YB1 and GM1 data, 8 Dxx iluminants, CIE-2degree observer
CIEXYZ und (A, B, CAB, A1, B1, CA1B1)-Daten, lamda_d, lamda_c
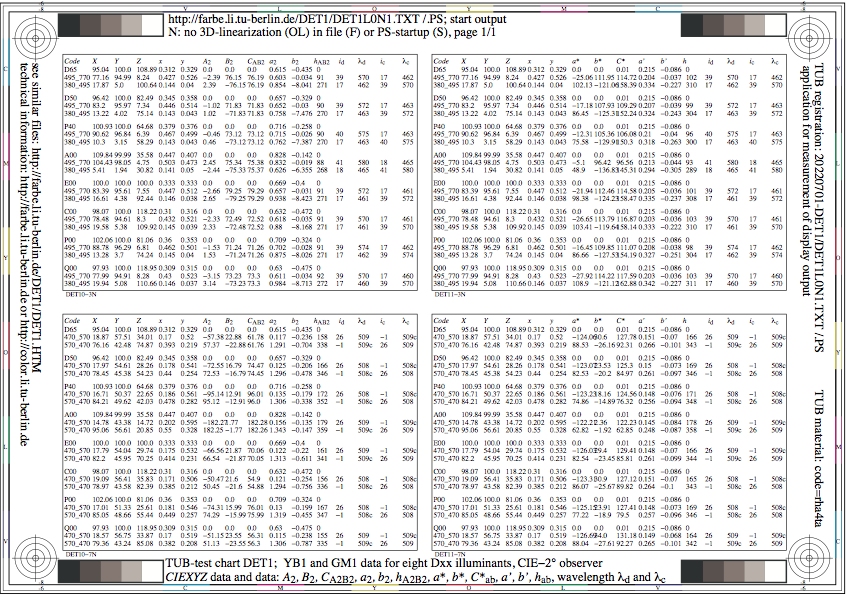
Figure DET1L0N1.jpg: Output in format A6 of the file
DET1L0NP.PDF, see
DET1L0N1.
PS /
TXT /
PDF /
jpg
DET1: TUB-Prüfvorlage DET1; Ostwald optimal colours
YB1 and GM1 data, 8 Dxx iluminants, CIE-2degree observer
CIEXYZ und (A2, B2, CAB2, a*, b*, C*ab)-Daten, lamda_d, lamda_c

Figure DET2L0N1.jpg: Output in format A6 of the file
DET2L0NP.PDF, see
DET2L0N1.
PS /
TXT /
PDF /
jpg
DET2: TUB-Prüfvorlage DET2; Ostwald optimal colours
YB1 and GM1 data, 8 Pxx iluminants, CIE-2degree observer
CIEXYZ und (A, B, CAB, A1, B1, CA1B1)-Daten, lamda_d, lamda_c
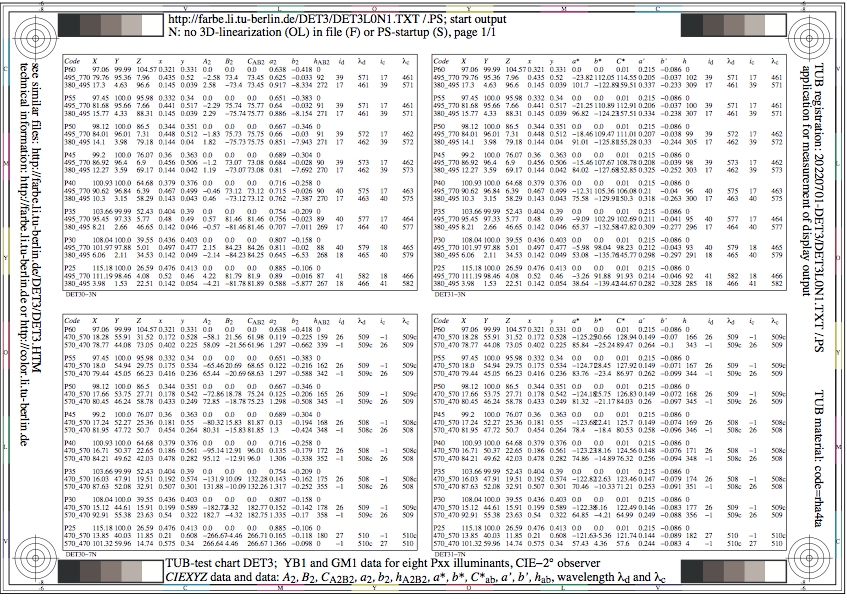
Figure DET3L0N1.jpg: Output in format A6 of the file
DET3L0NP.PDF, see
DET3L0N1.
PS /
TXT /
PDF /
jpg
DET3: TUB-Prüfvorlage DET3; Ostwald optimal colours
YB1 and GM1 data, 8 Pxx iluminants, CIE-2degree observer
CIEXYZ und (A2, B2, CAB2, a*, b*, C*ab)-Daten, lamda_d, lamda_c

Figure DET4L0N1.jpg: Output in format A6 of the file
DET4L0NP.PDF, see
DET4L0N1.
PS /
TXT /
PDF /
jpg
DET4: TUB-Prüfvorlage DET4; Ostwald optimal colours
YB1 and GM1 data, 8 Dxx iluminants, CIE-10degree observer
CIEXYZ und (A, B, CAB, A1, B1, CA1B1)-Daten, lamda_d, lamda_c
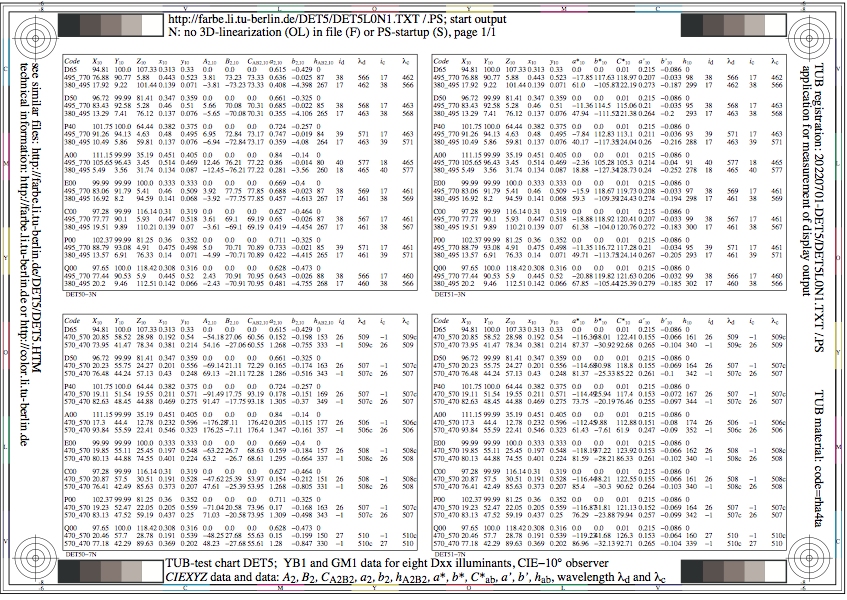
Figure DET5L0N1.jpg: Output in format A6 of the file
DET5L0NP.PDF, see
DET5L0N1.
PS /
TXT /
PDF /
jpg
DET5: TUB-Prüfvorlage DET5; Ostwald optimal colours
YB1 and GM1 data, 8 Dxx iluminants, CIE-10degree observer
CIEXYZ und (A2, B2, CAB2, a*, b*, C*ab)-Daten, lamda_d, lamda_c
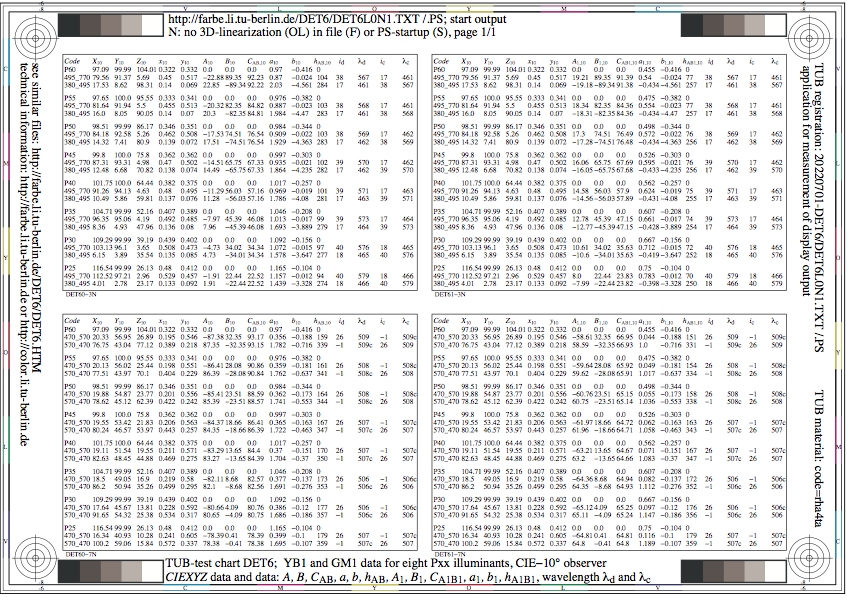
Figure DET6L0N1.jpg: Output in format A6 of the file
DET6L0NP.PDF, see
DET6L0N1.
PS /
TXT /
PDF /
jpg
DET6: TUB-Prüfvorlage DET6; Ostwald optimal colours
YB1 and GM1 data, 8 Pxx iluminants, CIE-10degree observer
CIEXYZ und (A, B, CAB, A1, B1, CA1B1)-Daten, lamda_d, lamda_c
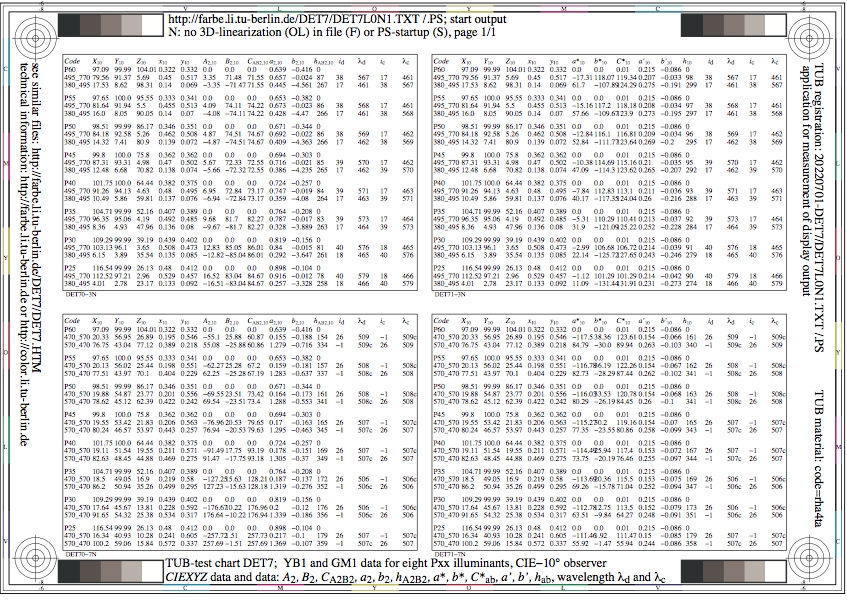
Figure DET7L0N1.jpg: Output in format A6 of the file
DET7L0NP.PDF, see
DET7L0N1.
PS /
TXT /
PDF /
jpg
DET7: TUB-Prüfvorlage DET7; Ostwald optimal colours
YB1 and GM1 data, 8 Pxx iluminants, CIE-10degree observer
CIEXYZ und (A2, B2, CAB2, a*, b*, C*ab)-Daten, lamda_d, lamda_c
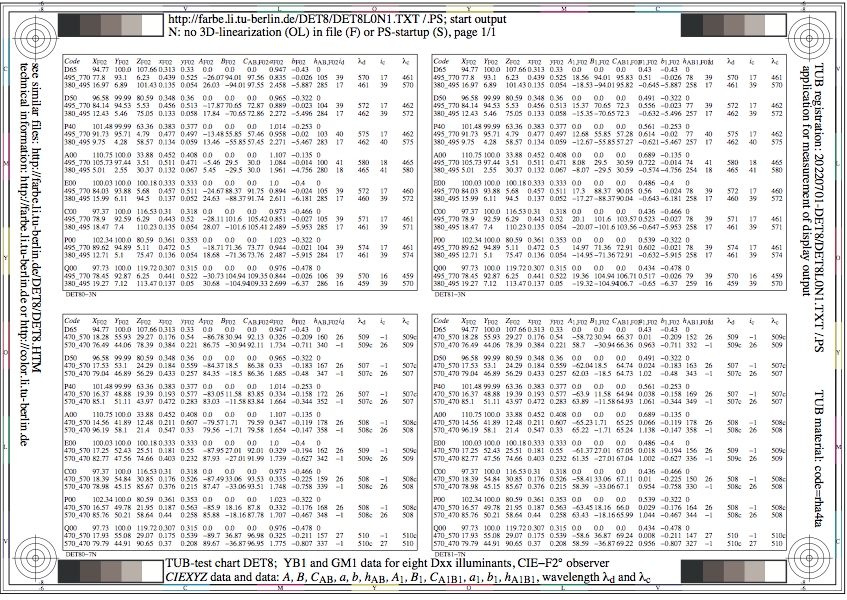
Figure DET8L0N1.jpg: Output in format A6 of the file
DET8L0NP.PDF, see
DET8L0N1.
PS /
TXT /
PDF /
jpg
DET8: TUB-Prüfvorlage DET8; Ostwald optimal colours
YB1 and GM1 data, 8 Dxx iluminants, CIE-F02degree observer
CIEXYZ und (A2, B2, CAB2, a*, b*, C*ab)-Daten, lamda_d, lamda_c

Figure DET9L0N1.jpg: Output in format A6 of the file
DET9L0NP.PDF, see
DET9L0N1.
PS /
TXT /
PDF /
jpg
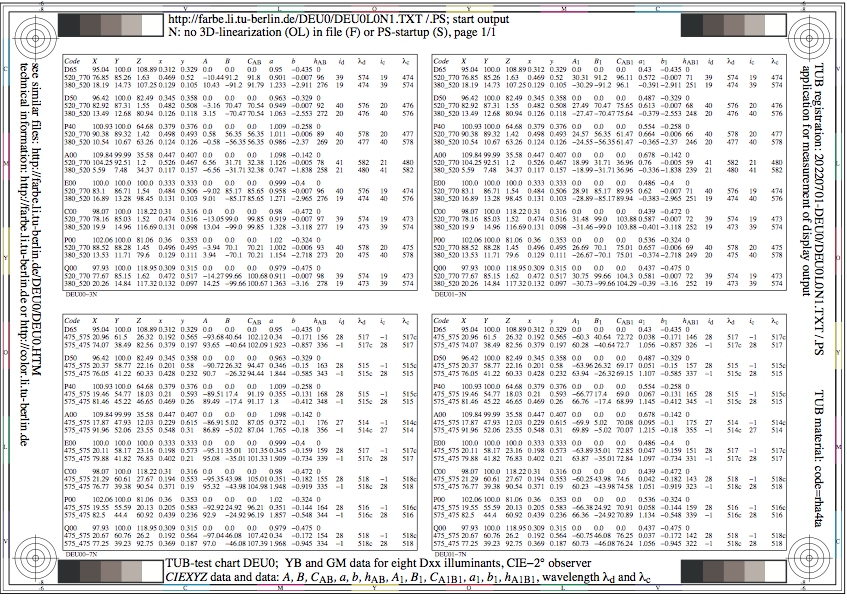
Figure DEU0L0N1.jpg: Output in format A6 of the file
DEU0L0NP.PDF, see
DEU0L0N1.
PS /
TXT /
PDF /
jpg
DEU0: TUB-Prüfvorlage DEU0; Ostwald optimal colours
YB and GM data, 8 Dxx iluminants, CIE-2degree observer
CIEXYZ und (A, B, CAB, A1, B1, CA1B1)-Daten, lamda_d, lamda_c

Figure DEU1L0N1.jpg: Output in format A6 of the file
DEU1L0NP.PDF, see
DEU1L0N1.
PS /
TXT /
PDF /
jpg
DEU1: TUB-Prüfvorlage DEU1; Ostwald optimal colours
YB and GM data, 8 Dxx iluminants, CIE-2degree observer
CIEXYZ und (A2, B2, CAB2, a*, b*, C*ab)-Daten, lamda_d, lamda_c
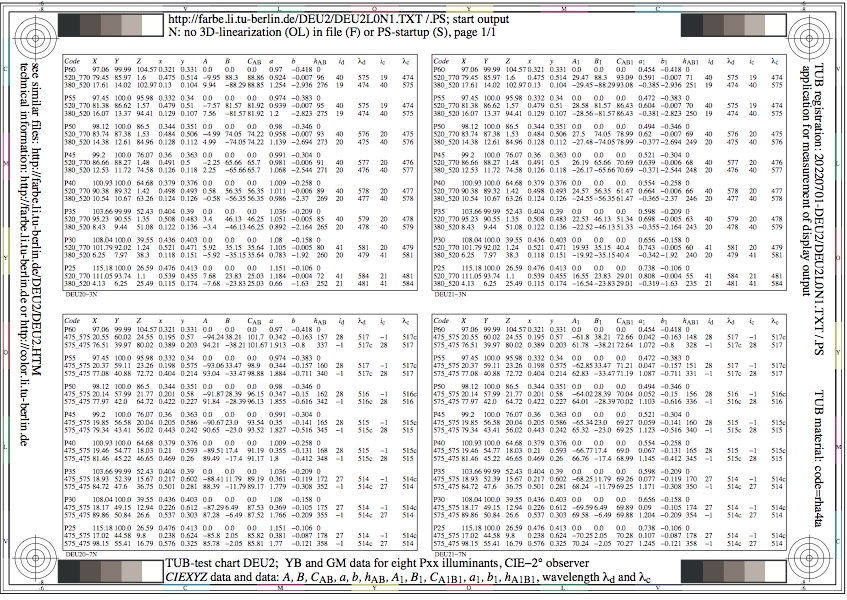
Figure DEU2L0N1.jpg: Output in format A6 of the file
DEU2L0NP.PDF, see
DEU2L0N1.
PS /
TXT /
PDF /
jpg
DEU2: TUB-Prüfvorlage DEU2; Ostwald optimal colours
YB and GM data, 8 Pxx iluminants, CIE-2degree observer
CIEXYZ und (A, B, CAB, A1, B1, CA1B1)-Daten, lamda_d, lamda_c
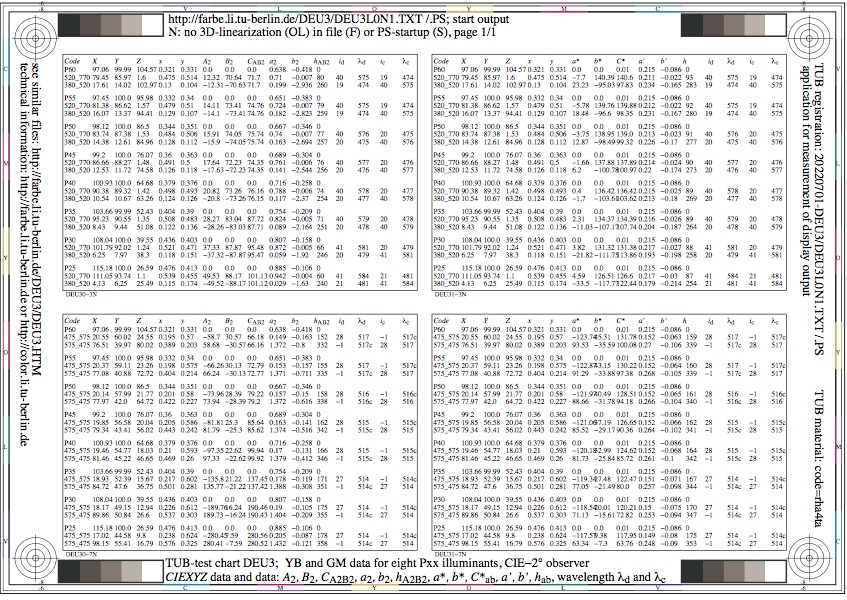
Figure DEU3L0N1.jpg: Output in format A6 of the file
DEU3L0NP.PDF, see
DEU3L0N1.
PS /
TXT /
PDF /
jpg
DEU3: TUB-Prüfvorlage DEU3; Ostwald optimal colours
YB and GM data, 8 Pxx iluminants, CIE-2degree observer
CIEXYZ und (A2, B2, CAB2, a*, b*, C*ab)-Daten, lamda_d, lamda_c

Figure DEU4L0N1.jpg: Output in format A6 of the file
DEU4L0NP.PDF, see
DEU4L0N1.
PS /
TXT /
PDF /
jpg
DEU4: TUB-Prüfvorlage DEU4; Ostwald optimal colours
YB and GM data, 8 Dxx iluminants, CIE-10degree observer
CIEXYZ und (A, B, CAB, A1, B1, CA1B1)-Daten, lamda_d, lamda_c
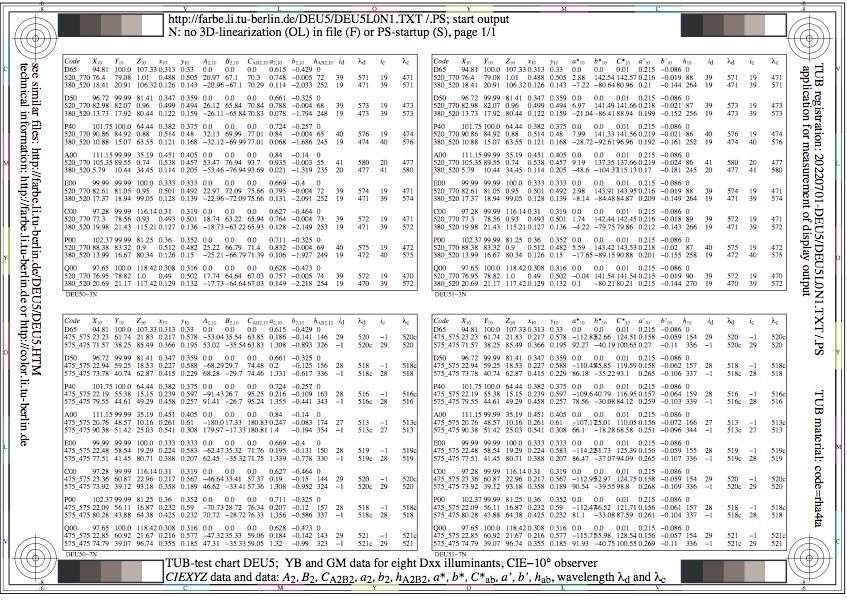
Figure DEU5L0N1.jpg: Output in format A6 of the file
DEU5L0NP.PDF, see
DEU5L0N1.
PS /
TXT /
PDF /
jpg
DEU5: TUB-Prüfvorlage DEU5; Ostwald optimal colours
YB and GM data, 8 Dxx iluminants, CIE-10degree observer
CIEXYZ und (A2, B2, CAB2, a*, b*, C*ab)-Daten, lamda_d, lamda_c
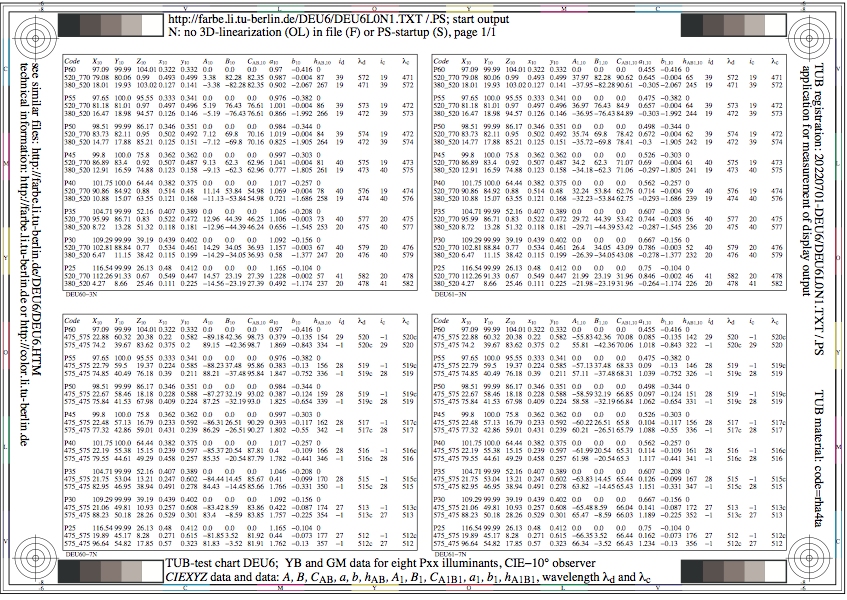
Figure DEU6L0N1.jpg: Output in format A6 of the file
DEU6L0NP.PDF, see
DEU6L0N1.
PS /
TXT /
PDF /
jpg
DEU6: TUB-Prüfvorlage DEU6; Ostwald optimal colours
YB and GM data, 8 Pxx iluminants, CIE-10degree observer
CIEXYZ und (A, B, CAB, A1, B1, CA1B1)-Daten, lamda_d, lamda_c
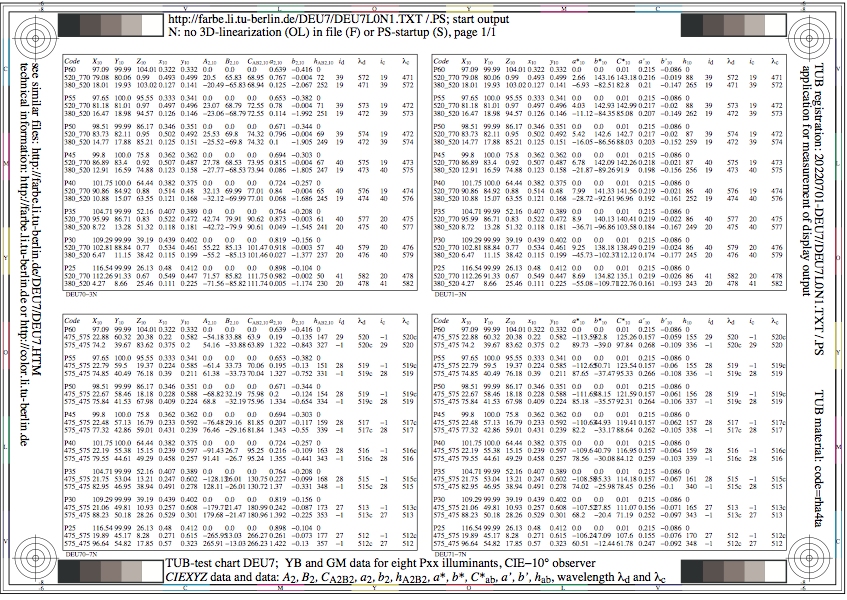
Figure DEU7L0N1.jpg: Output in format A6 of the file
DEU7L0NP.PDF, see
DEU7L0N1.
PS /
TXT /
PDF /
jpg
DEU7: TUB-Prüfvorlage DEU7; Ostwald optimal colours
YB and GM data, 8 Pxx iluminants, CIE-10degree observer
CIEXYZ und (A2, B2, CAB2, a*, b*, C*ab)-Daten, lamda_d, lamda_c
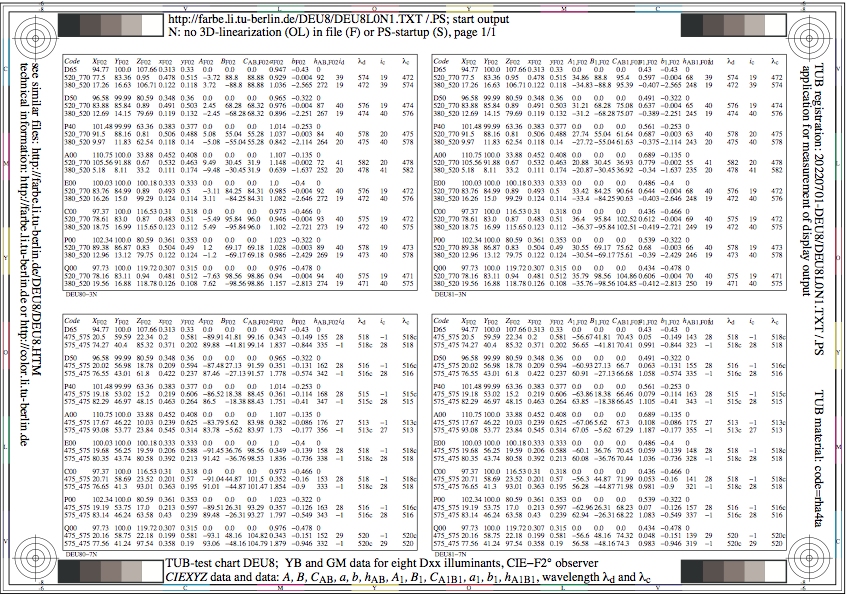
Figure DEU8L0N1.jpg: Output in format A6 of the file
DEU8L0NP.PDF, see
DEU8L0N1.
PS /
TXT /
PDF /
jpg
DEU8: TUB-Prüfvorlage DEU8; Ostwald optimal colours
YB and GM data, 8 Dxx iluminants, CIE-F02degree observer
CIEXYZ und (A2, B2, CAB2, a*, b*, C*ab)-Daten, lamda_d, lamda_c

Figure DEU9L0N1.jpg: Output in format A6 of the file
DEU9L0NP.PDF, see
DEU9L0N1.
PS /
TXT /
PDF /
jpg
DEU9: TUB-Prüfvorlage DEU9; Ostwald optimal colours
YB and GM data, 8 Pxx iluminants, CIE-F10degree observer
CIEXYZ und (A2, B2, CAB2, a*, b*, C*ab)-Daten,lamda_d, lamda_c

Figure DEV0L0N1.jpg: Output in format A6 of the file
DEV0L0NP.PDF, see
DEV0L0N1.
PS /
TXT /
PDF /
jpg
DEV0: TUB-test chart DEV0; Chromatic adaptation TUBLAB2 model
Ostwald optimal colours for 8 illuminants:
P60 (6000K), P55, P50, P45, P40, P35, P30, P25 (2500K)
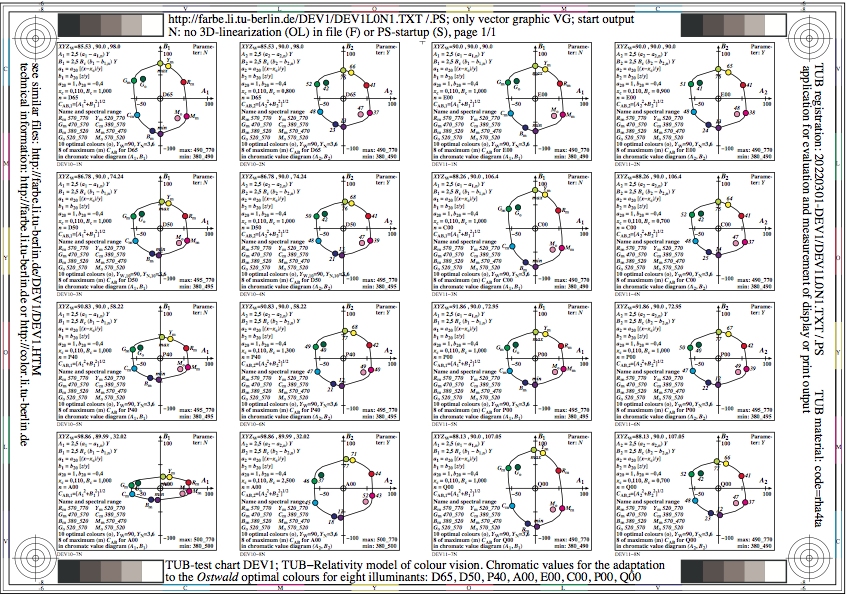
Figure DEV1L0N1.jpg: Output in format A6 of the file
DEV1L0NP.PDF, see
DEV1L0N1.
PS /
TXT /
PDF /
jpg
DEV1: TUB-test chart DEV1; Chromatic adaptation, TUBLAB2 model
Ostwald optimal colours for 8 illuminants:
D65 (6500K), D50, P40 (4000K), A00, E00, C00, P00, Q00
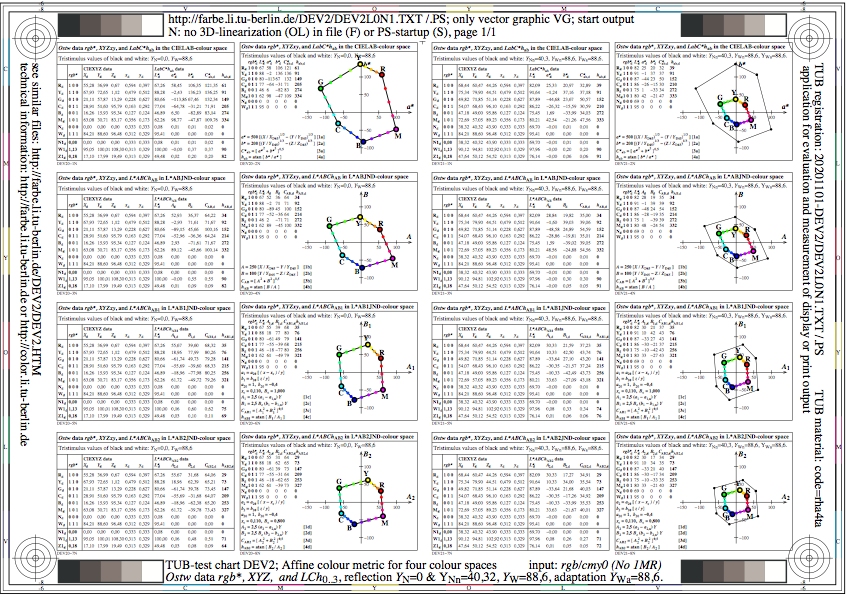
Figure DEV2L0N1.jpg: Output in format A6 of the file
DEV2L0NP.PDF, see
DEV2L0N1.
PS /
TXT /
PDF /
jpg
DEV2: TUB-test chart DEV2; Ostwald-display reflections
rgb* input and L*ABCh output in device hue planes
Reflections YN=0 and YNn=40,3, adaptation YWa=88,6
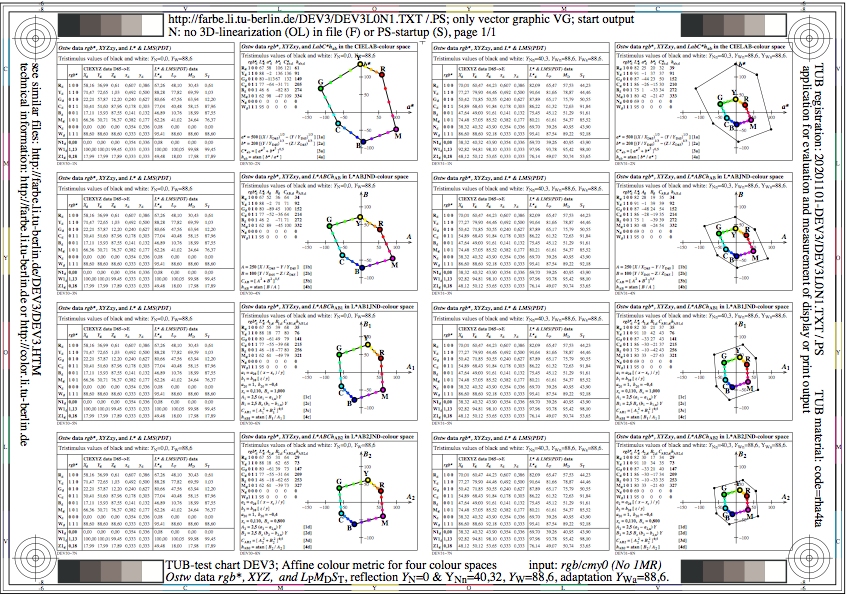
Figure DEV3L0N1.jpg: Output in format A6 of the file
DEV3L0NP.PDF, see
DEV3L0N1.
PS /
TXT /
PDF /
jpg
DEV3: TUB-test chart DEV3; Ostwald-display reflections
rgb* input and LMS(PDT) output in device hue planes
Reflections YN=0 and YNn=40,3, adaptation YWa=88,6
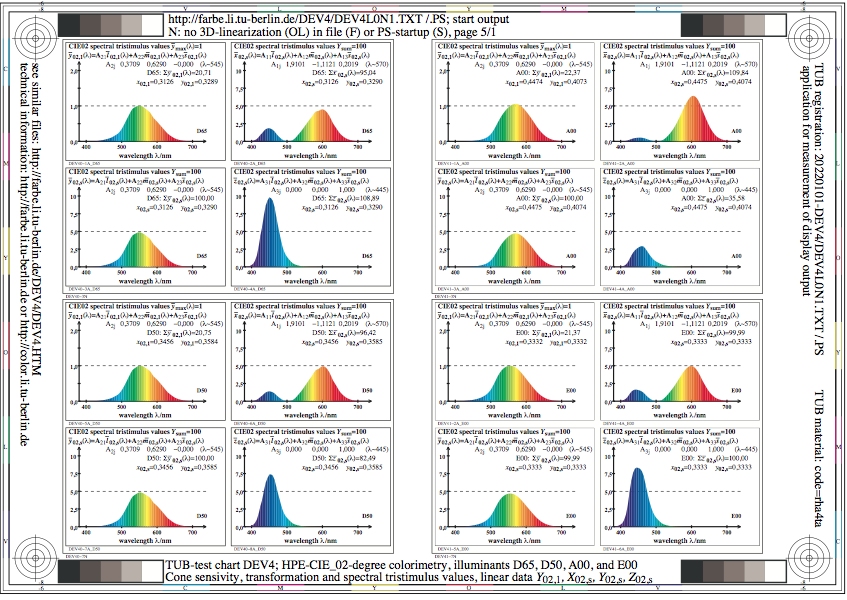
Figure DEV4L0N1.jpg: Output in format A6 of the file
DEV4L0NP.PDF, see
DEV4L0N1.
PS /
TXT /
PDF /
jpg
DEV4: TUB-test chart DEV4; HPE_CIE_02-degree colorimetry
four illuminants D65, D50, A00, and E00, Y02,1, (XYZ)02,s
cone sensitivities, transfer and spectral values

Figure DEV5L0N1.jpg: Output in format A6 of the file
DEV5L0NP.PDF, see
DEV5L0N1.
PS /
TXT /
PDF /
jpg
DEV5: TUB-test chart DEV5; HPE_CIE_02-degree colorimetry
four illuminants D65, D50, A00, and E00, Y02,1, LMS(PDT)02,s
cone sensitivities, transfer and spectral values

Figure DEV6L0N1.jpg: Output in format A6 of the file
DEV6L0NP.PDF, see
DEV6L0N1.
PS /
TXT /
PDF /
jpg
DEV6: TUB-test chart DEV6; Chromatic adaptation: TUBLAB2 model
Ostwald optimal, threshold dhA2B2=6, 8 illuminants:
P60 (6000K), P55, P50, P45, P40, P35, P30, P25 (2500K)

Figure DEV7L0N1.jpg: Output in format A6 of the file
DEV7L0NP.PDF, see
DEV7L0N1.
PS /
TXT /
PDF /
jpg
DEV7: TUB-test chart DEV7; Chromatic adaptation: TUBLAB2 model
Ostwald colours, threshold dhA2B2=6, 8 illuminants:
D65 (6500K), D50, P40 (4000K), A00, E00, C00, P00, Q00
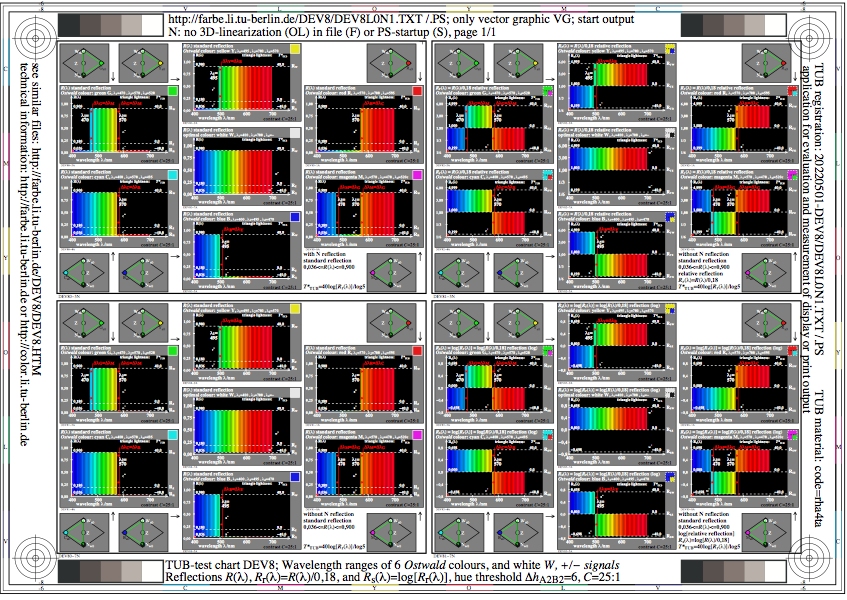
Figure DEV8L0N1.jpg: Output in format A6 of the file
DEV8L0NP.PDF, see
DEV8L0N1.
PS /
TXT /
PDF /
jpg
DEV8: TUB-test chart DEV8; Wavelength ranges of 6
Ostwald colours and W, contrast C=25:1, +-signals
Reflections R, Rr=R/0,18, Rs=log(Rr), hue threshold dhA2B2=6
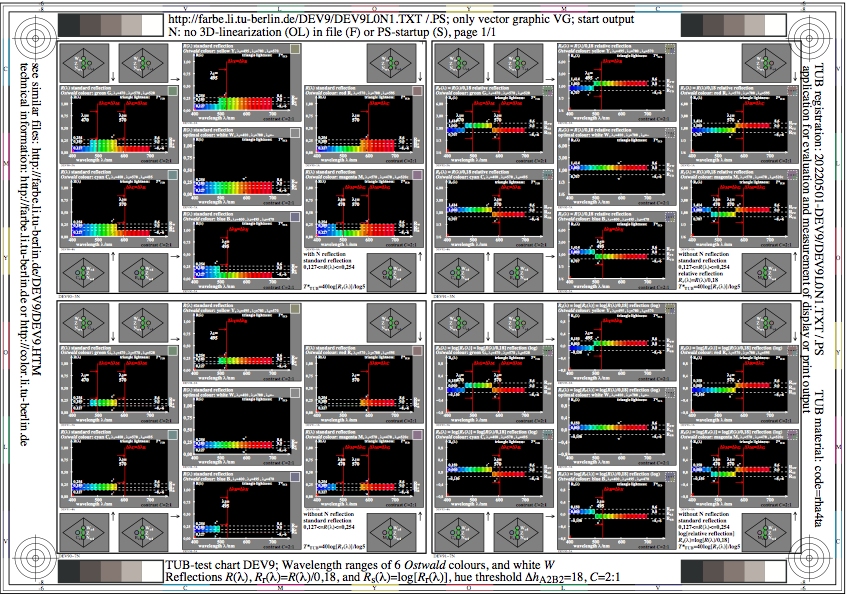
Figure DEV9L0N1.jpg: Output in format A6 of the file
DEV9L0NP.PDF, see
DEV9L0N1.
PS /
TXT /
PDF /
jpg
DEV9: TUB-test chart DEV9; Wavelength ranges of 6
Ostwald colours and W, contrast C=2:1, +-signals
Reflections R, Rr=R/0,18, Rs=log(Rr), hue threshold dhA2B2=18

Figure DEW0L0N1.jpg: Output in format A6 of the file
DEW0L0NP.PDF, see
DEW0L0N1.
PS /
TXT /
PDF /
jpg
DEW0: TUB-test chart DEW0; Wavelength ranges of 6
Ostwald colours and Ww0, contrast C=25:1
Reflections R, Rr=R/0,18, Rs=log(Rr), and T*TUB, eRYGCBMn0
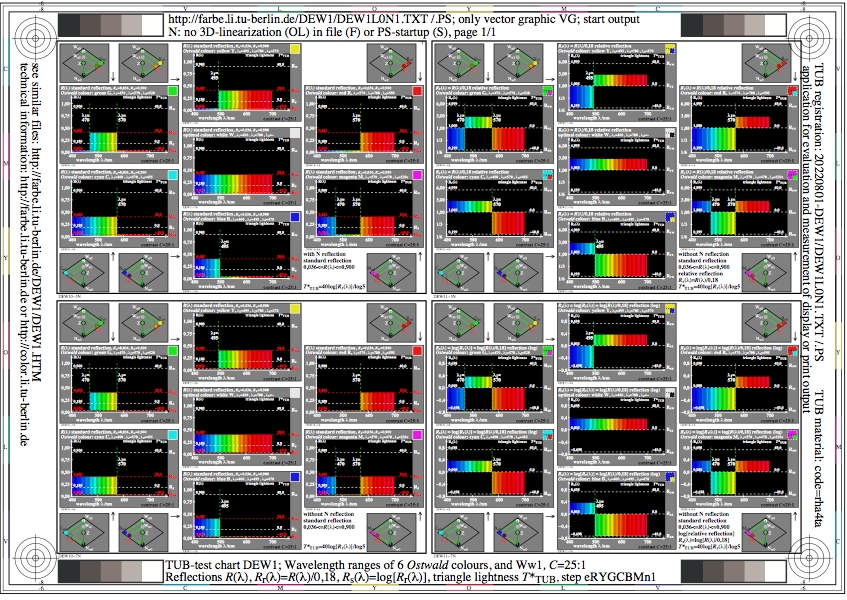
Figure DEW1L0N1.jpg: Output in format A6 of the file
DEW1L0NP.PDF, see
DEW1L0N1.
PS /
TXT /
PDF /
jpg
DEW1: TUB-test chart DEW1; Wavelength ranges of six
Ostwald colours and Ww1, contrast C=25:1
Reflections R, Rr=R/0,18, Rs=log(Rr), and T*TUB, eRYGCBMn1
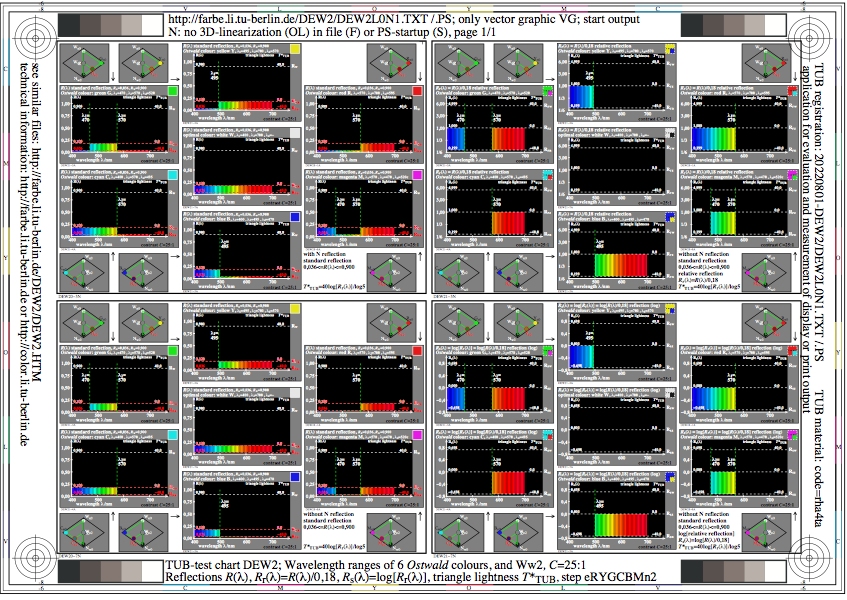
Figure DEW2L0N1.jpg: Output in format A6 of the file
DEW2L0NP.PDF, see
DEW2L0N1.
PS /
TXT /
PDF /
jpg
DEW2: TUB-test chart DEW2; Wavelength ranges of six
Ostwald colours and Ww2, contrast C=25:1
Reflections R, Rr=R/0,18, Rs=log(Rr), and T*TUB, eRYGCBMn2
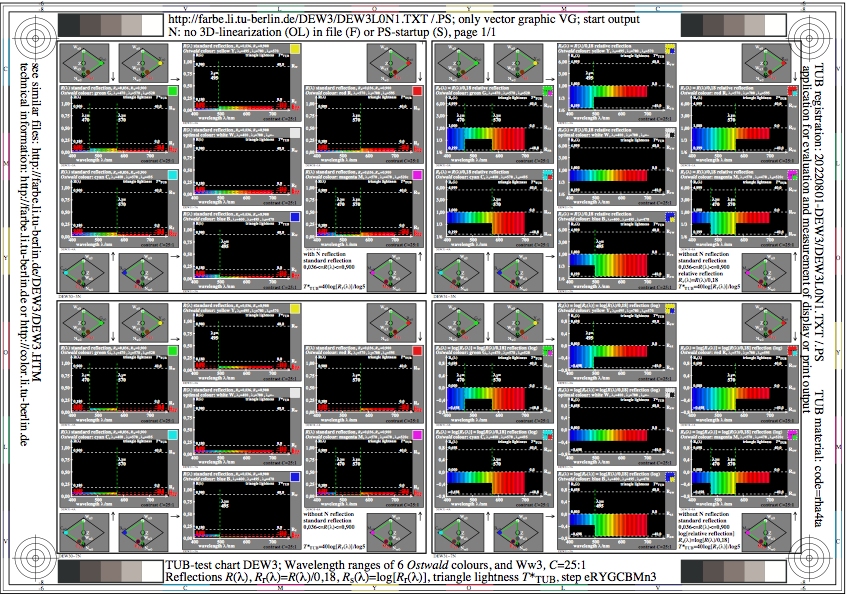
Figure DEW3L0N1.jpg: Output in format A6 of the file
DEW3L0NP.PDF, see
DEW3L0N1.
PS /
TXT /
PDF /
jpg
DEW3: TUB-test chart DEW3; Wavelength ranges of six
Ostwald colours and Ww3, contrast C=25:1
Reflections R, Rr=R/0,18, Rs=log(Rr), and T*TUB, eRYGCBMn3
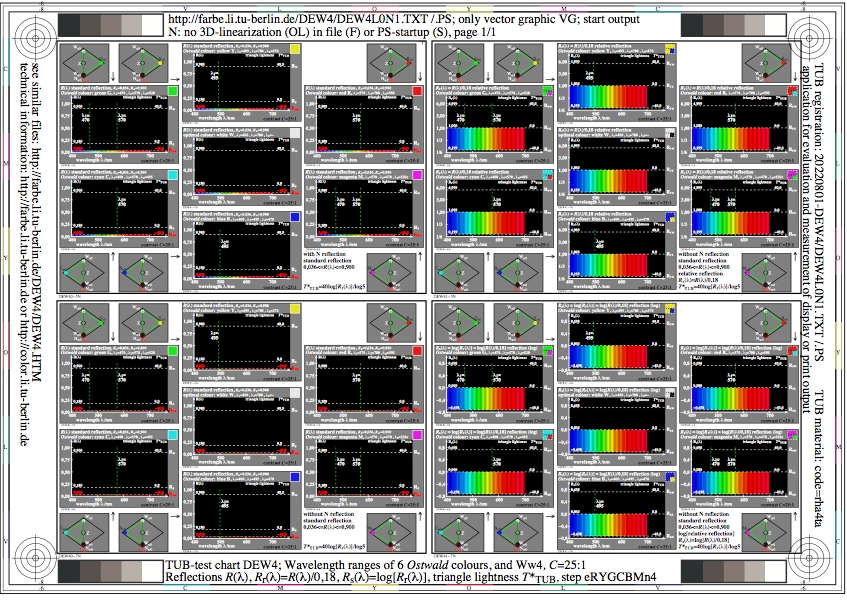
Figure DEW4L0N1.jpg: Output in format A6 of the file
DEW4L0NP.PDF, see
DEW4L0N1.
PS /
TXT /
PDF /
jpg
DEW4: TUB-test chart DEW4; Wavelength ranges of six
Ostwald colours and Ww4, contrast C=25:1
Reflections R, Rr=R/0,18, Rs=log(Rr), and T*TUB, eRYGCBMn4
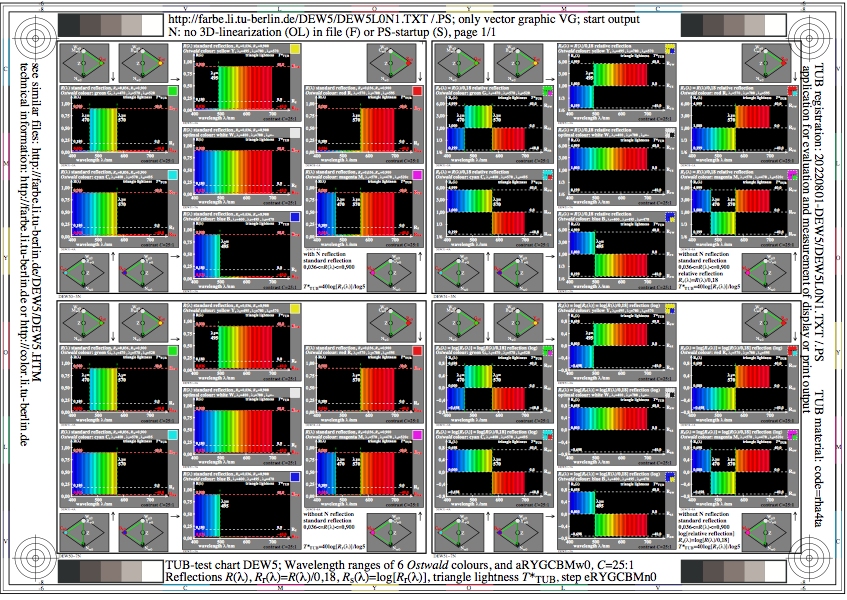
Figure DEW5L0N1.jpg: Output in format A6 of the file
DEW5L0NP.PDF, see
DEW5L0N1.
PS /
TXT /
PDF /
jpg
DEW5: TUB-test chart DEW5; Wavelength ranges of six
Ostwald colours and aRYGCBw0, contrast C=25:1
Reflections R, Rr=R/0,18, Rs=log(Rr), and T*TUB, eRYGCBMn0
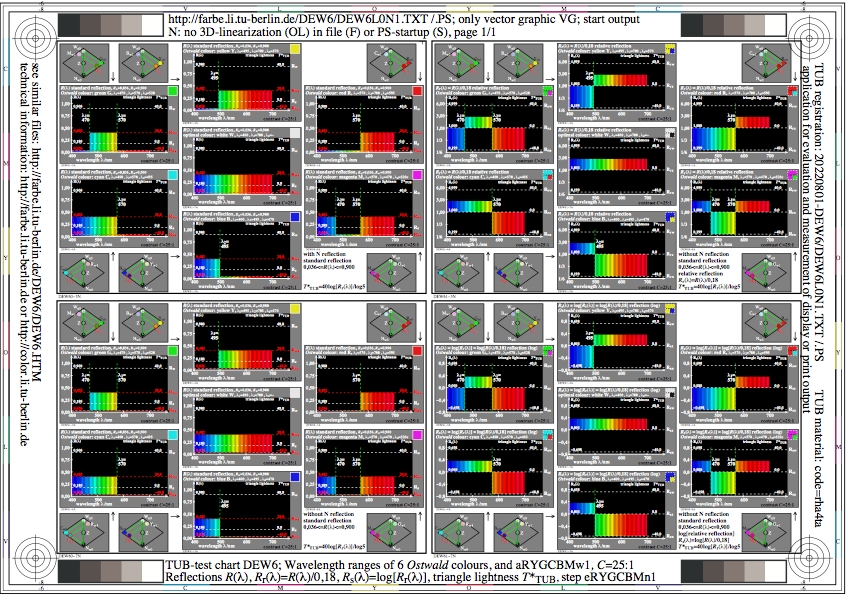
Figure DEW6L0N1.jpg: Output in format A6 of the file
DEW6L0NP.PDF, see
DEW6L0N1.
PS /
TXT /
PDF /
jpg
DEW6: TUB-test chart DEW6; Wavelength ranges of six
Ostwald colours and aRYGCBMw1, contrast C=25:1
Reflections R, Rr=R/0,18, Rs=log(Rr), and T*TUB, eRYGCBMn1
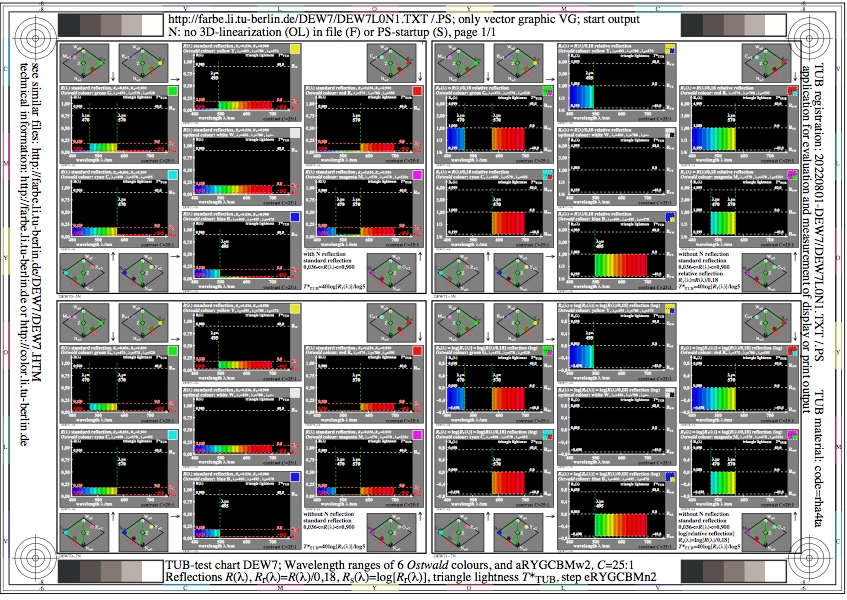
Figure DEW7L0N1.jpg: Output in format A6 of the file
DEW7L0NP.PDF, see
DEW7L0N1.
PS /
TXT /
PDF /
jpg
DEW7: TUB-test chart DEW7; Wavelength ranges of six
Ostwald colours and aRYGCBMw2, contrast C=25:1
Reflections R, Rr=R/0,18, Rs=log(Rr), and T*TUB, eRYGCBMn2
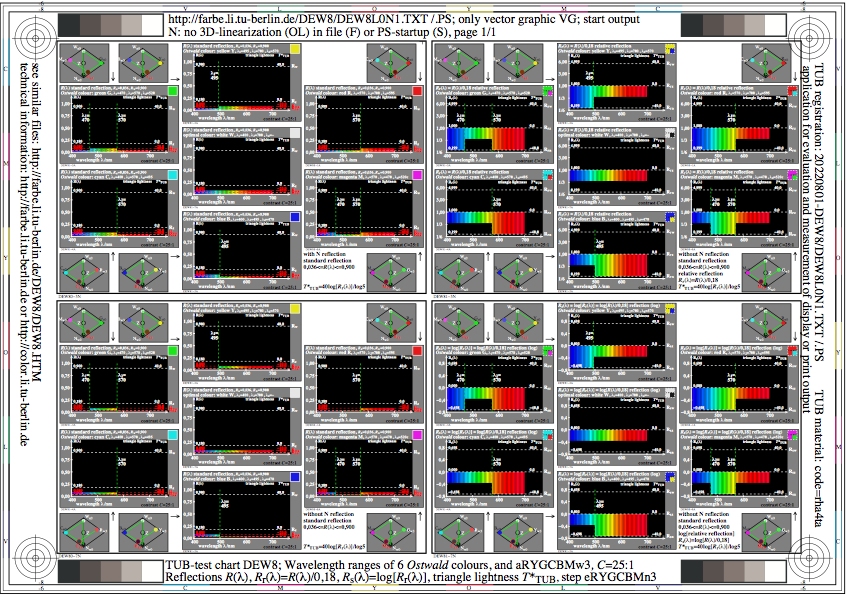
Figure DEW8L0N1.jpg: Output in format A6 of the file
DEW8L0NP.PDF, see
DEW8L0N1.
PS /
TXT /
PDF /
jpg
DEW8: TUB-test chart DEW8; Wavelength ranges of six
Ostwald colours and aRYGCBMw3, contrast C=25:1
Reflections R, Rr=R/0,18, Rs=log(Rr), and T*TUB, eRYGCBMn3
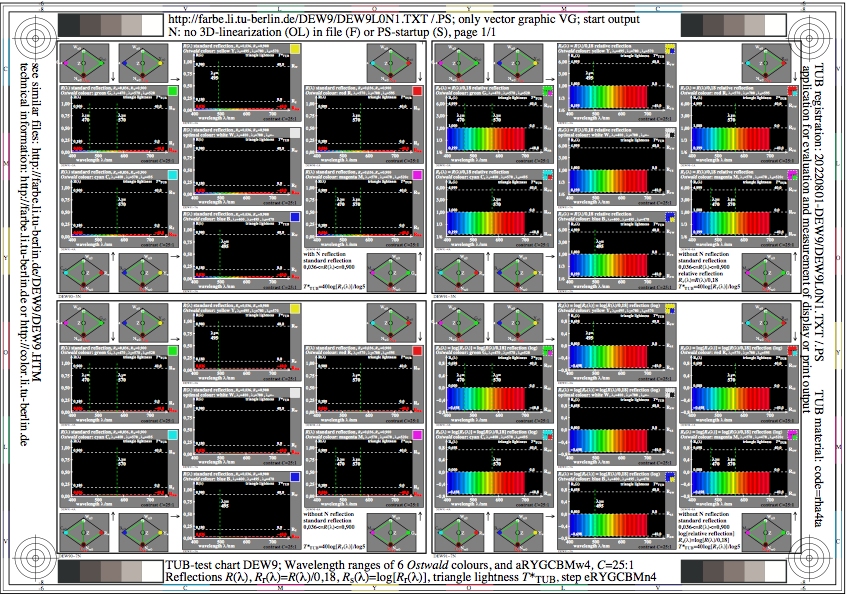
Figure DEW9L0N1.jpg: Output in format A6 of the file
DEW9L0NP.PDF, see
DEW9L0N1.
PS /
TXT /
PDF /
jpg
DEW9: TUB-test chart DEW9; Wavelength ranges of six
Ostwald colours and aRYGCBMw4, contrast C=25:1
Reflections R, Rr=R/0,18, Rs=log(Rr), and T*TUB, eRYGCBMn4
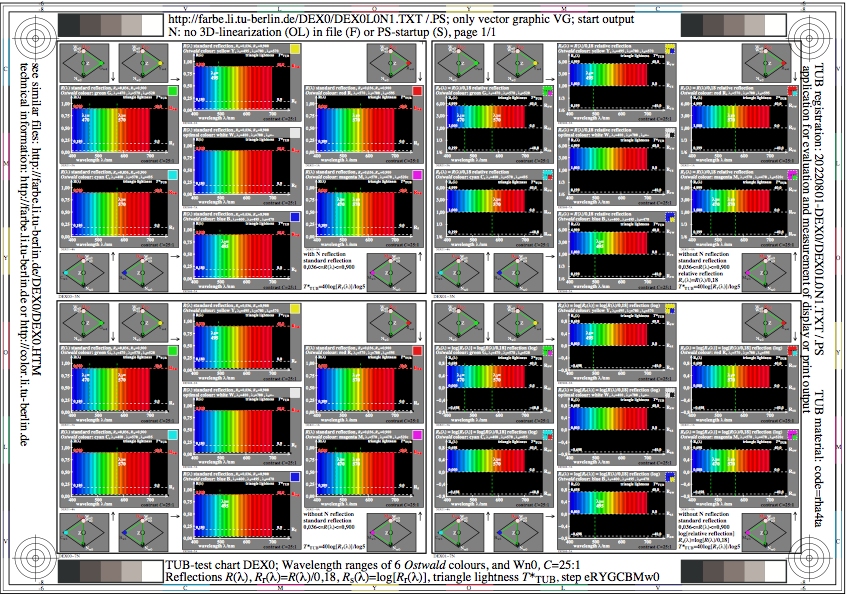
Figure DEX0L0N1.jpg: Output in format A6 of the file
DEX0L0NP.PDF, see
DEX0L0N1.
PS /
TXT /
PDF /
jpg
DEX0: TUB-test chart DEX0; Wavelength ranges of six
Ostwald colours and Wn0, contrast C=25:1
Reflections R, Rr=R/0,18, Rs=log(Rr), and T*TUB, eRYGCBMw0
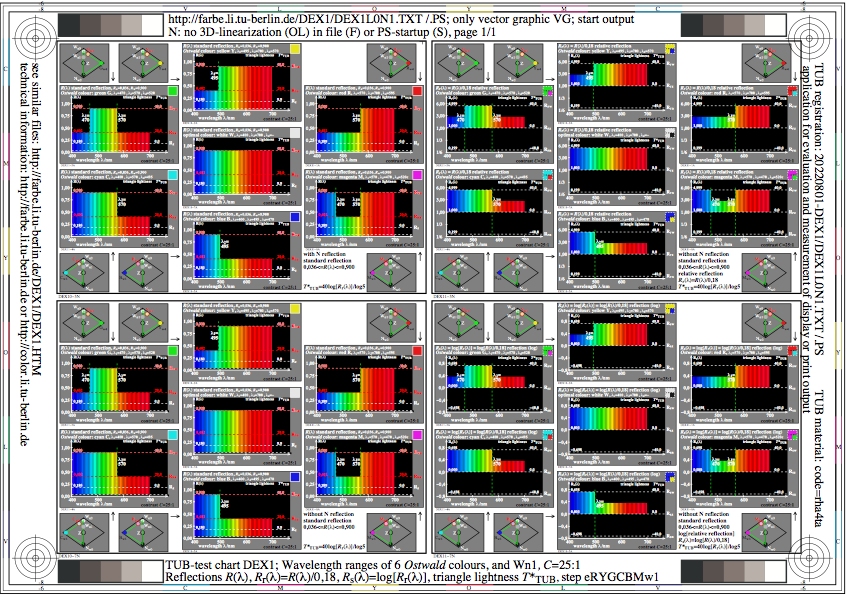
Figure DEX1L0N1.jpg: Output in format A6 of the file
DEX1L0NP.PDF, see
DEX1L0N1.
PS /
TXT /
PDF /
jpg
DEX1: TUB-test chart DEX1; Wavelength ranges of six
Ostwald colours and Wn1, contrast C=25:1
Reflections R, Rr=R/0,18, Rs=log(Rr), and T*TUB, eRYGCBMw1
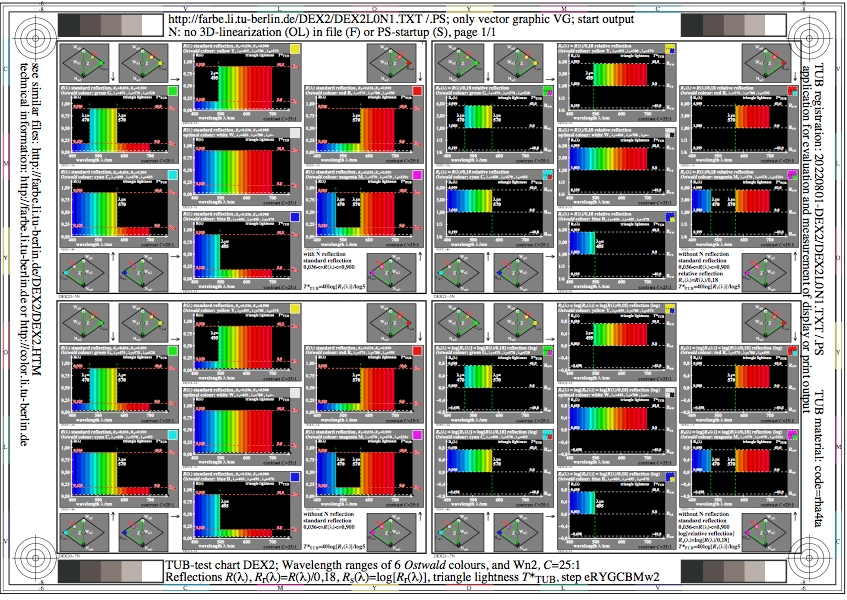
Figure DEX2L0N1.jpg: Output in format A6 of the file
DEX2L0NP.PDF, see
DEX2L0N1.
PS /
TXT /
PDF /
jpg
DEX2: TUB-test chart DEX2; Wavelength ranges of six
Ostwald colours and Wn2, contrast C=25:1
Reflections R, Rr=R/0,18, Rs=log(Rr), and T*TUB, eRYGCBMw2
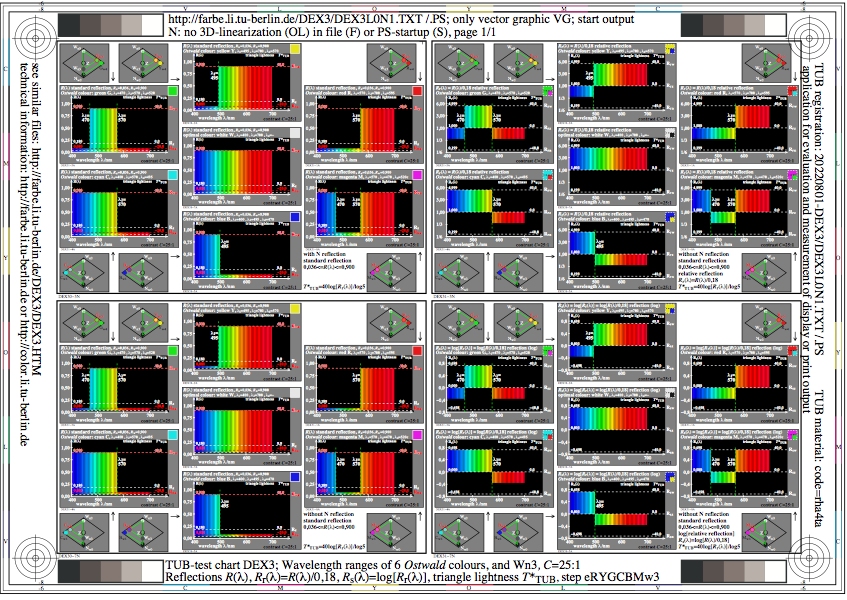
Figure DEX3L0N1.jpg: Output in format A6 of the file
DEX3L0NP.PDF, see
DEX3L0N1.
PS /
TXT /
PDF /
jpg
DEX3: TUB-test chart DEX3; Wavelength ranges of six
Ostwald colours and Wn3, contrast C=25:1
Reflections R, Rr=R/0,18, Rs=log(Rr), and T*TUB, eRYGCBMw3

Figure DEX4L0N1.jpg: Output in format A6 of the file
DEX4L0NP.PDF, see
DEX4L0N1.
PS /
TXT /
PDF /
jpg
DEX4: TUB-test chart DEX4; Wavelength ranges of six
Ostwald colours and Wn4, contrast C=25:1
Reflections R, Rr=R/0,18, Rs=log(Rr), and T*TUB, eRYGCBMw4

Figure DEX5L0N1.jpg: Output in format A6 of the file
DEX5L0NP.PDF, see
DEX5L0N1.
PS /
TXT /
PDF /
jpg
DEX5: TUB-test chart DEX5; Wavelength ranges of six
Ostwald colours and aRYGCBMn0, contrast C=25:1
Reflections R, Rr=R/0,18, Rs=log(Rr), and T*TUB, eRYGCBMw0

Figure DEX6L0N1.jpg: Output in format A6 of the file
DEX6L0NP.PDF, see
DEX6L0N1.
PS /
TXT /
PDF /
jpg
DEX6: TUB-test chart DEX6; Wavelength ranges of six
Ostwald colours and aRYGCBMn1, contrast C=25:1
Reflections R, Rr=R/0,18, Rs=log(Rr), and T*TUB, eRYGCBMw1
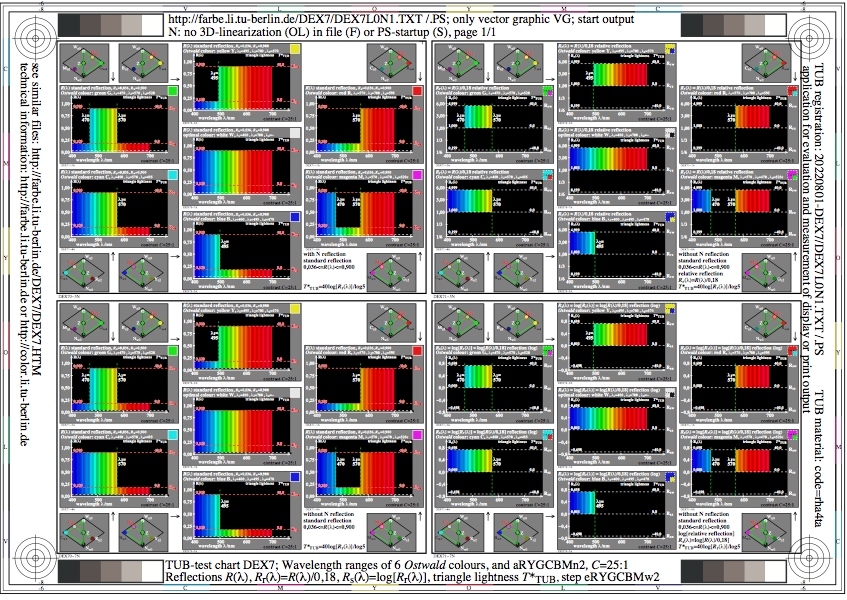
Figure DEX7L0N1.jpg: Output in format A6 of the file
DEX7L0NP.PDF, see
DEX7L0N1.
PS /
TXT /
PDF /
jpg
DEX7: TUB-test chart DEX7; Wavelength ranges of six
Ostwald colours and aRYGCBMn2, contrast C=25:1
Reflections R, Rr=R/0,18, Rs=log(Rr), and T*TUB, eRYGCBMw2
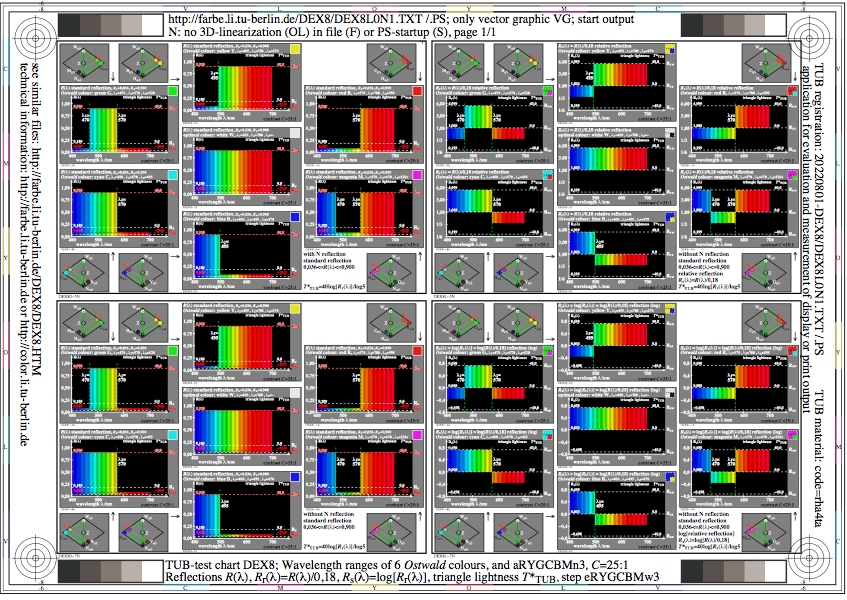
Figure DEX8L0N1.jpg: Output in format A6 of the file
DEX8L0NP.PDF, see
DEX8L0N1.
PS /
TXT /
PDF /
jpg
DEX8: TUB-test chart DEX8; Wavelength ranges of six
Ostwald colours and aRYGCBMn3, contrast C=25:1
Reflections R, Rr=R/0,18, Rs=log(Rr), and T*TUB, eRYGCBMw3
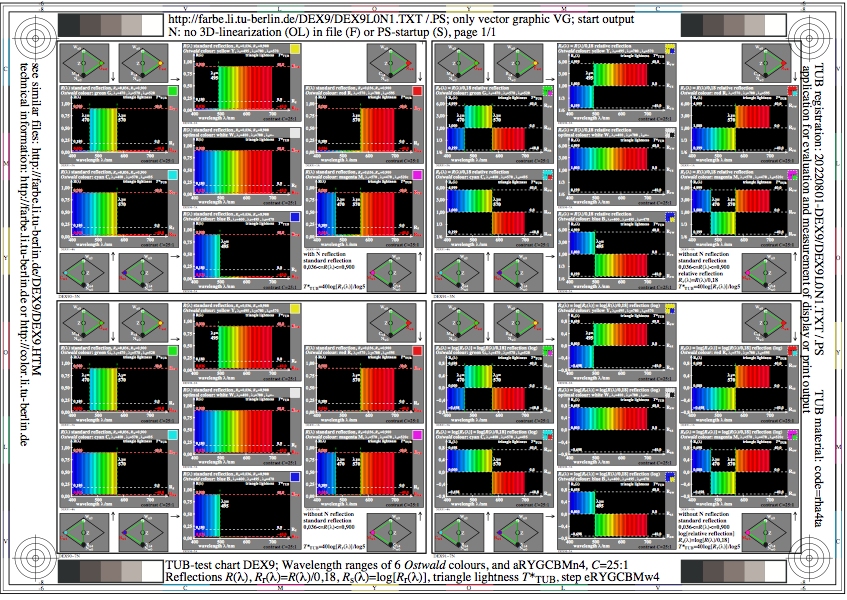
Figure DEX9L0N1.jpg: Output in format A6 of the file
DEX9L0NP.PDF, see
DEX9L0N1.
PS /
TXT /
PDF /
jpg
DEX9: TUB-test chart DEX9; Wavelength ranges of six
Ostwald colours and aRYGCBMn4, contrast C=25:1
Reflections R, Rr=R/0,18, Rs=log(Rr), and T*TUB, eRYGCBMw4
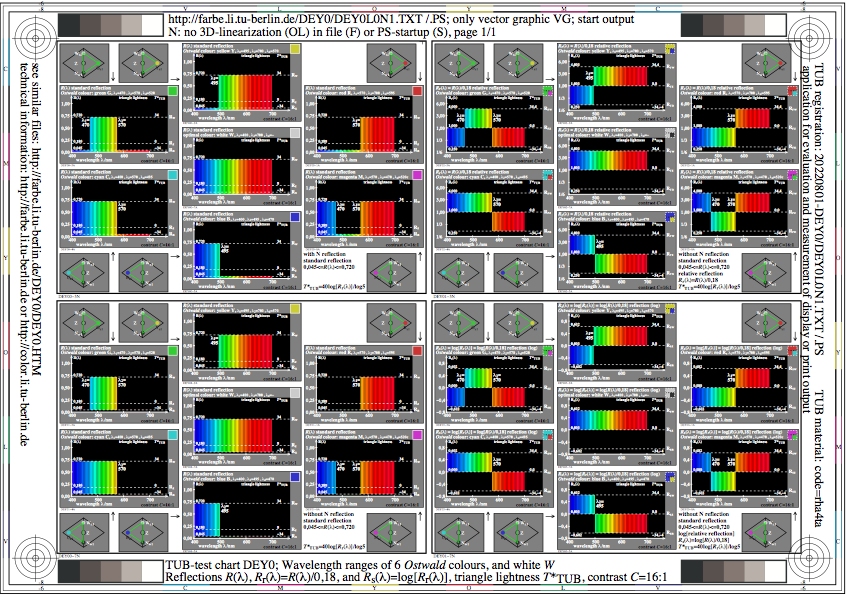
Figure DEY0L0N1.jpg: Output in format A6 of the file
DEY0L0NP.PDF, see
DEY0L0N1.
PS /
TXT /
PDF /
jpg
DEY0: TUB-test chart DEY0; Viewing situations of colous
Just noticeable differences (JNDs) for greys and colours
Achromatic and chromatic relative scaling
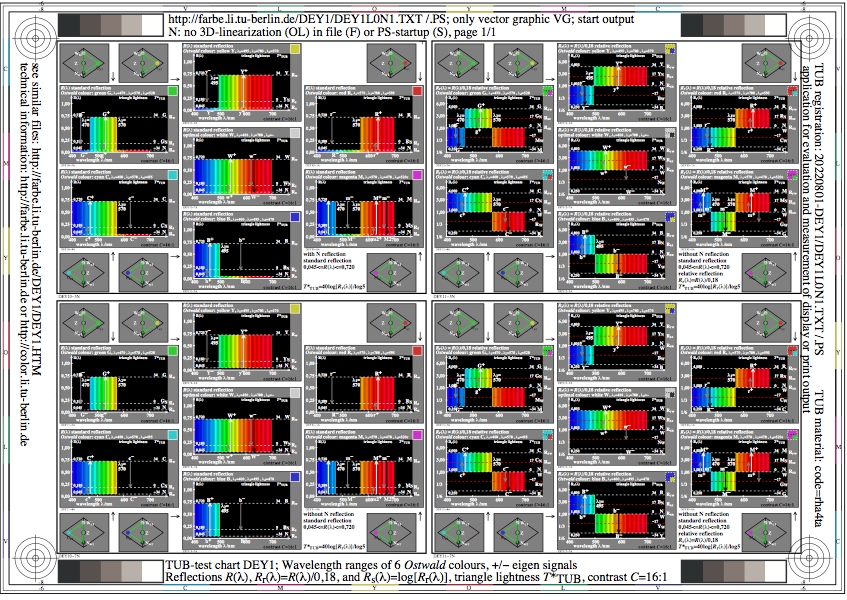
Figure DEY1L0N1.jpg: Output in format A6 of the file
DEY1L0NP.PDF, see
DEY1L0N1.
PS /
TXT /
PDF /
jpg
DEY1: TUB-test chart DEY1; Ostwald-hue circle
colour names, rgb*, XYZxy, L*ABCH_AB2 data as tables
chromaticity diagram with 6 colours RYGCBM, variation GM->G2M2
Figure DEY2L0N1.jpg: Output in format A6 of the file
DEY2L0NP.PDF, see
DEY2L0N1.
PS /
TXT /
PDF /
jpg
DEY2: TUB-test chart DEY1; Antagonistic colour attributes
N* and I*; Antagonistic colour signals
linear and perceived scaling of the hues R-C, Y-B & G-M

Figure DEY3L0N1.jpg: Output in format A6 of the file
DEY3L0NP.PDF, see
DEY3L0N1.
PS /
TXT /
PDF /
jpg
DEY3: TUB-test chart DEY3; Antagonistic colour attributes
W*, T*, C* and A*; Antagonistic colour signals
linear and perceived scaling of the hues R-C, Y-B & G-M
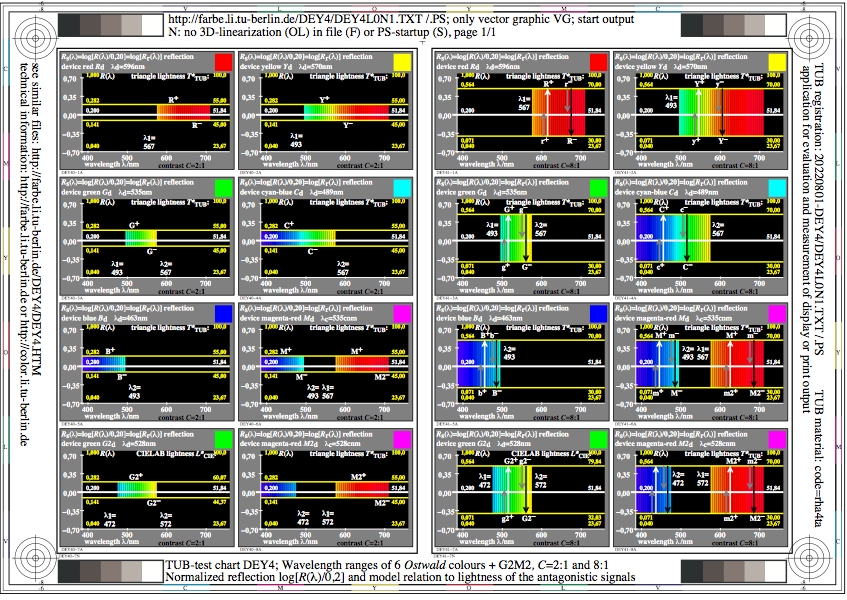
Figure DEY4L0N1.jpg: Output in format A6 of the file
DEY4L0NP.PDF, see
DEY4L0N1.
PS /
TXT /
PDF /
jpg
DEY4: TUB-test chart DEY4; Wavelength ranges of 6 Ostwald
colours + G2M2; Normalized refl;ection log[R(lamda)/0,2]
Model relation to lightness and antagonistic signals
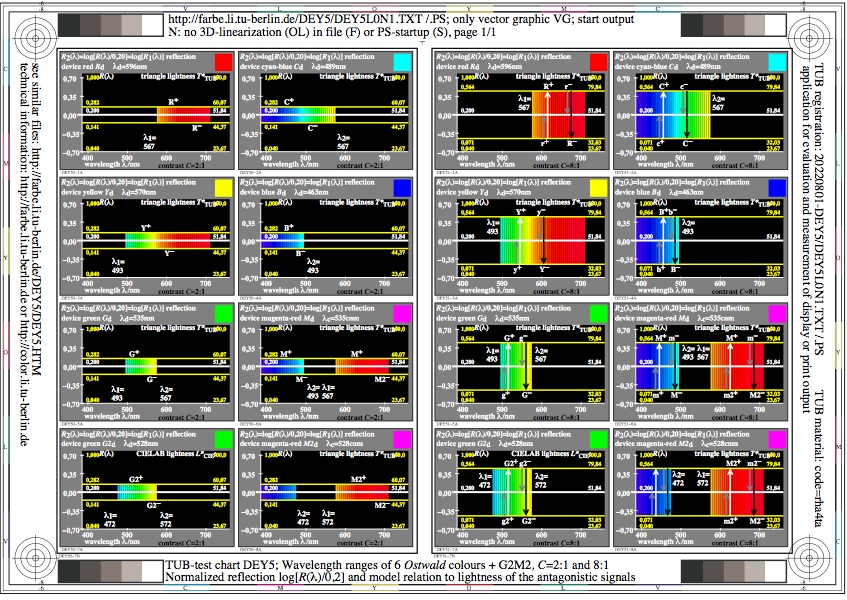
Figure DEY5L0N1.jpg: Output in format A6 of the file
DEY5L0NP.PDF, see
DEY5L0N1.
PS /
TXT /
PDF /
jpg
DEY5: TUB-test chart DEY5; Wavelength ranges of 6 Ostwald
colours + G2M2; Normalized refl;ection log[R(lamda)/0,2]
Model relation to lightness and antagonistic signals

Figure DEY6L0N1.jpg: Output in format A6 of the file
DEY6L0NP.PDF, see
DEY6L0N1.
PS /
TXT /
PDF /
jpg
DEY6: TUB-test chart DEY6; Antagonistic colour vectors
Linear (left) and perceived relative scaling (right)
of hues R-C, Y-B, G-M, and G2-M2
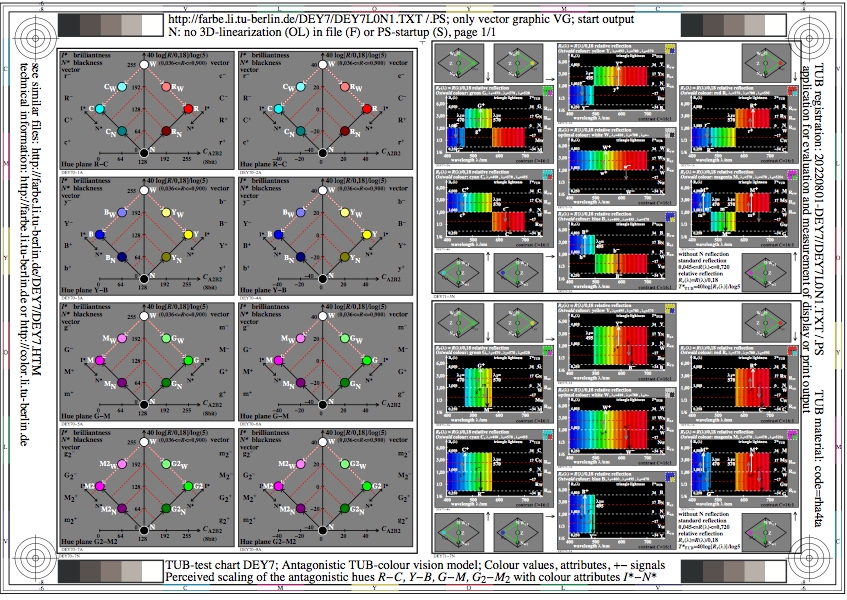
Figure DEY7L0N1.jpg: Output in format A6 of the file
DEY7L0NP.PDF, see
DEY7L0N1.
PS /
TXT /
PDF /
jpg
DEY7: TUB-test chart DEY7; Linear colour values and reflection
Linear relative scaling and scaled reflection
of hues R-C, Y-B, G-M, and G2-M2

Figure DEY8L0N1.jpg: Output in format A6 of the file
DEY8L0NP.PDF, see
DEY8L0N1.
PS /
TXT /
PDF /
jpg
DEY8: TUB-test chart DEY8; Perceived colour values and reflection
Perceived relative scaling and scaled reflection
of hues R-C, Y-B, G-M, and G2-M2
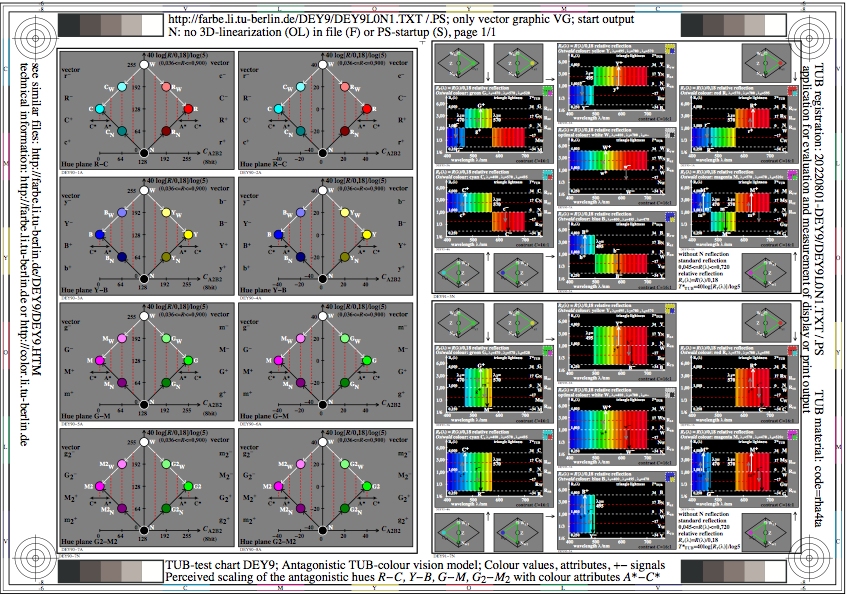
Figure DEY9L0N1.jpg: Output in format A6 of the file
DEY9L0NP.PDF, see
DEY9L0N1.
PS /
TXT /
PDF /
jpg
DEY9: TUB-test chart DEY9; Perceived colour values and reflection
Perceived relative scaling and scaled reflection
of hues R-C, Y-B, G-M, and G2-M2
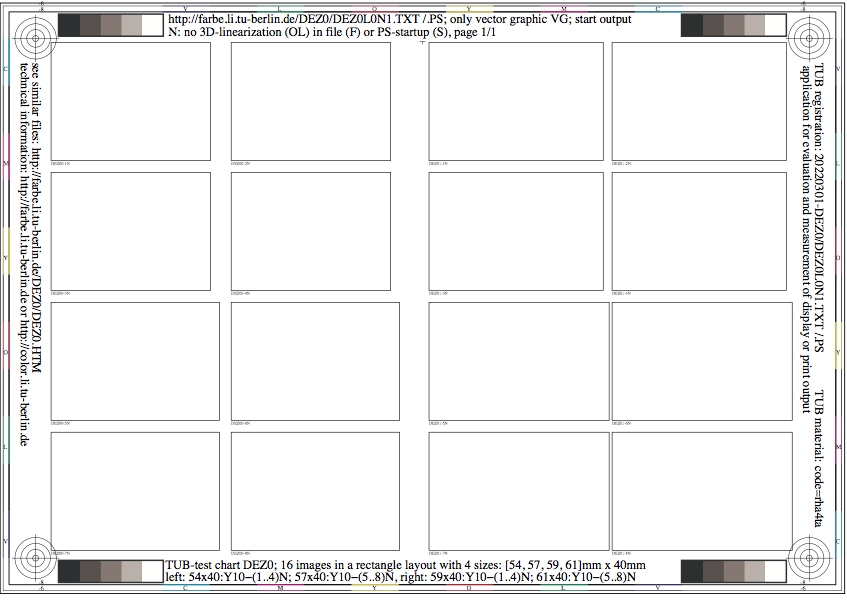
Figure DEZ0L0N1.jpg: Output in format A6 of the file
DEZ0L0NP.PDF, see
DEZ0L0N1.
PS /
TXT /
PDF /
jpg
DEZ0: TUB-test chart DEZ0; Image creation from images
4 x 4 separate images in a rectangular format
The 4 images have four sizes (54, 57, 59, 61)mm x 40mm
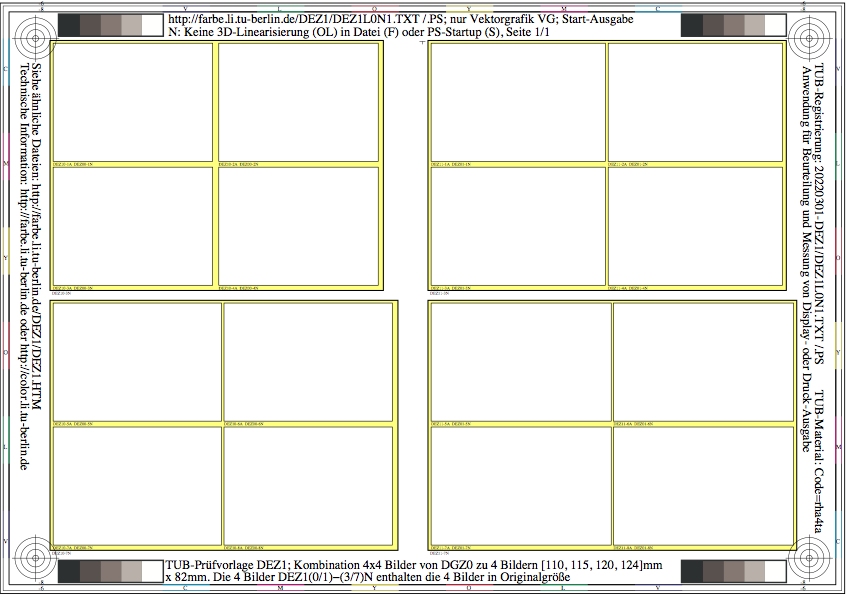
Figure DEZ1L0N1.jpg: Output in format A6 of the file
DEZ1L0NP.PDF, see
DEZ1L0N1.
PS /
TXT /
PDF /
jpg
DEZ1: TUB-test chart DEZ1; Image creation from images
combination 4 x 4 images to 4 rectangular arrangements
The 4 images have four sizes (110, 115, 120, 123)mm x 82mm
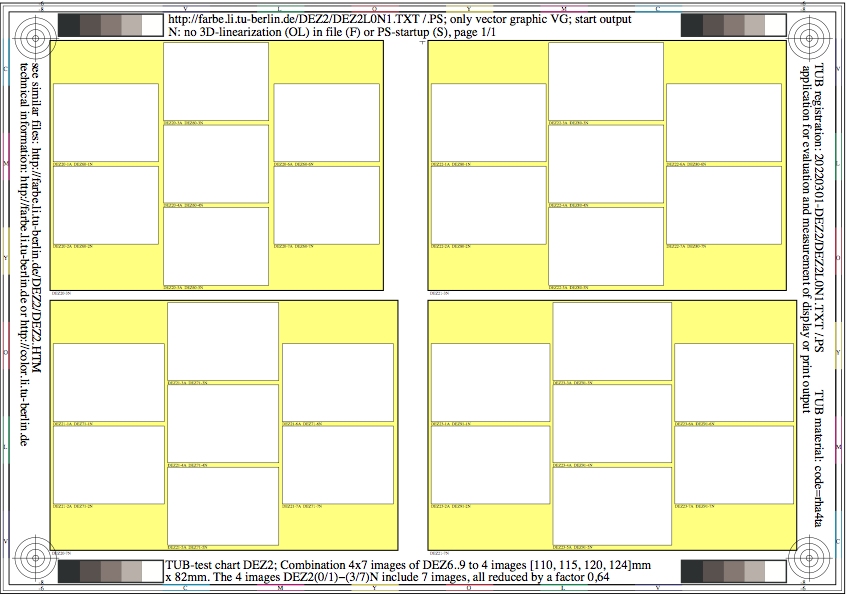
Figure DEZ2L0N1.jpg: Output in format A6 of the file
DEZ2L0NP.PDF, see
DEZ2L0N1.
PS /
TXT /
PDF /
jpg
DEZ2: TUB-test chart DEZ2; Image creation from images
combination of 4 x 7 images to 4 circular arrangements
The images have four sizes (110, 115, 120, 123)mm x 82mm
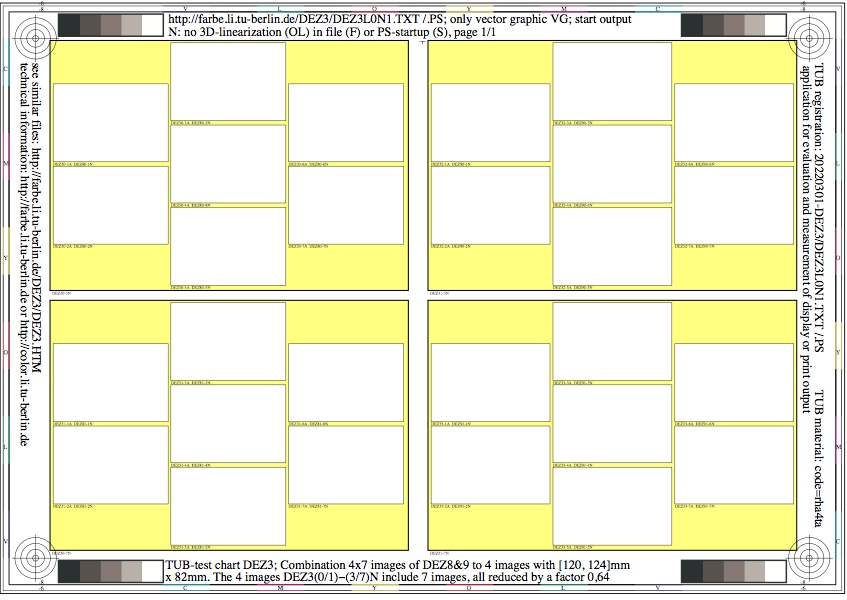
Figure DEZ3L0N1.jpg: Output in format A6 of the file
DEZ3L0NP.PDF, see
DEZ3L0N1.
PS /
TXT /
PDF /
jpg
DEZ3: TUB-test chart DEZ3; Image creation from images
combination of 4 x 7 images to 4 circular arrangements
The 4 images have two sizes (120, 123)mm x 82mm
Figure DEZ4L0N1.jpg: Output in format A6 of the file
DEZ4L0NP.PDF, see
DEZ4L0N1.
PS /
TXT /
PDF /
jpg
DEZ4: TUB-test chart DEZ4; Image creation from images
16 separate images in a rectangular layout without output
all images in the size 54mm x 40mm are NOT visible
Figure DEZ5L0N1.jpg: Output in format A6 of the file
DEZ5L0NP.PDF, see
DEZ5L0N1.
PS /
TXT /
PDF /
jpg
DEZ5: TUB-test chart DEZ5; Image creation from images
16 separate images in a rectangular layout without output
all images in the size 61mm x 40mm are NOT visible

Figure DEZ6L0N1.jpg: Output in format A6 of the file
DEZ6L0NP.PDF, see
DEZ6L0N1.
PS /
TXT /
PDF /
jpg
DEZ6: TUB-test chart DEZ6; Image creation from images
16 separate images in a rectangular layout
all images of the size 54mm x 40mm are visible
Figure DEZ7L0N1.jpg: Output in format A6 of the file
DEZ7L0NP.PDF, see
DEZ7L0N1.
PS /
TXT /
PDF /
jpg
DEZ7: TUB-test chart DEZ7; Image creation from images
16 separate images in a rectangular layout
all images of the size 57mm x 40mm are visible

Figure DEZ8L0N1.jpg: Output in format A6 of the file
DEZ8L0NP.PDF, see
DEZ8L0N1.
PS /
TXT /
PDF /
jpg
DEZ8: TUB-test chart DEZ8; Image creation from images
16 separate images in a rectangular layout
all images of the size 59mm x 40mm are visible
Figure DEZ9L0N1.jpg: Output in format A6 of the file
DEZ9L0NP.PDF, see
DEZ9L0N1.
PS /
TXT /
PDF /
jpg
DEZ9: TUB-test chart DEZ9; Image creation from images
16 separate images in a rectangular layout
all images of the size 61mm x 40mm are visible
Section 2, Chapter D:
Colour Appearance, Elementary Colours, and Metrics (2022)
This image page with 260 image series:
de2s in English,
dg2s in German.
Previous image page:
ce2s in English,
cg2s in German.
Next image page, see
ee2s in English,
eg2s in German.
Introduction, content list and summary:
DEAI,
DEA_I,
DEA_S in English or
DGAI,
DGA_I,
DGA_S in German.
-------
For the archive information (2000-2009) of the BAM server "www.ps.bam.de"
(2000-2018)
about colour test charts, colorimetric calculations,
standards, and publications, see
indexAE.html in English,
indexAG.html in German.
Back to the main page of this TUB web site (NOT archive), see
index.html in English,
indexDE.html in German.