Figure CEA0L0N1.jpg: Output in format A6 of the file CEA0L0NP.PDF, see
CEA0L0N1. PS / TXT / PDF / jpg
Section 2, Chapter C:
Colour Spaces, Colour Differences, and Line Elements (2021)
This image page with 260 image series:
ce2s in English,
cg2s in German.
Previous image page:
be2s in English,
bg2s in German.
Next image page, see
de2s in English,
dg2s in German.
Introduction, content list and summary:
CEAI,
CEA_I,
CEA_S in English or
CGAI,
CGA_I,
CGA_S in German.
Section 2: Colourimetry, Colour Vision and Applications for Colour Image Technology (2019-2024), Image part ce2s
Chapter C:: Colour Spaces, Colour Differences and Line Elements (2021)
The following 260 image series between cea0 and cez9
show the content with links to the single figures
in up to six formats.
Figure CEA0L0N1.jpg: Output in format A6 of the file
CEA0L0NP.PDF, see
CEA0L0N1.
PS /
TXT /
PDF /
jpg
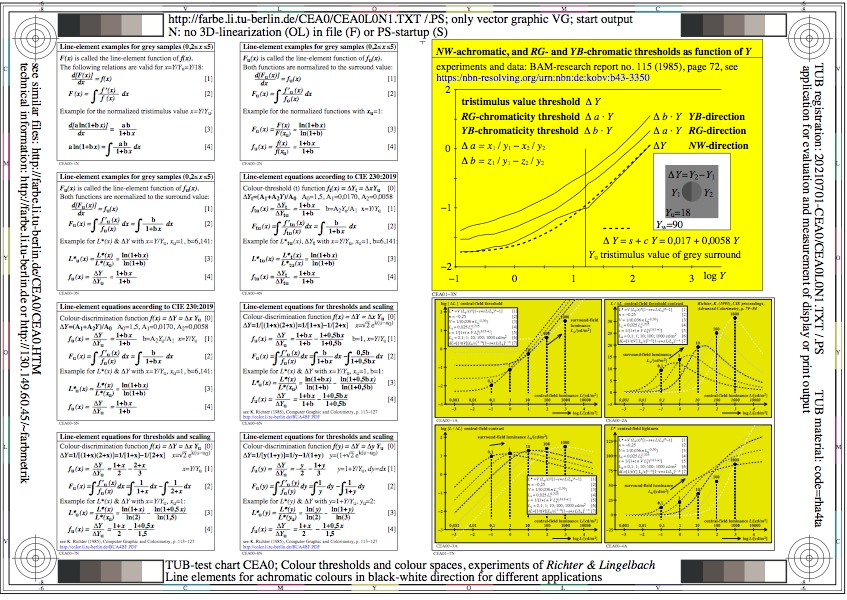
CEA0: TUB-test chart CEA0; Colour threholds and colour spaces
Line elements of achromatic colours in black-
white direction for different applications
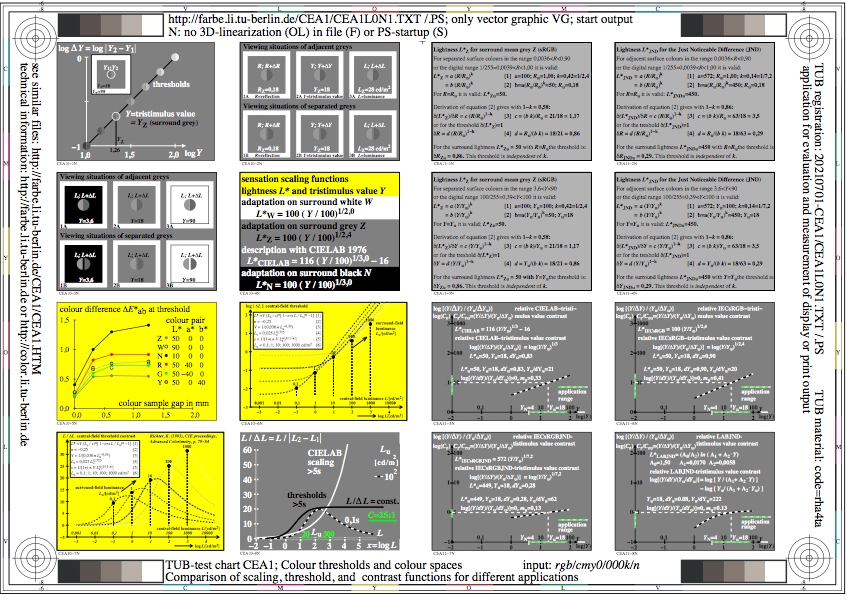
Figure CEA1L0N1.jpg: Output in format A6 of the file
CEA1L0NP.PDF, see
CEA1L0N1.
PS /
TXT /
PDF /
jpg
CEA1: TUB-test chart CEA1; Colour threholds and colour spaces
Comparison of scaling, thresholds, and
contrast functions for different applications
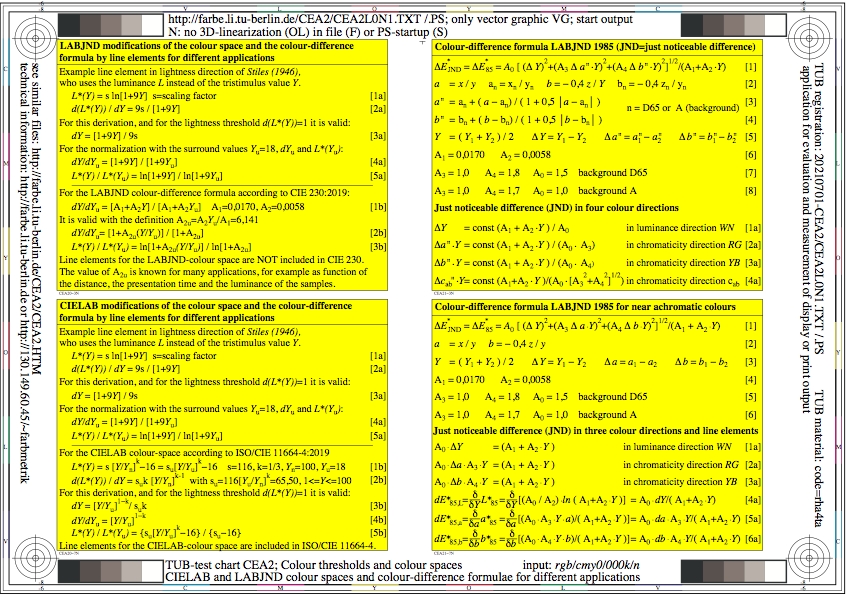
Figure CEA2L0N1.jpg: Output in format A6 of the file
CEA2L0NP.PDF, see
CEA2L0N1.
PS /
TXT /
PDF /
jpg
CEA2: TUB-test chart CEA2; Colour threholds and colour spaces
CIELAB and LABJND colour spaces, and colour differences
for different applications
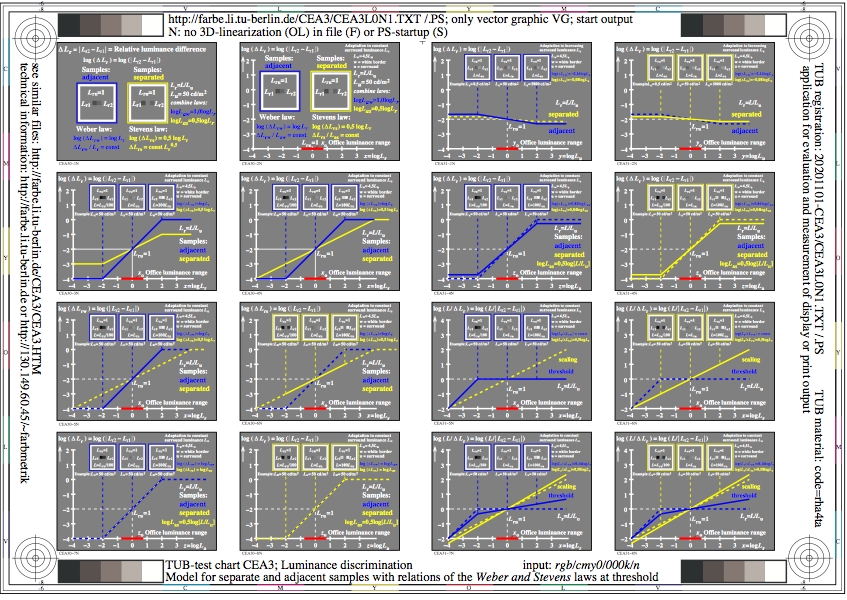
Figure CEA3L0N1.jpg: Output in format A6 of the file
CEA3L0NP.PDF, see
CEA3L0N1.
PS /
TXT /
PDF /
jpg
CEA3: TUB-test chart CEA3; Luminance discrimination
Model for achromatic adjacent samples
Relation of Weber-Fechner and Stevens law
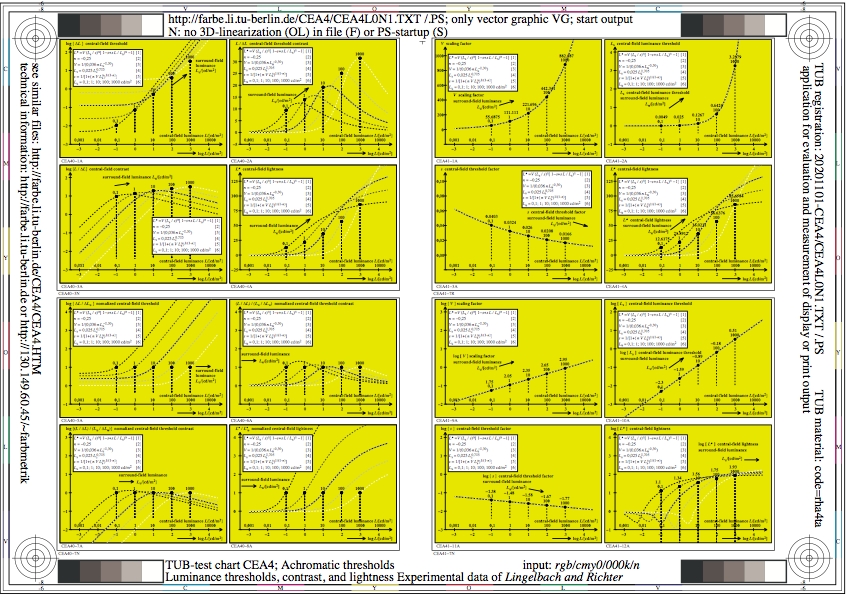
Figure CEA4L0N1.jpg: Output in format A6 of the file
CEA4L0NP.PDF, see
CEA4L0N1.
PS /
TXT /
PDF /
jpg
CEA4: TUB-test chart CEA4; Achromatic thresholds
Luminance thresholds, contrast, and lightness
Experimental data of Lingelbach and Richter
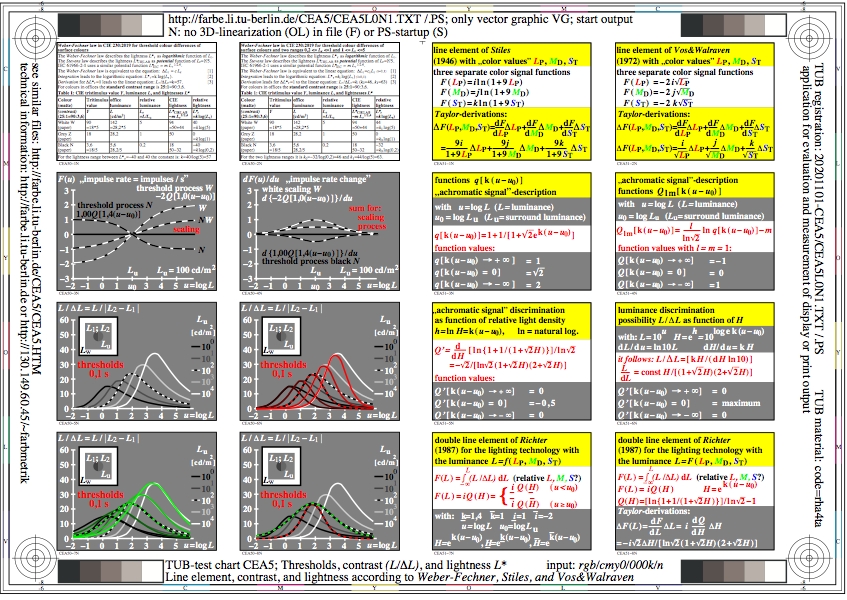
Figure CEA5L0N1.jpg: Output in format A6 of the file
CEA5L0NP.PDF, see
CEA5L0N1.
PS /
TXT /
PDF /
jpg
CEA5: TUB-test chart CEA5; Threshold, contrast, and lightness
Lineelements, contrast, and lightness
of Weber-Fechner, Stiles, and Vos&Walraven
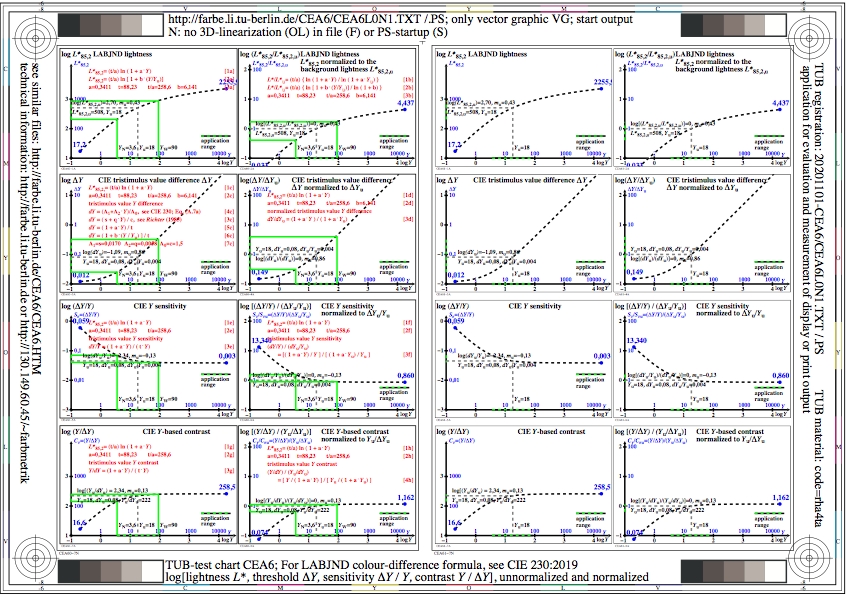
Figure CEA6L0N1.jpg: Output in format A6 of the file
CEA6L0NP.PDF, see
CEA6L0N1.
PS /
TXT /
PDF /
jpg
CEA6: TUB-test chart CEA6; LABJND-line elements of CIE 230:2019
log[lightness L*, threshold delta Y
sensitivity (delta Y)/Y and contrast Y/(delta Y)]
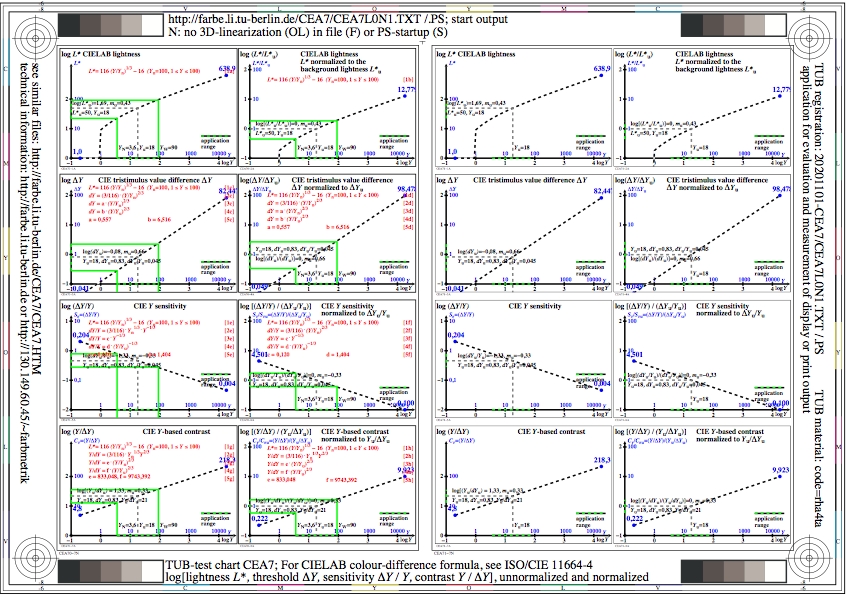
Figure CEA7L0N1.jpg: Output in format A6 of the file
CEA7L0NP.PDF, see
CEA7L0N1.
PS /
TXT /
PDF /
jpg
CEA7: TUB-test chart CEA7; CIELAB-line elements of ISO/CIE 11664-4
log[lightness L*, threshold delta Y
sensitivity (delta Y)/Y and contrast Y/(delta Y)]
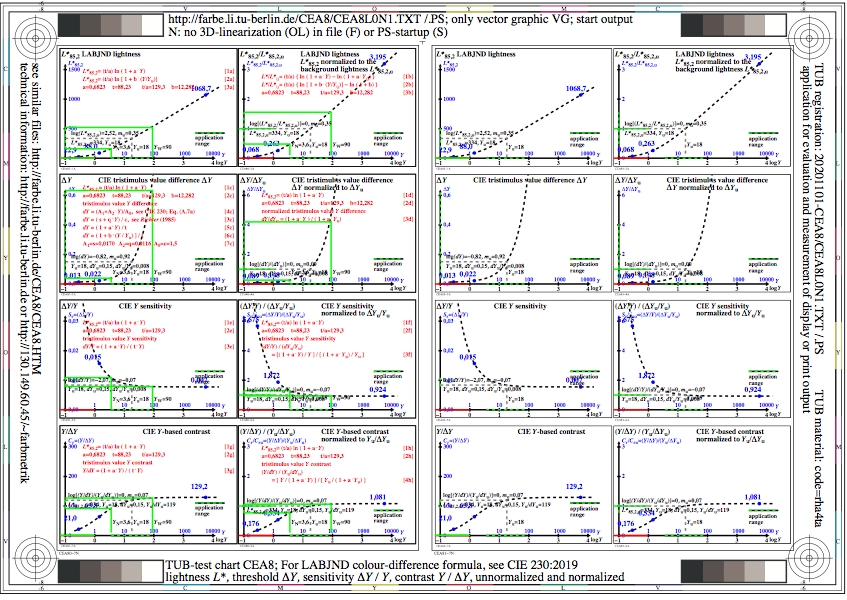
Figure CEA8L0N1.jpg: Output in format A6 of the file
CEA8L0NP.PDF, see
CEA8L0N1.
PS /
TXT /
PDF /
jpg
CEA8: TUB-test chart CEA8; LABJND-line elements of CIE 230:2019
Lightness L*, threshold delta Y
sensitivity (delta Y)/Y and contrast Y/(delta Y)
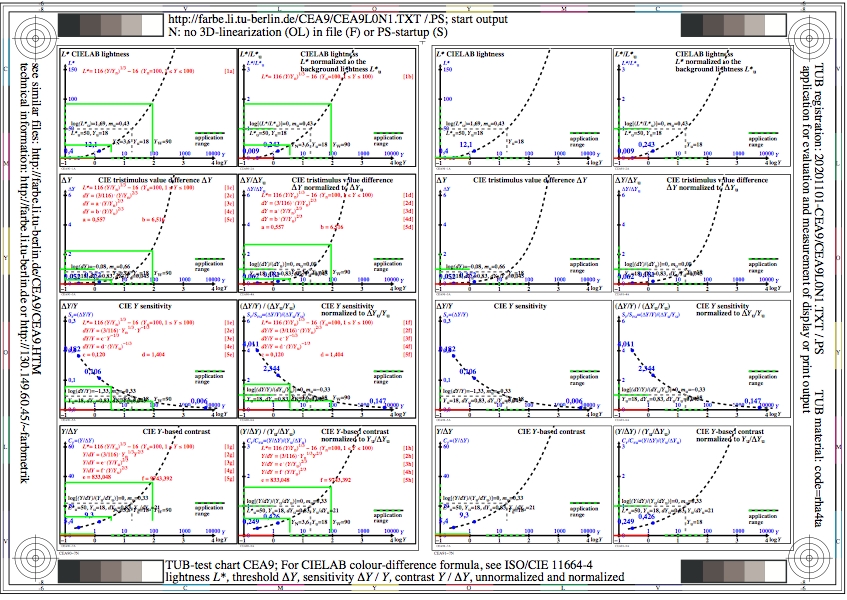
Figure CEA9L0N1.jpg: Output in format A6 of the file
CEA9L0NP.PDF, see
CEA9L0N1.
PS /
TXT /
PDF /
jpg
CEA9: TUB-test chart CEA9; CIELAB-line elements of ISO/CIE 11664-4
Lightness L*, threshold delta Y
sensitivity (delta Y)/Y and contrast Y/(delta Y)

Figure CEB0L0N1.jpg: Output in format A6 of the file
CEB0L0NP.PDF, see
CEB0L0N1.
PS /
TXT /
PDF /
jpg
CEB0: TUB-test chart CEB0; LABJNDu0 formulae similar to CIE 230
LABJND lightness, A0n=1,50, A1n, A2n, cx=1,00 & data
absolute and relative lightness, sensitivity and contrast
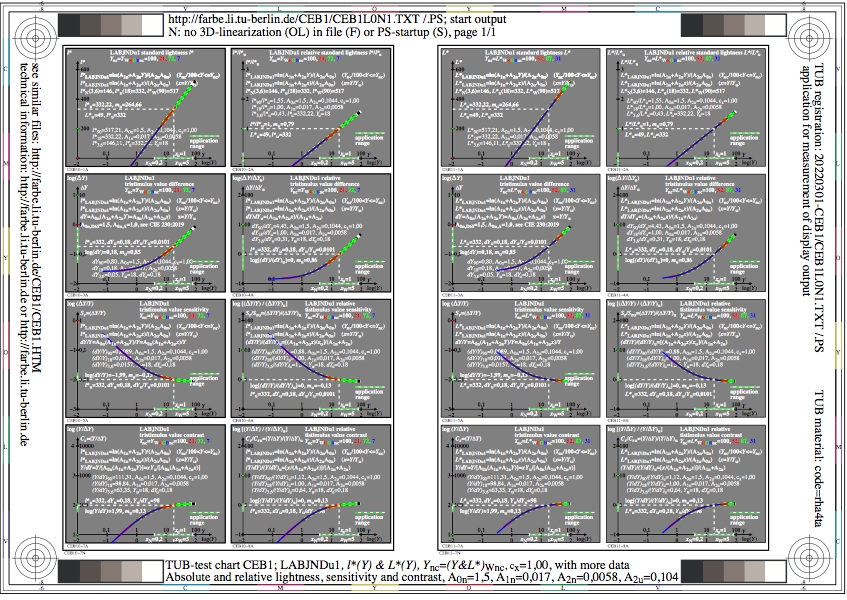
Figure CEB1L0N1.jpg: Output in format A6 of the file
CEB1L0NP.PDF, see
CEB1L0N1.
PS /
TXT /
PDF /
jpg
CEB1: TUB-test chart CEB1; LABJNDu1 formulae similar to CIE 230
LABJND lightness, A0n=1,50, A1n, A2n, cx=1,00 & data
absolute and relative lightness, sensitivity and contrast
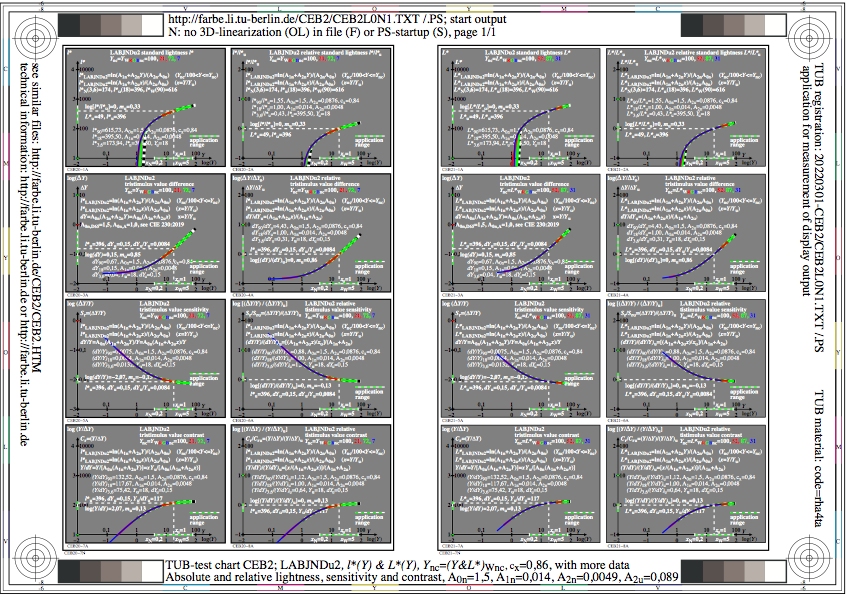
Figure CEB2L0N1.jpg: Output in format A6 of the file
CEB2L0NP.PDF, see
CEB2L0N1.
PS /
TXT /
PDF /
jpg
CEB2: TUB-test chart CEB2; LABJNDu2 formulae similar to CIE 230
LABJND lightness, A0n=1,50, A1n, A2n, cx=0,84 & data
absolute and relative lightness, sensitivity and contrast

Figure CEB3L0N1.jpg: Output in format A6 of the file
CEB3L0NP.PDF, see
CEB3L0N1.
PS /
TXT /
PDF /
jpg
CEB3: TUB-test chart CEB3; LABJNDu3 formulae similar to CIE 230
LABJND lightness, A0n=1,50, A1n, A2n, cx=0,67 & data
absolute and relative lightness, sensitivity and contrast
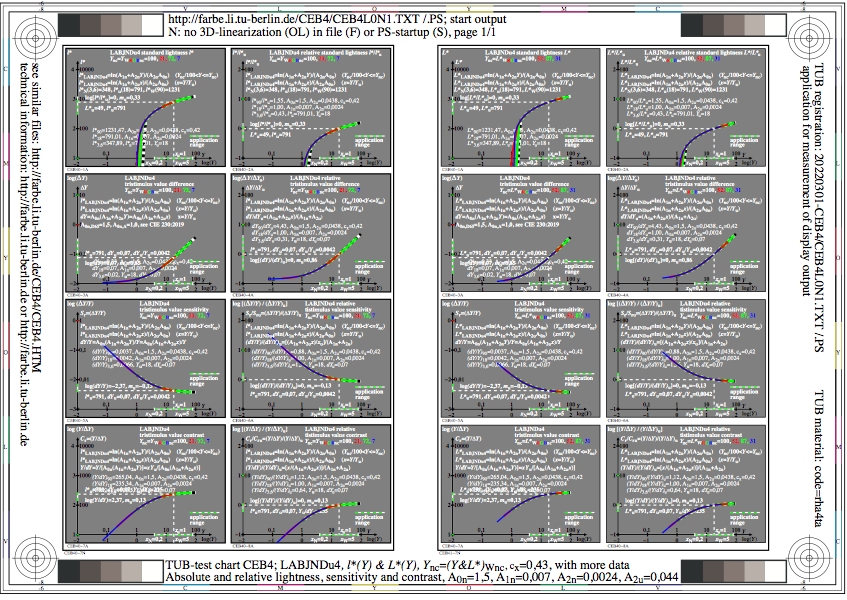
Figure CEB4L0N1.jpg: Output in format A6 of the file
CEB4L0NP.PDF, see
CEB4L0N1.
PS /
TXT /
PDF /
jpg
CEB4: TUB-test chart CEB4; LABJNDu4 formulae similar to CIE 230
LABJND lightness, A0n=1,50, A1n, A2n, cx=0,42 & data
absolute and relative lightness, sensitivity and contrast
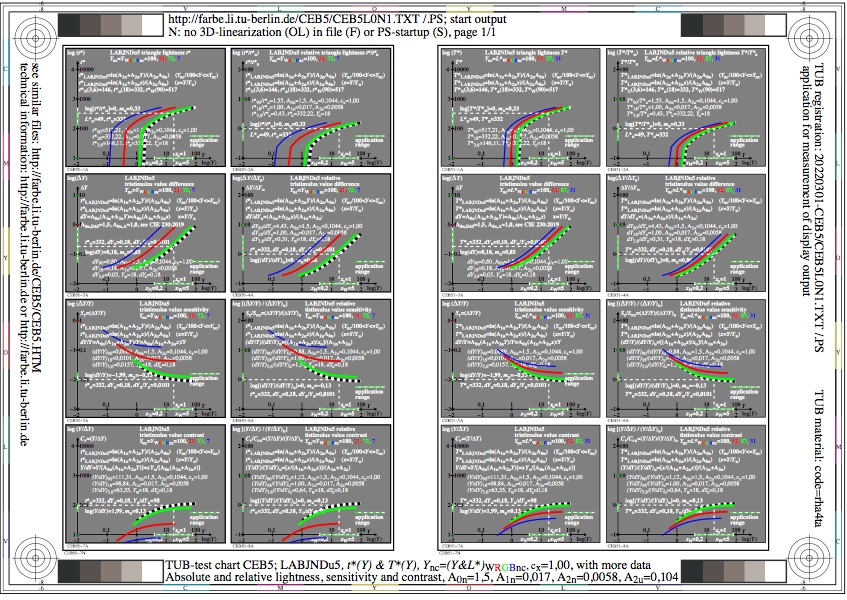
Figure CEB5L0N1.jpg: Output in format A6 of the file
CEB5L0NP.PDF, see
CEB5L0N1.
PS /
TXT /
PDF /
jpg
CEB5: TUB-test chart CEB5; LABJNDu5 formulae similar to CIE 230
LABJND lightness, A0n=1,50, A1n, A2n, cx=1,00 & data
absolute and relative lightness, sensitivity and contrast
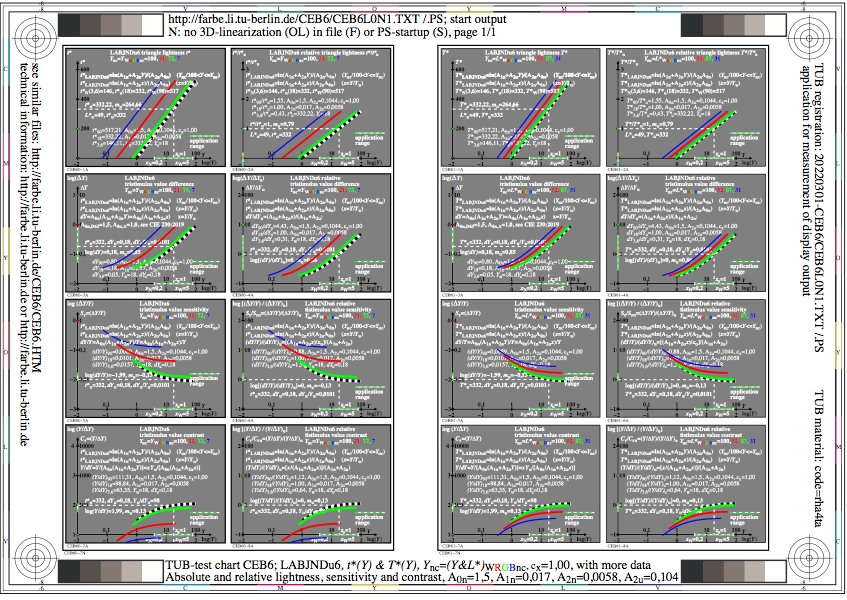
Figure CEB6L0N1.jpg: Output in format A6 of the file
CEB6L0NP.PDF, see
CEB6L0N1.
PS /
TXT /
PDF /
jpg
CEB6: TUB-test chart CEB6; LABJNDu6 formulae similar to CIE 230
LABJND lightness, A0n=1,50, A1n, A2n, cx=1,00 & data
absolute and relative lightness, sensitivity and contrast

Figure CEB7L0N1.jpg: Output in format A6 of the file
CEB7L0NP.PDF, see
CEB7L0N1.
PS /
TXT /
PDF /
jpg
CEB7: TUB-test chart CEB7; LABJNDu7 formulae similar to CIE 230
LABJND lightness, A0n=1,50, A1n, A2n, cx=0,84 & data
absolute and relative lightness, sensitivity and contrast

Figure CEB8L0N1.jpg: Output in format A6 of the file
CEB8L0NP.PDF, see
CEB8L0N1.
PS /
TXT /
PDF /
jpg
CEB8: TUB-test chart CEB8; LABJNDu8 formulae similar to CIE 230
LABJND lightness, A0n=1,50, A1n, A2n, cx=0,67 & data
absolute and relative lightness, sensitivity and contrast
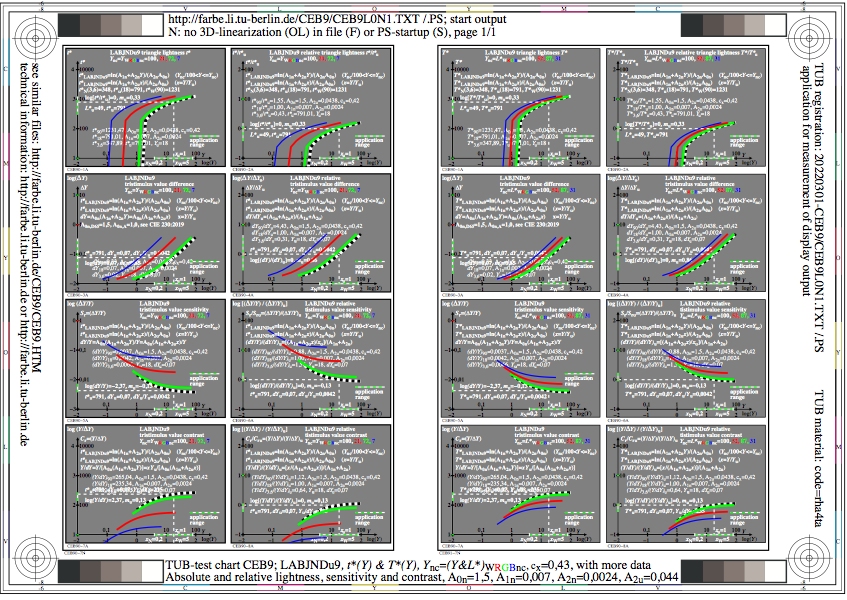
Figure CEB9L0N1.jpg: Output in format A6 of the file
CEB9L0NP.PDF, see
CEB9L0N1.
PS /
TXT /
PDF /
jpg
CEB9: TUB-test chart CEB9; LABJNDu9 formulae similar to CIE 230
LABJND lightness, A0n=1,50, A1n, A2n, cx=0,42 & data
absolute and relative lightness, sensitivity and contrast
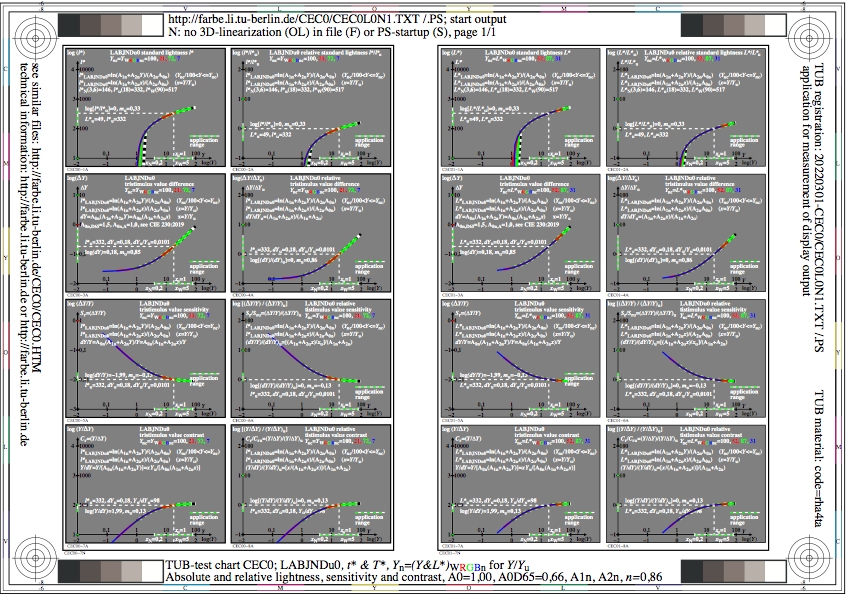
Figure CEC0L0N1.jpg: Output in format A6 of the file
CEC0L0NP.PDF, see
CEC0L0N1.
PS /
TXT /
PDF /
jpg
CEC0: TUB-test chart CEC0; LABJNDu0 formulae similar to CIE 230
LABJND lightness, A0n=1,50, A1n, A2n, cx=1,00
absolute and relative lightness, sensitivity and contrast
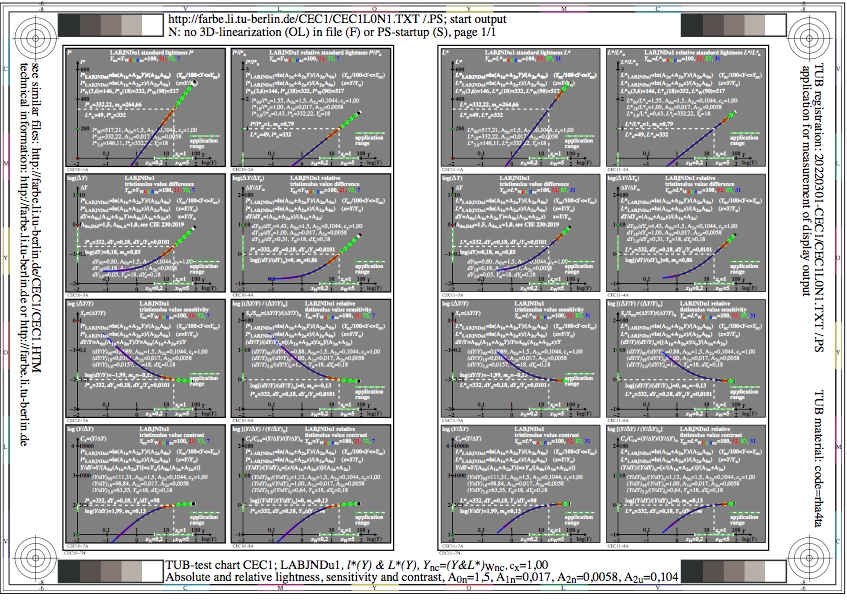
Figure CEC1L0N1.jpg: Output in format A6 of the file
CEC1L0NP.PDF, see
CEC1L0N1.
PS /
TXT /
PDF /
jpg
CEC1: TUB-test chart CEC1; LABJNDu1 formulae similar to CIE 230
LABJND lightness, A0n=1,50, A1n, A2n, cx=1,00
absolute and relative lightness, sensitivity and contrast

Figure CEC2L0N1.jpg: Output in format A6 of the file
CEC2L0NP.PDF, see
CEC2L0N1.
PS /
TXT /
PDF /
jpg
CEC2: TUB-test chart CEC2; LABJNDu2 formulae similar to CIE 230
LABJND lightness, A0n=1,50, A1n, A2n, cx=0,84
absolute and relative lightness, sensitivity and contrast

Figure CEC3L0N1.jpg: Output in format A6 of the file
CEC3L0NP.PDF, see
CEC3L0N1.
PS /
TXT /
PDF /
jpg
CEC3: TUB-test chart CEC3; LABJNDu3 formulae similar to CIE 230
LABJND lightness, A0n=1,50, A1n, A2n, cx=0,67
absolute and relative lightness, sensitivity and contrast
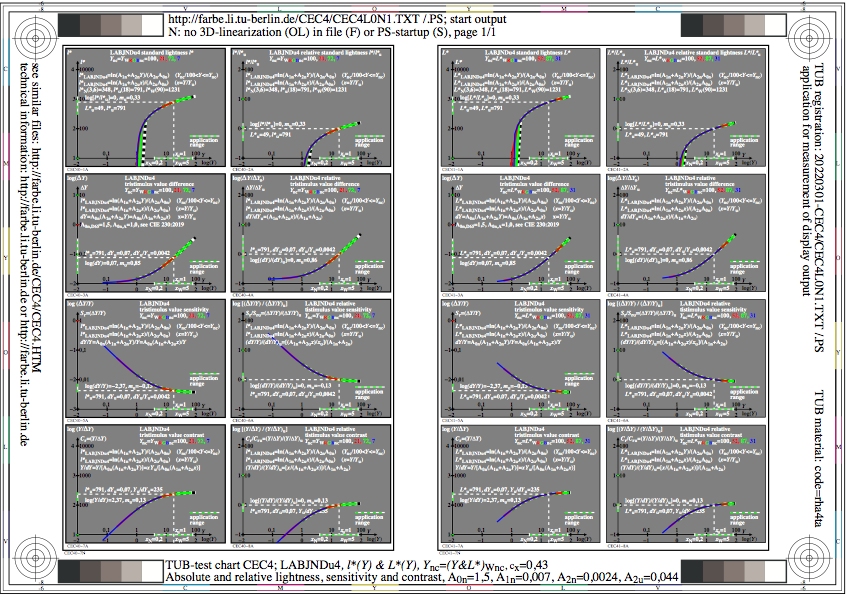
Figure CEC4L0N1.jpg: Output in format A6 of the file
CEC4L0NP.PDF, see
CEC4L0N1.
PS /
TXT /
PDF /
jpg
CEC4: TUB-test chart CEC4; LABJNDu4 formulae similar to CIE 230
LABJND lightness, A0n=1,50, A1n, A2n, cx=0,43
absolute and relative lightness, sensitivity and contrast

Figure CEC5L0N1.jpg: Output in format A6 of the file
CEC5L0NP.PDF, see
CEC5L0N1.
PS /
TXT /
PDF /
jpg
CEC5: TUB-test chart CEC5; LABJNDu5 formulae similar to CIE 230
LABJND lightness, A0n=1,50, A1n, A2n, cx=1,00
absolute and relative lightness, sensitivity and contrast

Figure CEC6L0N1.jpg: Output in format A6 of the file
CEC6L0NP.PDF, see
CEC6L0N1.
PS /
TXT /
PDF /
jpg
CEC6: TUB-test chart CEC6; LABJNDu6 formulae similar to CIE 230
LABJND lightness, A0n=1,50, A1n, A2n, cx=1,00
absolute and relative lightness, sensitivity and contrast
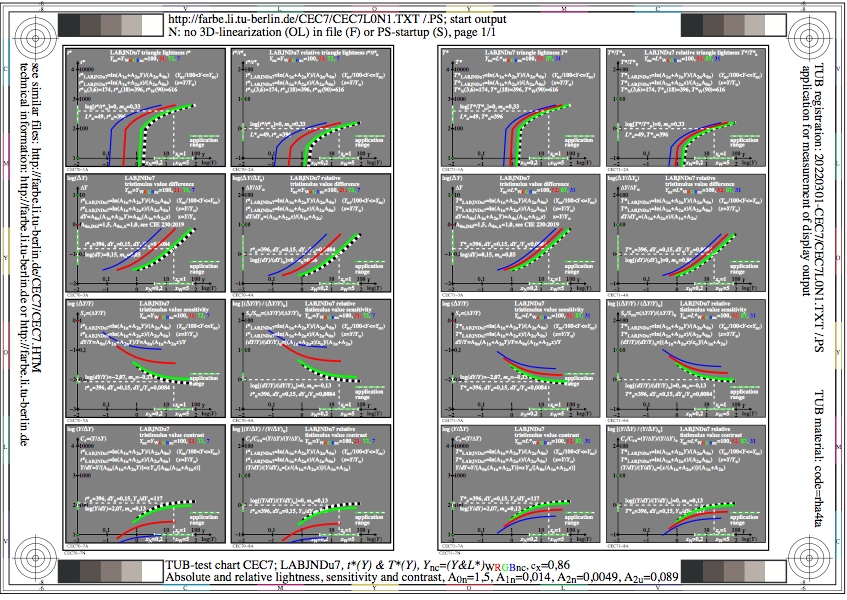
Figure CEC7L0N1.jpg: Output in format A6 of the file
CEC7L0NP.PDF, see
CEC7L0N1.
PS /
TXT /
PDF /
jpg
CEC7: TUB-test chart CEC7; LABJNDu7 formulae similar to CIE 230
LABJND lightness, A0n=1,50, A1n, A2n, cx=0,84
absolute and relative lightness, sensitivity and contrast
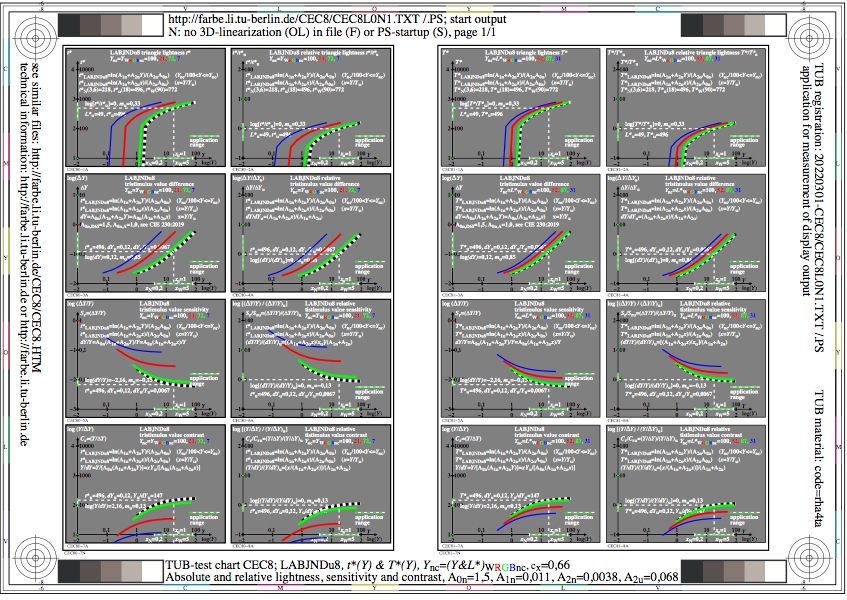
Figure CEC8L0N1.jpg: Output in format A6 of the file
CEC8L0NP.PDF, see
CEC8L0N1.
PS /
TXT /
PDF /
jpg
CEC8: TUB-test chart CEC8; LABJNDu8 formulae similar to CIE 230
LABJND lightness, A0n=1,50, A1n, A2n, cx=0,67
absolute and relative lightness, sensitivity and contrast
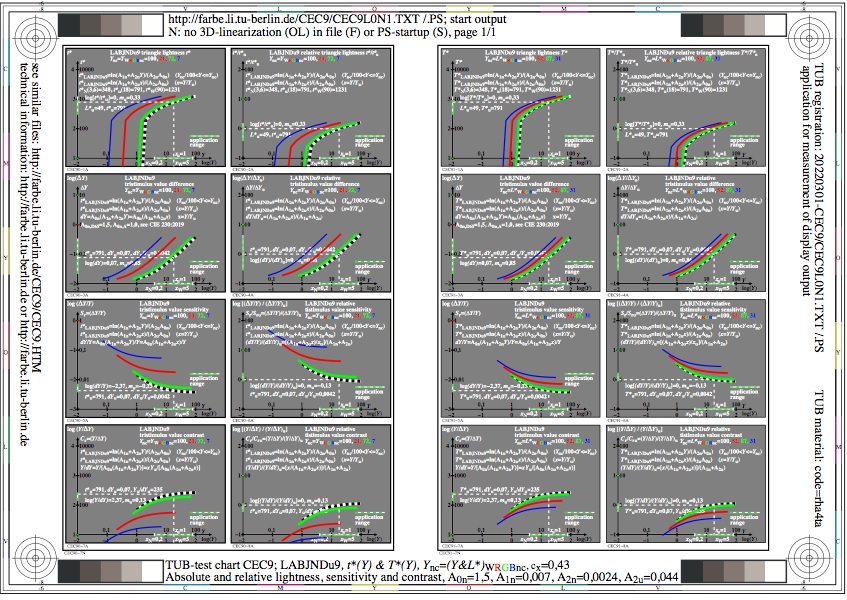
Figure CEC9L0N1.jpg: Output in format A6 of the file
CEC9L0NP.PDF, see
CEC9L0N1.
PS /
TXT /
PDF /
jpg
CEC9: TUB-test chart CEC9; LABJNDu9 formulae similar to CIE 230
LABJND lightness, A0n=1,50, A1n, A2n, cx=0,43
absolute and relative lightness, sensitivity and contrast
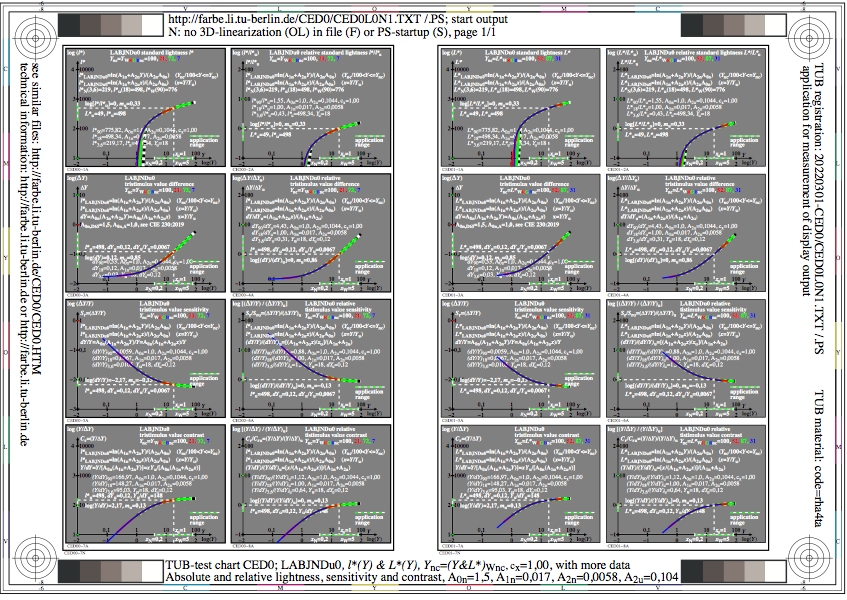
Figure CED0L0N1.jpg: Output in format A6 of the file
CED0L0NP.PDF, see
CED0L0N1.
PS /
TXT /
PDF /
jpg
CED0: TUB-test chart CED0; LABJNDu0 formulae similar to CIE 230
LABJND lightness, A0n=1,00, A1n, A2n, cx=1,00 & data
absolute and relative lightness, sensitivity and contrast
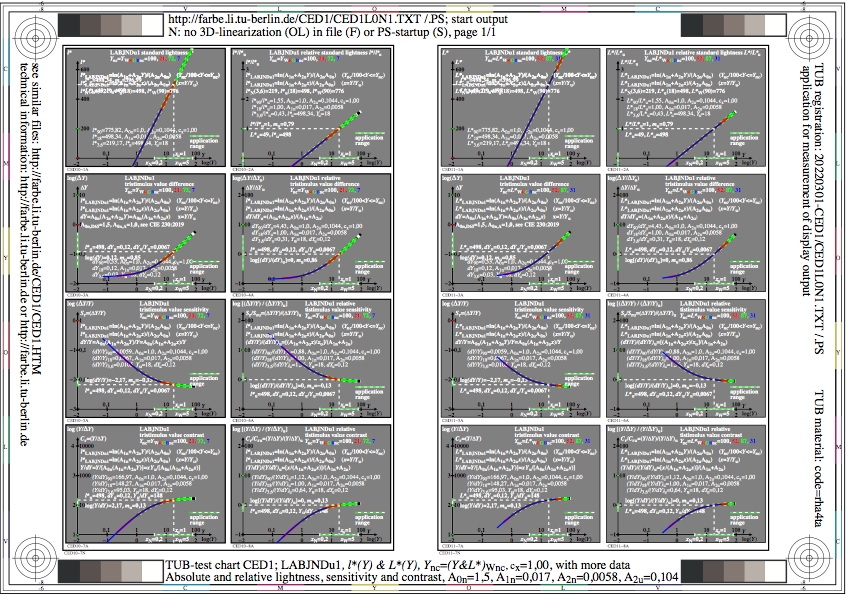
Figure CED1L0N1.jpg: Output in format A6 of the file
CED1L0NP.PDF, see
CED1L0N1.
PS /
TXT /
PDF /
jpg
CED1: TUB-test chart CED1; LABJNDu1 formulae similar to CIE 230
LABJND lightness, A0n=1,00, A1n, A2n, cx=1,00 & data
absolute and relative lightness, sensitivity and contrast
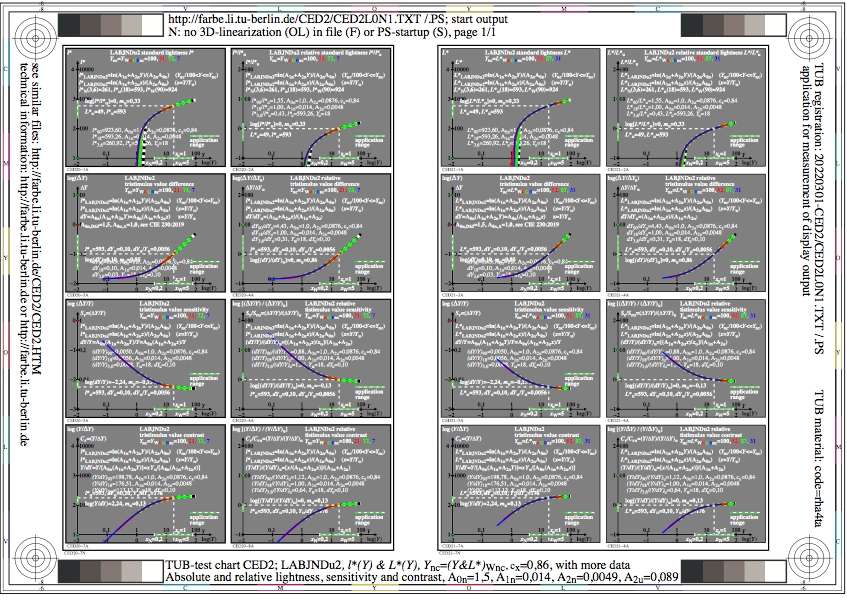
Figure CED2L0N1.jpg: Output in format A6 of the file
CED2L0NP.PDF, see
CED2L0N1.
PS /
TXT /
PDF /
jpg
CED2: TUB-test chart CED2; LABJNDu2 formulae similar to CIE 230
LABJND lightness, A0n=1,00, A1n, A2n, cx=0,84 & data
absolute and relative lightness, sensitivity and contrast

Figure CED3L0N1.jpg: Output in format A6 of the file
CED3L0NP.PDF, see
CED3L0N1.
PS /
TXT /
PDF /
jpg
CED3: TUB-test chart CED3; LABJNDu3 formulae similar to CIE 230
LABJND lightness, A0n=1,00, A1n, A2n, cx=0,67 & data
absolute and relative lightness, sensitivity and contrast

Figure CED4L0N1.jpg: Output in format A6 of the file
CED4L0NP.PDF, see
CED4L0N1.
PS /
TXT /
PDF /
jpg
CED4: TUB-test chart CED4; LABJNDu4 formulae similar to CIE 230
LABJND lightness, A0n=1,00, A1n, A2n, cx=0,42 & data
absolute and relative lightness, sensitivity and contrast

Figure CED5L0N1.jpg: Output in format A6 of the file
CED5L0NP.PDF, see
CED5L0N1.
PS /
TXT /
PDF /
jpg
CED5: TUB-test chart CED5; LABJNDu5 formulae similar to CIE 230
LABJND lightness, A0n=1,00, A1n, A2n, cx=1,00 & data
absolute and relative lightness, sensitivity and contrast
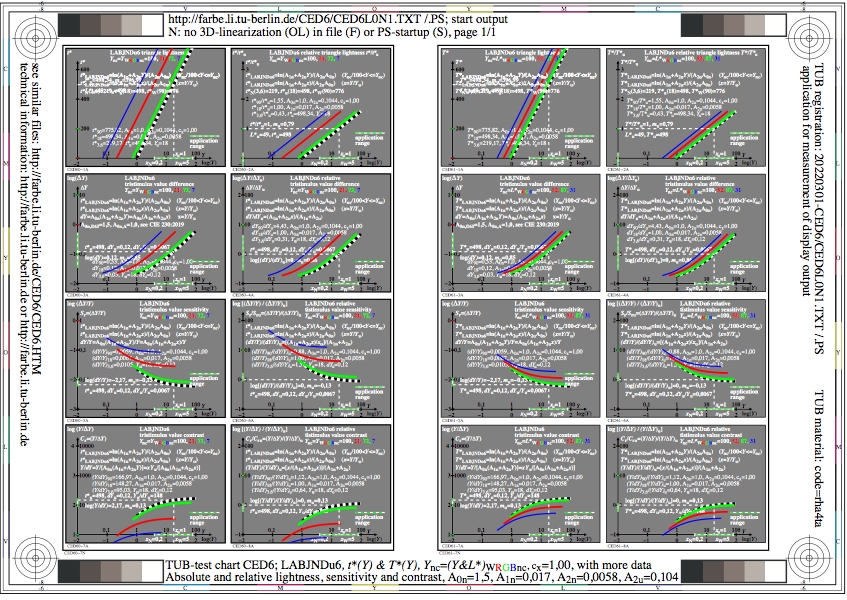
Figure CED6L0N1.jpg: Output in format A6 of the file
CED6L0NP.PDF, see
CED6L0N1.
PS /
TXT /
PDF /
jpg
CED6: TUB-test chart CED6; LABJNDu6 formulae similar to CIE 230
LABJND lightness, A0n=1,00, A1n, A2n, cx=1,00 & data
absolute and relative lightness, sensitivity and contrast
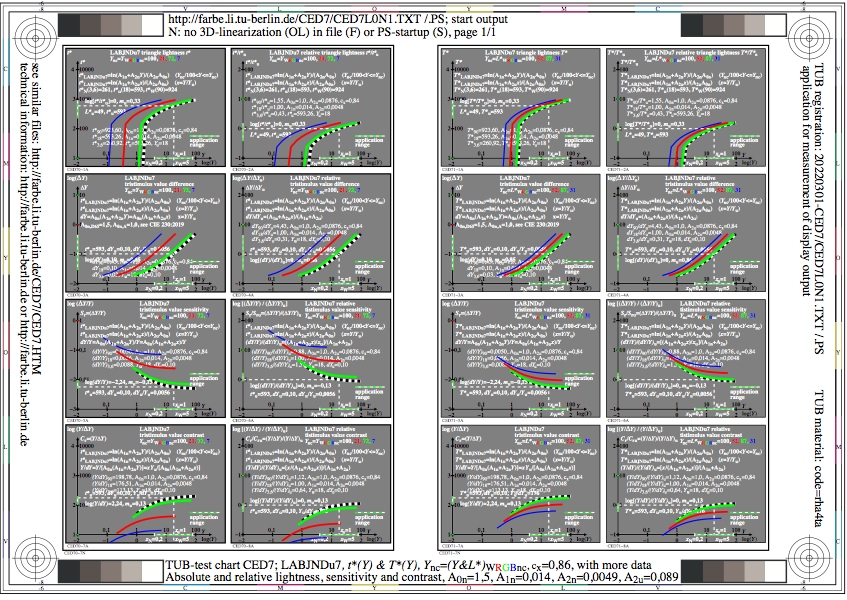
Figure CED7L0N1.jpg: Output in format A6 of the file
CED7L0NP.PDF, see
CED7L0N1.
PS /
TXT /
PDF /
jpg
CED7: TUB-test chart CED7; LABJNDu7 formulae similar to CIE 230
LABJND lightness, A0n=1,00, A1n, A2n, cx=0,84 & data
absolute and relative lightness, sensitivity and contrast

Figure CED8L0N1.jpg: Output in format A6 of the file
CED8L0NP.PDF, see
CED8L0N1.
PS /
TXT /
PDF /
jpg
CED8: TUB-test chart CED8; LABJNDu8 formulae similar to CIE 230
LABJND lightness, A0n=1,00, A1n, A2n, cx=0,67 & data
absolute and relative lightness, sensitivity and contrast
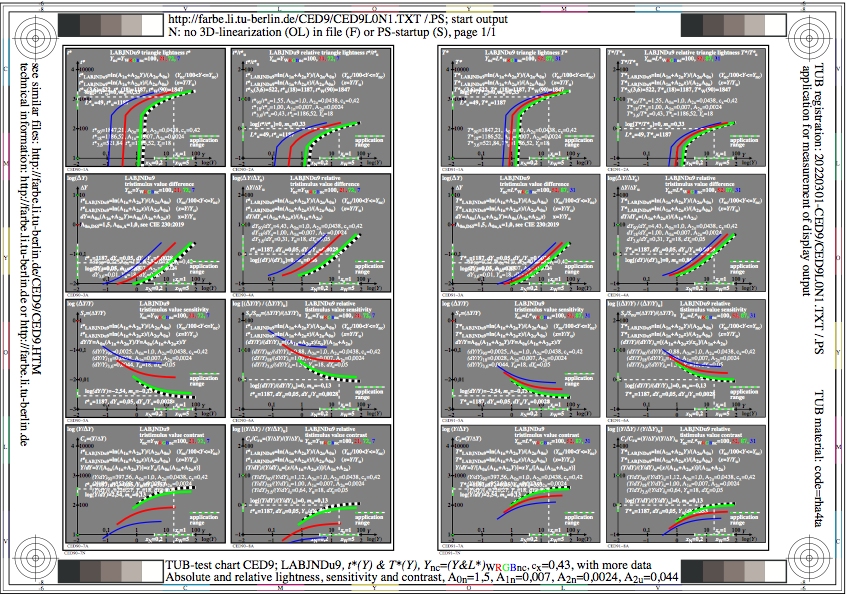
Figure CED9L0N1.jpg: Output in format A6 of the file
CED9L0NP.PDF, see
CED9L0N1.
PS /
TXT /
PDF /
jpg
CED9: TUB-test chart CED9; LABJNDu9 formulae similar to CIE 230
LABJND lightness, A0n=1,00, A1n, A2n, cx=0,43 & data
absolute and relative lightness, sensitivity and contrast
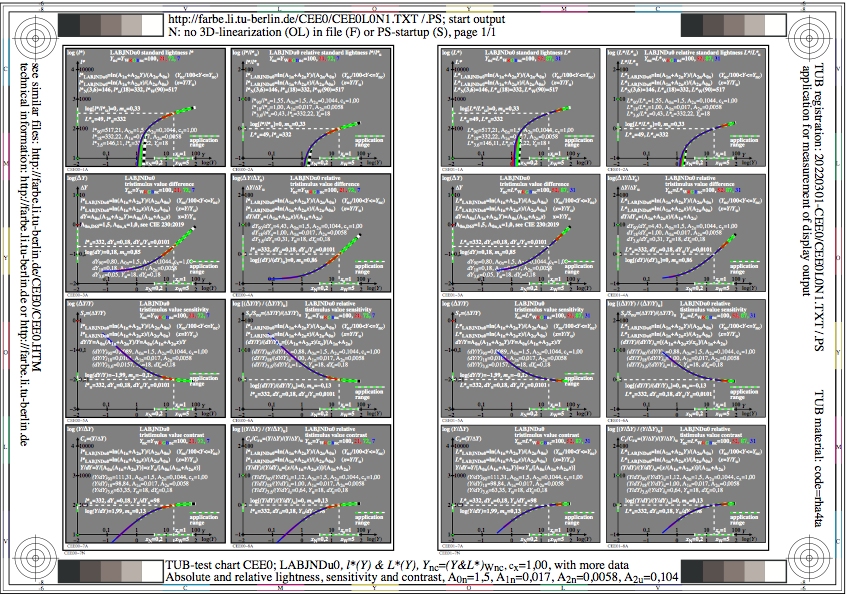
Figure CEE0L0N1.jpg: Output in format A6 of the file
CEE0L0NP.PDF, see
CEE0L0N1.
PS /
TXT /
PDF /
jpg
CEE0: TUB-test chart CEE0; LABJNDu0 formulae similar to CIE 230
LABJND lightness, A0n=1,50, A1n/cx, A2n, cx=1,00 & data
absolute and relative lightness, sensitivity and contrast
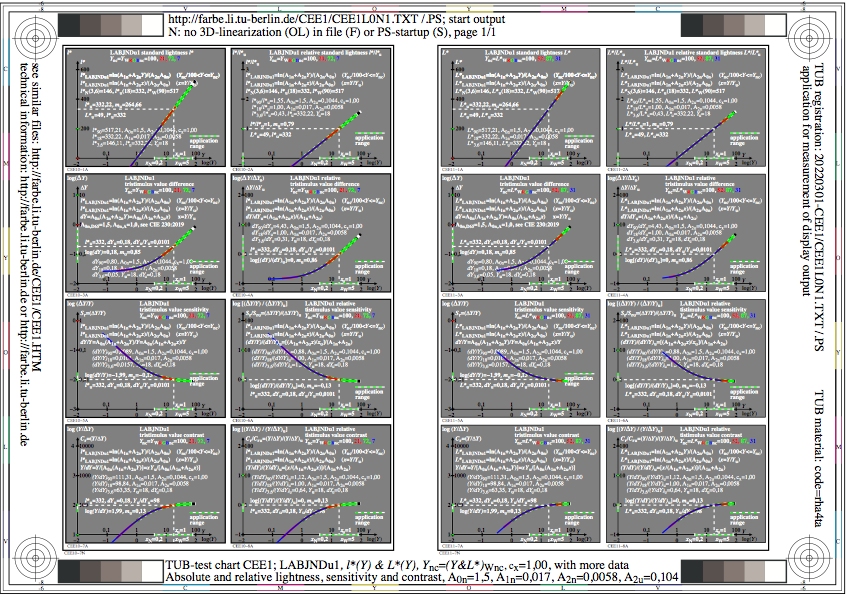
Figure CEE1L0N1.jpg: Output in format A6 of the file
CEE1L0NP.PDF, see
CEE1L0N1.
PS /
TXT /
PDF /
jpg
CEE1: TUB-test chart CEE1; LABJNDu1 formulae similar to CIE 230
LABJND lightness, A0n=1,50, A1n/cx, A2n, cx=1,00 & data
absolute and relative lightness, sensitivity and contrast
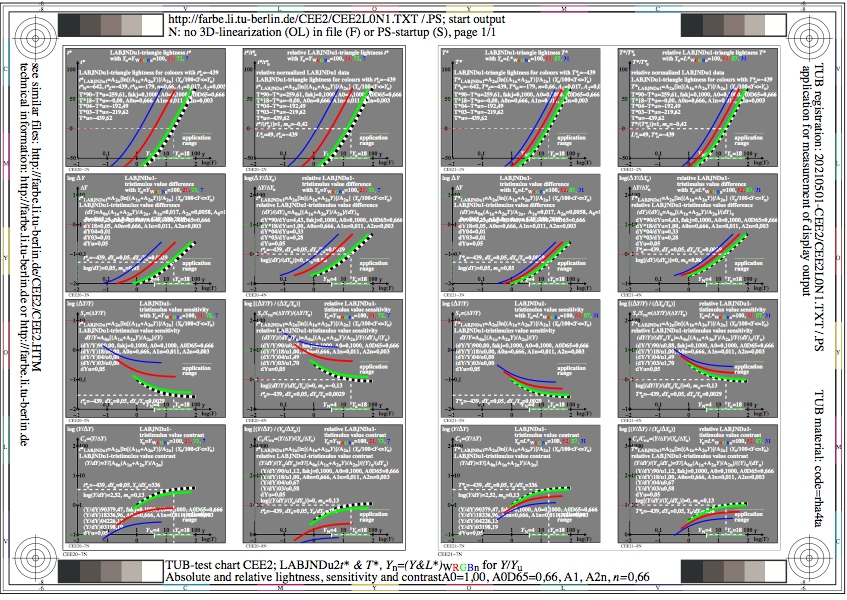
Figure CEE2L0N1.jpg: Output in format A6 of the file
CEE2L0NP.PDF, see
CEE2L0N1.
PS /
TXT /
PDF /
jpg
CEE2: TUB-test chart CEE2; LABJNDu2 formulae similar to CIE 230
LABJND lightness, A0n=1,50, A1n/cx, A2n, cx=0,84 & data
absolute and relative lightness, sensitivity and contrast
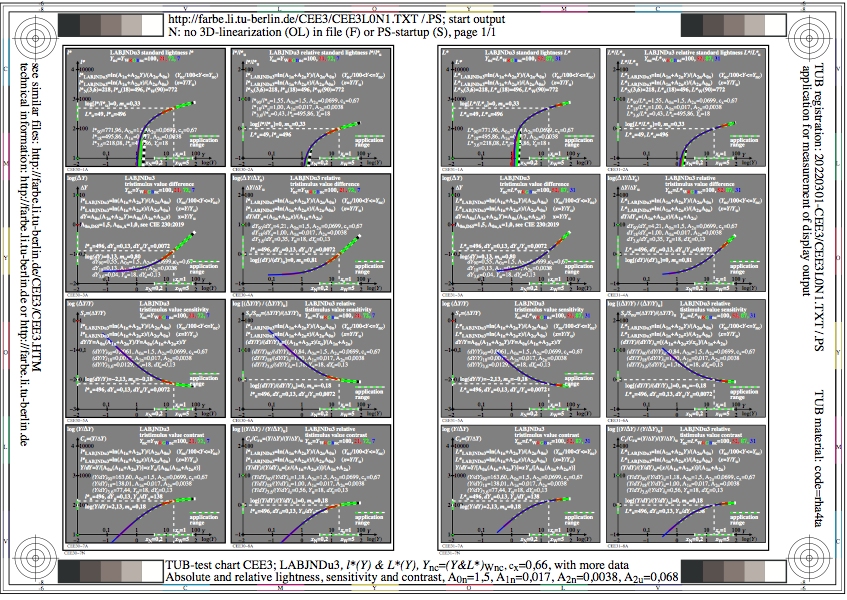
Figure CEE3L0N1.jpg: Output in format A6 of the file
CEE3L0NP.PDF, see
CEE3L0N1.
PS /
TXT /
PDF /
jpg
CEE3: TUB-test chart CEE3; LABJNDu3 formulae similar to CIE 230
LABJND lightness, A0n=1,50, A1n/cx, A2n, cx=0,67 & data
absolute and relative lightness, sensitivity and contrast

Figure CEE4L0N1.jpg: Output in format A6 of the file
CEE4L0NP.PDF, see
CEE4L0N1.
PS /
TXT /
PDF /
jpg
CEE4: TUB-test chart CEE4; LABJNDu4 formulae similar to CIE 230
LABJND lightness, A0n=1,50, A1n/cx, A2n, cx=0,42 & data
absolute and relative lightness, sensitivity and contrast

Figure CEE5L0N1.jpg: Output in format A6 of the file
CEE5L0NP.PDF, see
CEE5L0N1.
PS /
TXT /
PDF /
jpg
CEE5: TUB-test chart CEE5; LABJNDu5 formulae similar to CIE 230
LABJND lightness, A0n=1,50, A1n/cx, A2n, cx=1,00 & data
absolute and relative lightness, sensitivity and contrast

Figure CEE6L0N1.jpg: Output in format A6 of the file
CEE6L0NP.PDF, see
CEE6L0N1.
PS /
TXT /
PDF /
jpg
CEE6: TUB-test chart CEE6; LABJNDu6 formulae similar to CIE 230
LABJND lightness, A0n=1,50, A1n/cx, A2n, cx=1,00 & data
absolute and relative lightness, sensitivity and contrast
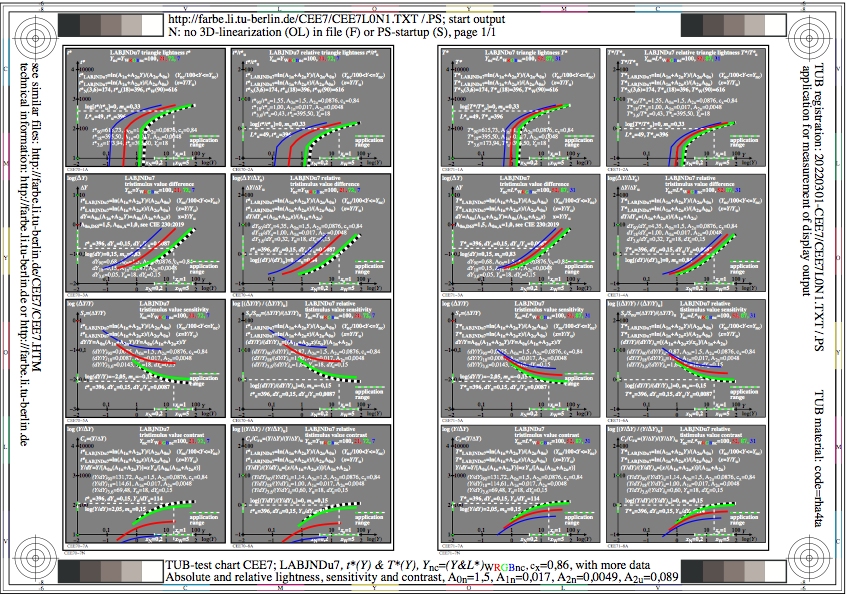
Figure CEE7L0N1.jpg: Output in format A6 of the file
CEE7L0NP.PDF, see
CEE7L0N1.
PS /
TXT /
PDF /
jpg
CEE7: TUB-test chart CEE7; LABJNDu7 formulae similar to CIE 230
LABJND lightness, A0n=1,50, A1n/cx, A2n, cx=0,84 & data
absolute and relative lightness, sensitivity and contrast

Figure CEE8L0N1.jpg: Output in format A6 of the file
CEE8L0NP.PDF, see
CEE8L0N1.
PS /
TXT /
PDF /
jpg
CEE8: TUB-test chart CEE8; LABJNDu8 formulae similar to CIE 230
LABJND lightness, A0n=1,50, A1n/cx, A2n, cx=0,67 & data
absolute and relative lightness, sensitivity and contrast

Figure CEE9L0N1.jpg: Output in format A6 of the file
CEE9L0NP.PDF, see
CEE9L0N1.
PS /
TXT /
PDF /
jpg
CEE9: TUB-test chart CEE9; LABJNDu9 formulae similar to CIE 230
LABJND lightness, A0n=1,50, A1n/cx, A2n, cx=0,42 & data
absolute and relative lightness, sensitivity and contrast
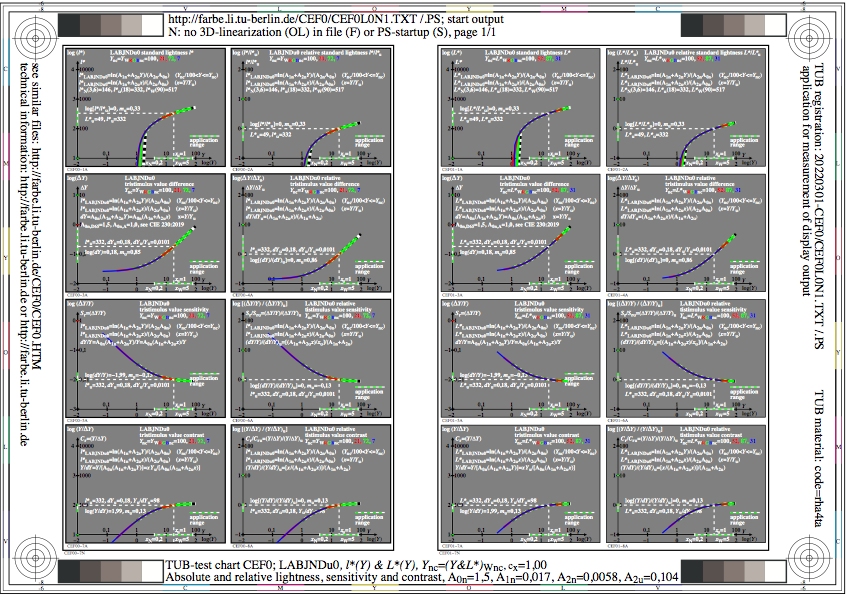
Figure CEF0L0N1.jpg: Output in format A6 of the file
CEF0L0NP.PDF, see
CEF0L0N1.
PS /
TXT /
PDF /
jpg
CEF0: TUB-test chart CEF0; LABJNDu0 formulae similar to CIE 230
LABJND lightness, A0n=1,50, A1n/cx, A2n, cx=1,00
absolute and relative lightness, sensitivity and contrast

Figure CEF1L0N1.jpg: Output in format A6 of the file
CEF1L0NP.PDF, see
CEF1L0N1.
PS /
TXT /
PDF /
jpg
CEF1: TUB-test chart CEF1; LABJNDu1 formulae similar to CIE 230
LABJND lightness, A0n=1,50, A1n/cx, A2n, cx=1,00
absolute and relative lightness, sensitivity and contrast
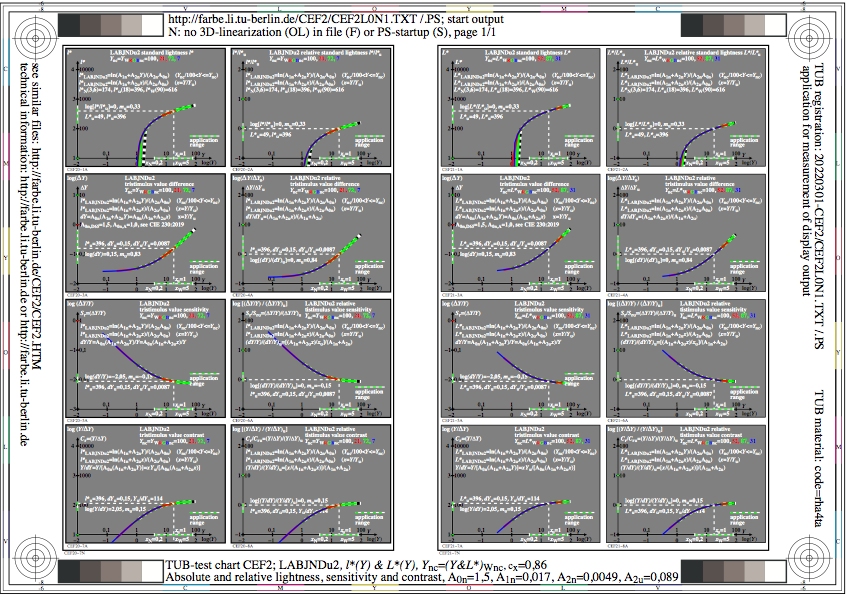
Figure CEF2L0N1.jpg: Output in format A6 of the file
CEF2L0NP.PDF, see
CEF2L0N1.
PS /
TXT /
PDF /
jpg
CEF2: TUB-test chart CEF2; LABJNDu2 formulae similar to CIE 230
LABJND lightness, A0n=1,50, A1n/cx, A2n, cx=0,84
absolute and relative lightness, sensitivity and contrast

Figure CEF3L0N1.jpg: Output in format A6 of the file
CEF3L0NP.PDF, see
CEF3L0N1.
PS /
TXT /
PDF /
jpg
CEF3: TUB-test chart CEF3; LABJNDu3 formulae similar to CIE 230
LABJND lightness, A0n=1,50, A1n/cx, A2n, cx=0,67
absolute and relative lightness, sensitivity and contrast
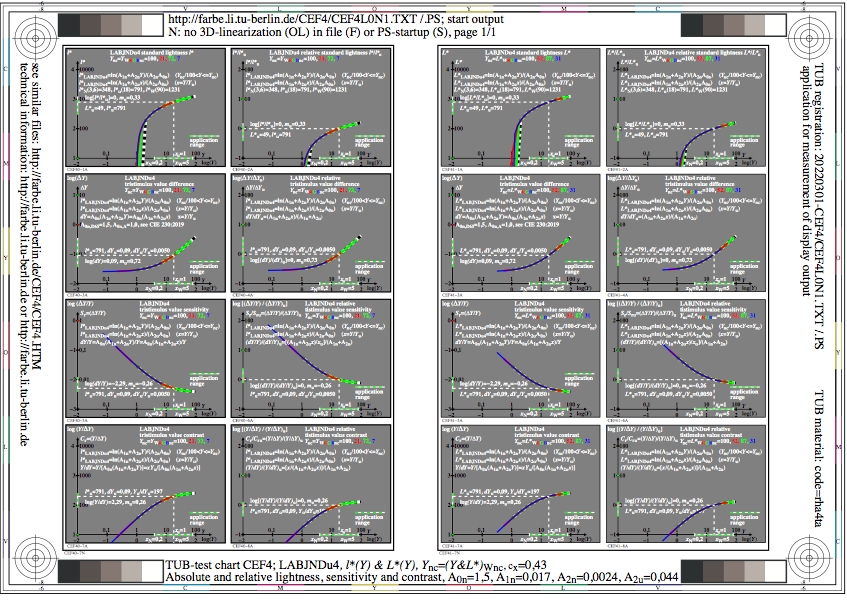
Figure CEF4L0N1.jpg: Output in format A6 of the file
CEF4L0NP.PDF, see
CEF4L0N1.
PS /
TXT /
PDF /
jpg
CEF4: TUB-test chart CEF4; LABJNDu4 formulae similar to CIE 230
LABJND lightness, A0n=1,50, A1n/cx, A2n, cx=0,42
absolute and relative lightness, sensitivity and contrast
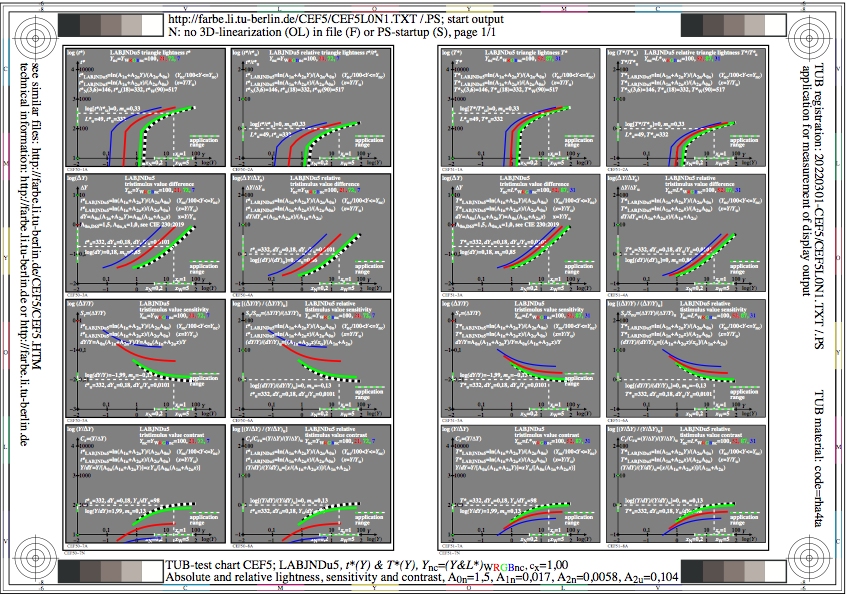
Figure CEF5L0N1.jpg: Output in format A6 of the file
CEF5L0NP.PDF, see
CEF5L0N1.
PS /
TXT /
PDF /
jpg
CEF5: TUB-test chart CEF5; LABJNDu5 formulae similar to CIE 230
LABJND lightness, A0n=1,50, A1n/cx, A2n, cx=1,00
absolute and relative lightness, sensitivity and contrast

Figure CEF6L0N1.jpg: Output in format A6 of the file
CEF6L0NP.PDF, see
CEF6L0N1.
PS /
TXT /
PDF /
jpg
CEF6: TUB-test chart CEF6; LABJNDu6 formulae similar to CIE 230
LABJND lightness, A0n=1,50, A1n/cx, A2n, cx=1,00
absolute and relative lightness, sensitivity and contrast

Figure CEF7L0N1.jpg: Output in format A6 of the file
CEF7L0NP.PDF, see
CEF7L0N1.
PS /
TXT /
PDF /
jpg
CEF7: TUB-test chart CEF7; LABJNDu7 formulae similar to CIE 230
LABJND lightness, A0n=1,50, A1n/cx, A2n, cx=0,84
absolute and relative lightness, sensitivity and contrast

Figure CEF8L0N1.jpg: Output in format A6 of the file
CEF8L0NP.PDF, see
CEF8L0N1.
PS /
TXT /
PDF /
jpg
CEF8: TUB-test chart CEF8; LABJNDu8 formulae similar to CIE 230
LABJND lightness, A0n=1,50, A1n/cx, A2n, cx=0,67
absolute and relative lightness, sensitivity and contrast

Figure CEF9L0N1.jpg: Output in format A6 of the file
CEF9L0NP.PDF, see
CEF9L0N1.
PS /
TXT /
PDF /
jpg
CEF9: TUB-test chart CEF9; LABJNDu9 formulae similar to CIE 230
LABJND lightness, A0n=1,50, A1n/cx, A2n, cx=0,42
absolute and relative lightness, sensitivity and contrast

Figure CEG0L0N1.jpg: Output in format A6 of the file
CEG0L0NP.PDF, see
CEG0L0N1.
PS /
TXT /
PDF /
jpg
CEG0: TUB-test chart CEG0; LABJNDu0 formulae similar to CIE 230
LABJND lightness, A0n=1,50, A1n, A2n/cx, cx=1,00 & data
absolute and relative lightness, sensitivity and contrast

Figure CEG1L0N1.jpg: Output in format A6 of the file
CEG1L0NP.PDF, see
CEG1L0N1.
PS /
TXT /
PDF /
jpg
CEG1: TUB-test chart CEG1; LABJNDu1 formulae similar to CIE 230
LABJND lightness, A0n=1,50, A1n, A2n/cx, cx=1,00 & data
absolute and relative lightness, sensitivity and contrast
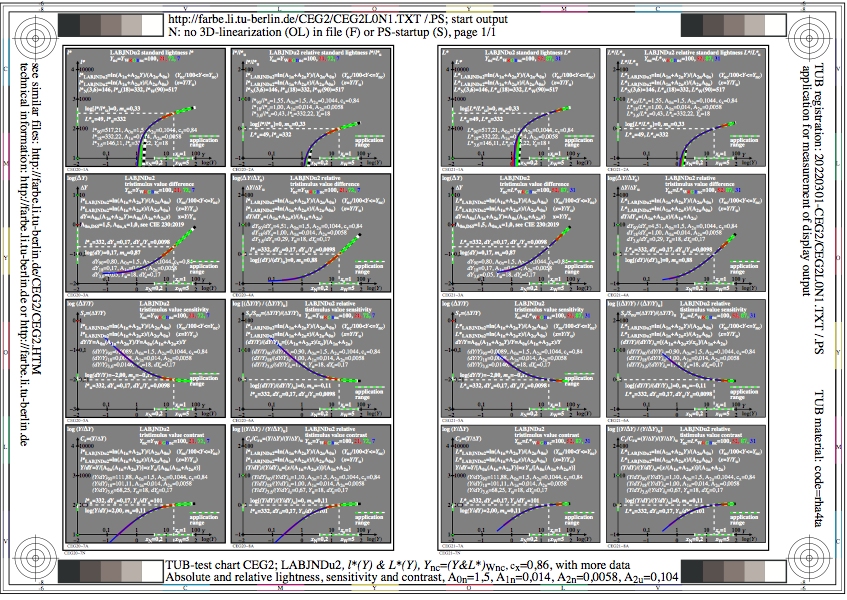
Figure CEG2L0N1.jpg: Output in format A6 of the file
CEG2L0NP.PDF, see
CEG2L0N1.
PS /
TXT /
PDF /
jpg
CEG2: TUB-test chart CEG2; LABJNDu2 formulae similar to CIE 230
LABJND lightness, A0n=1,50, A1n, A2n/cx, cx=0,84 & data
absolute and relative lightness, sensitivity and contrast

Figure CEG3L0N1.jpg: Output in format A6 of the file
CEG3L0NP.PDF, see
CEG3L0N1.
PS /
TXT /
PDF /
jpg
CEG3: TUB-test chart CEG3; LABJNDu3 formulae similar to CIE 230
LABJND lightness, A0n=1,50, A1n, A2n/cx, cx=0,67 & data
absolute and relative lightness, sensitivity and contrast

Figure CEG4L0N1.jpg: Output in format A6 of the file
CEG4L0NP.PDF, see
CEG4L0N1.
PS /
TXT /
PDF /
jpg
CEG4: TUB-test chart CEG4; LABJNDu4 formulae similar to CIE 230
LABJND lightness, A0n=1,50, A1n, A2n/cx, cx=0,42 & data
absolute and relative lightness, sensitivity and contrast

Figure CEG5L0N1.jpg: Output in format A6 of the file
CEG5L0NP.PDF, see
CEG5L0N1.
PS /
TXT /
PDF /
jpg
CEG5: TUB-test chart CEG5; LABJNDu5 formulae similar to CIE 230
LABJND lightness, A0n=1,50, A1n, A2n/cx, cx=1,00 & data
absolute and relative lightness, sensitivity and contrast

Figure CEG6L0N1.jpg: Output in format A6 of the file
CEG6L0NP.PDF, see
CEG6L0N1.
PS /
TXT /
PDF /
jpg
CEG6: TUB-test chart CEG6; LABJNDu6 formulae similar to CIE 230
LABJND lightness, A0n=1,50, A1n, A2n/cx, cx=1,00 & data
absolute and relative lightness, sensitivity and contrast

Figure CEG7L0N1.jpg: Output in format A6 of the file
CEG7L0NP.PDF, see
CEG7L0N1.
PS /
TXT /
PDF /
jpg
CEG7: TUB-test chart CEG7; LABJNDu7 formulae similar to CIE 230
LABJND lightness, A0n=1,50, A1n, A2n/cx, cx=0,84 & data
absolute and relative lightness, sensitivity and contrast
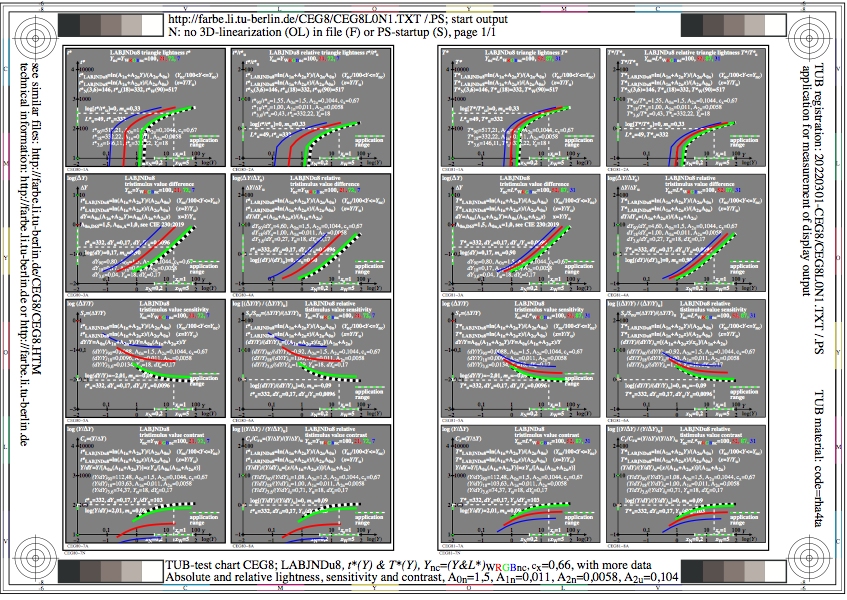
Figure CEG8L0N1.jpg: Output in format A6 of the file
CEG8L0NP.PDF, see
CEG8L0N1.
PS /
TXT /
PDF /
jpg
CEG8: TUB-test chart CEG8; LABJNDu8 formulae similar to CIE 230
LABJND lightness, A0n=1,50, A1n, A2n/cx, cx=0,67 & data
absolute and relative lightness, sensitivity and contrast

Figure CEG9L0N1.jpg: Output in format A6 of the file
CEG9L0NP.PDF, see
CEG9L0N1.
PS /
TXT /
PDF /
jpg
CEG9: TUB-test chart CEG9; LABJNDu9 formulae similar to CIE 230
LABJND lightness, A0n=1,50, A1n, A2n/cx, cx=0,42 & data
absolute and relative lightness, sensitivity and contrast

Figure CEH0L0N1.jpg: Output in format A6 of the file
CEH0L0NP.PDF, see
CEH0L0N1.
PS /
TXT /
PDF /
jpg
CEH0: TUB-test chart CEH0; LABJNDu0 formulae similar to CIE 230
LABJND lightness, A0n=1,50, A1n, A2n/cx, cx=1,00
absolute and relative lightness, sensitivity and contrast
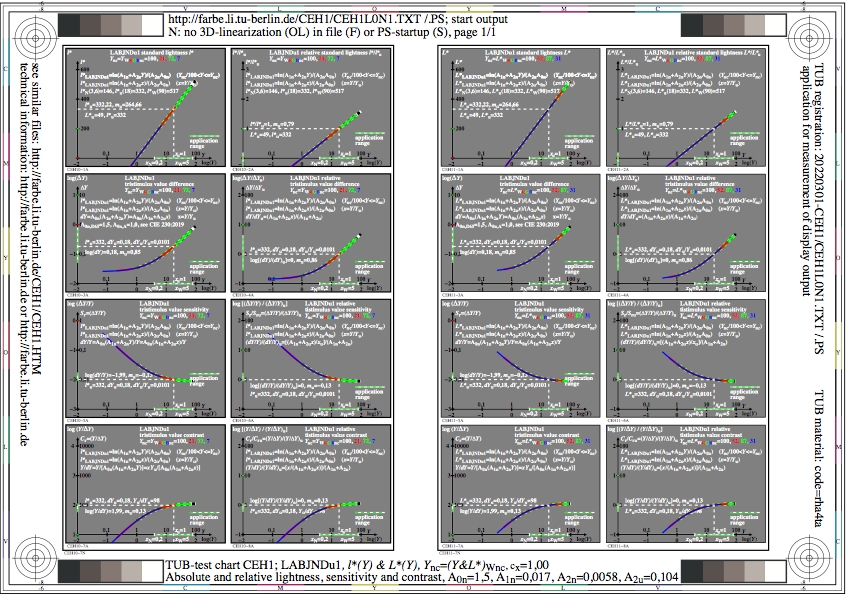
Figure CEH1L0N1.jpg: Output in format A6 of the file
CEH1L0NP.PDF, see
CEH1L0N1.
PS /
TXT /
PDF /
jpg
CEH1: TUB-test chart CEH1; LABJNDu1 formulae similar to CIE 230
LABJND lightness, A0n=1,50, A1n, A2n/cx, cx=1,00
absolute and relative lightness, sensitivity and contrast
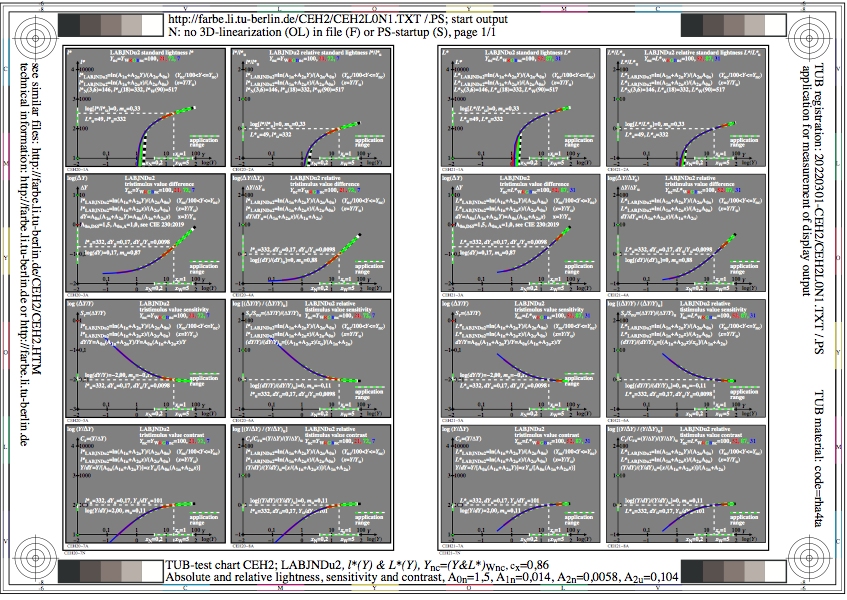
Figure CEH2L0N1.jpg: Output in format A6 of the file
CEH2L0NP.PDF, see
CEH2L0N1.
PS /
TXT /
PDF /
jpg
CEH2: TUB-test chart CEH2; LABJNDu2 formulae similar to CIE 230
LABJND lightness, A0n=1,50, A1n, A2n/cx, cx=0,84
absolute and relative lightness, sensitivity and contrast
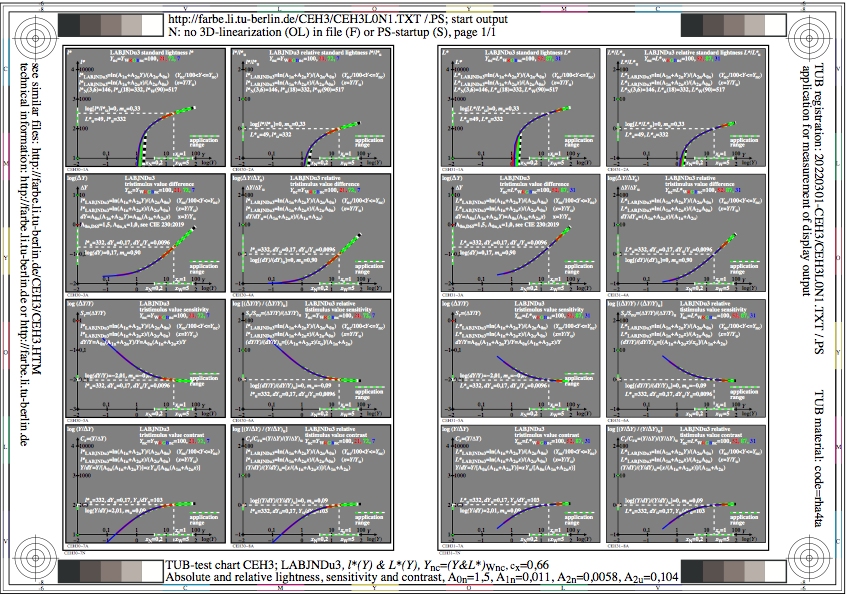
Figure CEH3L0N1.jpg: Output in format A6 of the file
CEH3L0NP.PDF, see
CEH3L0N1.
PS /
TXT /
PDF /
jpg
CEH3: TUB-test chart CEH3; LABJNDu3 formulae similar to CIE 230
LABJND lightness, A0n=1,50, A1n, A2n/cx, cx=0,67
absolute and relative lightness, sensitivity and contrast
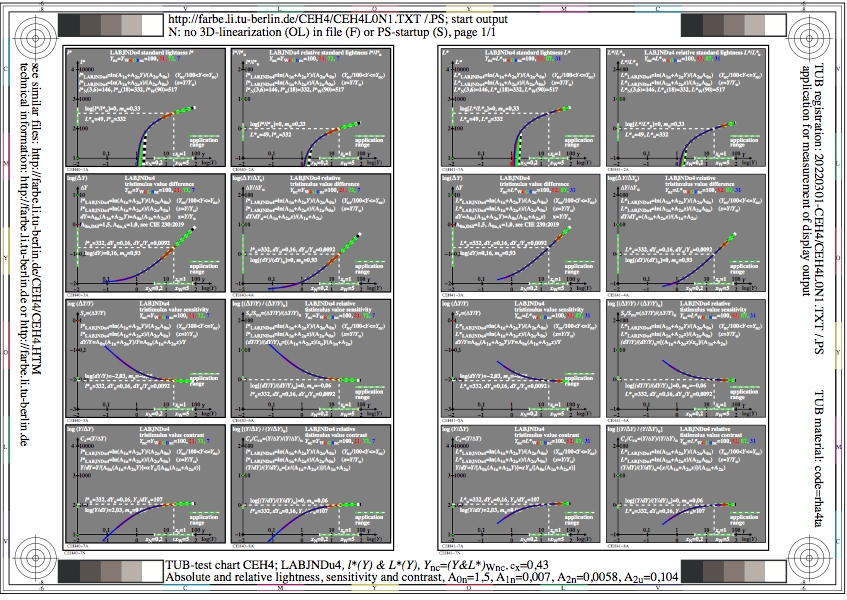
Figure CEH4L0N1.jpg: Output in format A6 of the file
CEH4L0NP.PDF, see
CEH4L0N1.
PS /
TXT /
PDF /
jpg
CEH4: TUB-test chart CEH4; LABJNDu4 formulae similar to CIE 230
LABJND lightness, A0n=1,50, A1n, A2n/cx, cx=0,42
absolute and relative lightness, sensitivity and contrast

Figure CEH5L0N1.jpg: Output in format A6 of the file
CEH5L0NP.PDF, see
CEH5L0N1.
PS /
TXT /
PDF /
jpg
CEH5: TUB-test chart CEH5; LABJNDu5 formulae similar to CIE 230
LABJND lightness, A0n=1,50, A1n, A2n/cx, cx=1,00
absolute and relative lightness, sensitivity and contrast

Figure CEH6L0N1.jpg: Output in format A6 of the file
CEH6L0NP.PDF, see
CEH6L0N1.
PS /
TXT /
PDF /
jpg
CEH6: TUB-test chart CEH6; LABJNDu6 formulae similar to CIE 230
LABJND lightness, A0n=1,50, A1n, A2n/cx, cx=1,00
absolute and relative lightness, sensitivity and contrast
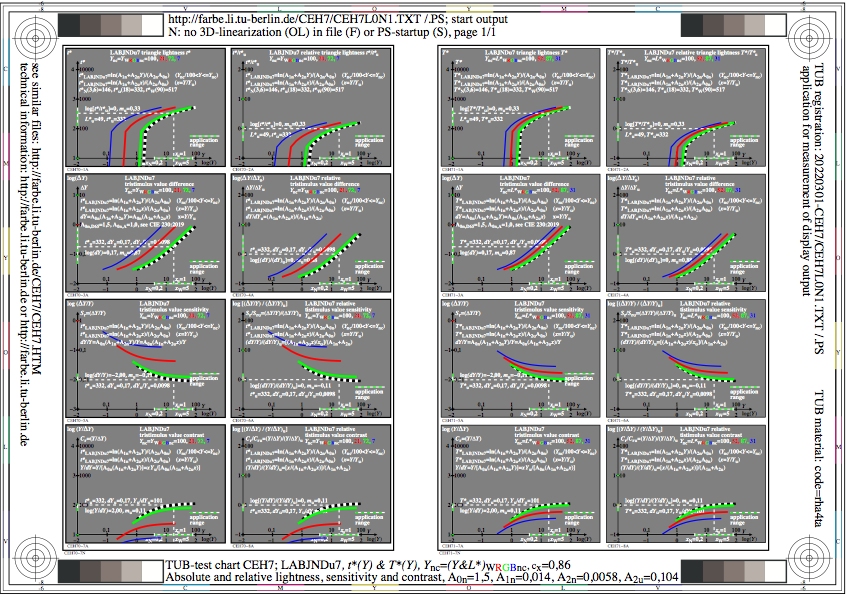
Figure CEH7L0N1.jpg: Output in format A6 of the file
CEH7L0NP.PDF, see
CEH7L0N1.
PS /
TXT /
PDF /
jpg
CEH7: TUB-test chart CEH7; LABJNDu7 formulae similar to CIE 230
LABJND lightness, A0n=1,50, A1n, A2n/cx, cx=0,84
absolute and relative lightness, sensitivity and contrast
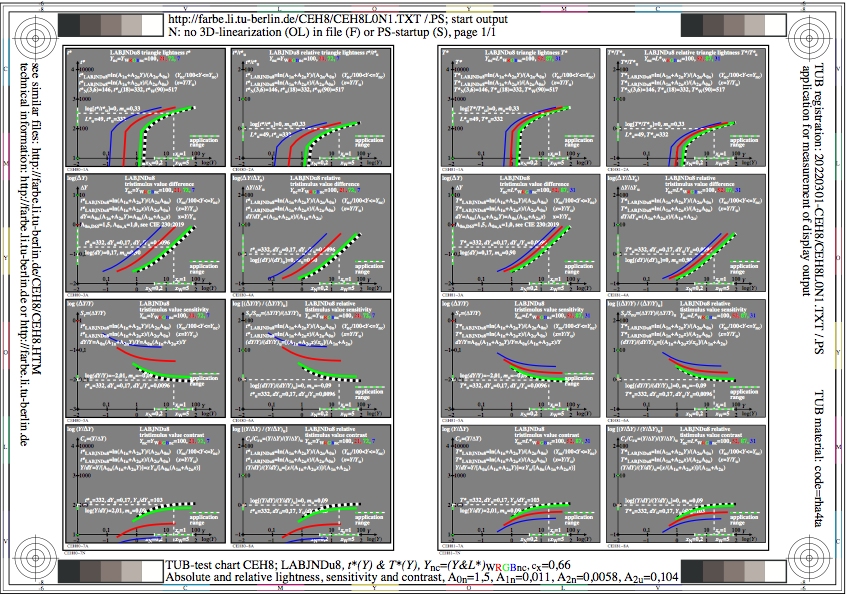
Figure CEH8L0N1.jpg: Output in format A6 of the file
CEH8L0NP.PDF, see
CEH8L0N1.
PS /
TXT /
PDF /
jpg
CEH8: TUB-test chart CEH8; LABJNDu8 formulae similar to CIE 230
LABJND lightness, A0n=1,50, A1n, A2n/cx, cx=0,67
absolute and relative lightness, sensitivity and contrast
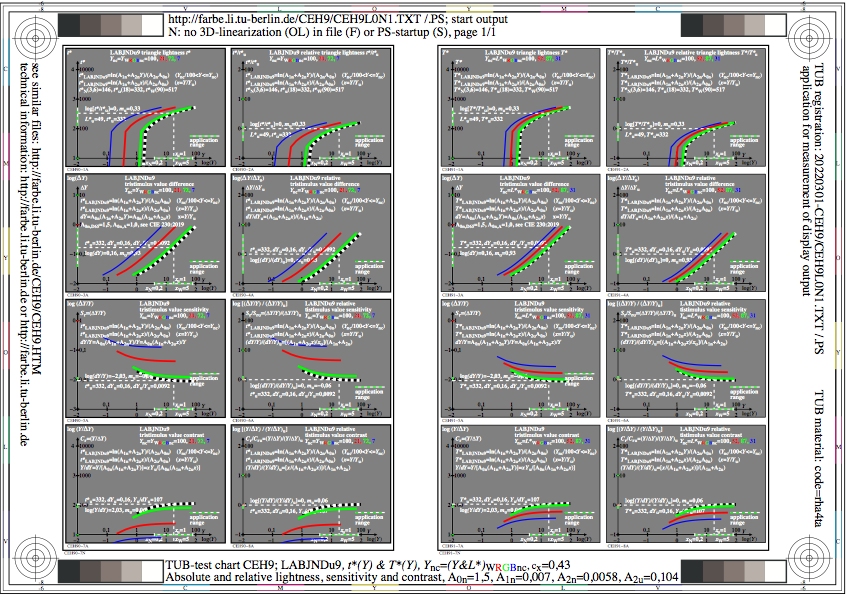
Figure CEH9L0N1.jpg: Output in format A6 of the file
CEH9L0NP.PDF, see
CEH9L0N1.
PS /
TXT /
PDF /
jpg
CEH9: TUB-test chart CEH9; LABJNDu9 formulae similar to CIE 230
LABJND lightness, A0n=1,50, A1n, A2n/cx, cx=0,42
absolute and relative lightness, sensitivity and contrast
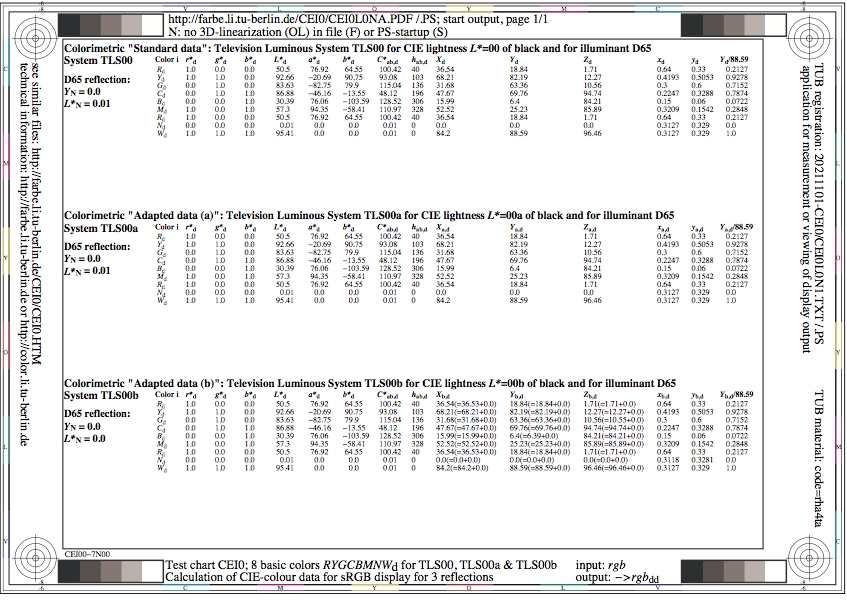
Figure CEI0L0N1.jpg: Output in format A6 of the file
CEI0L0NP.PDF, see
CEI0L0N1.
PS /
TXT /
PDF /
jpg
CEI0: TUB-test chart CEI0; 8 basic colours RYGCBMNW for
the Television-Luminous-Systems TLS00 to TLS70;
data rgb* and CIELAB LabC*h for 8 reflections
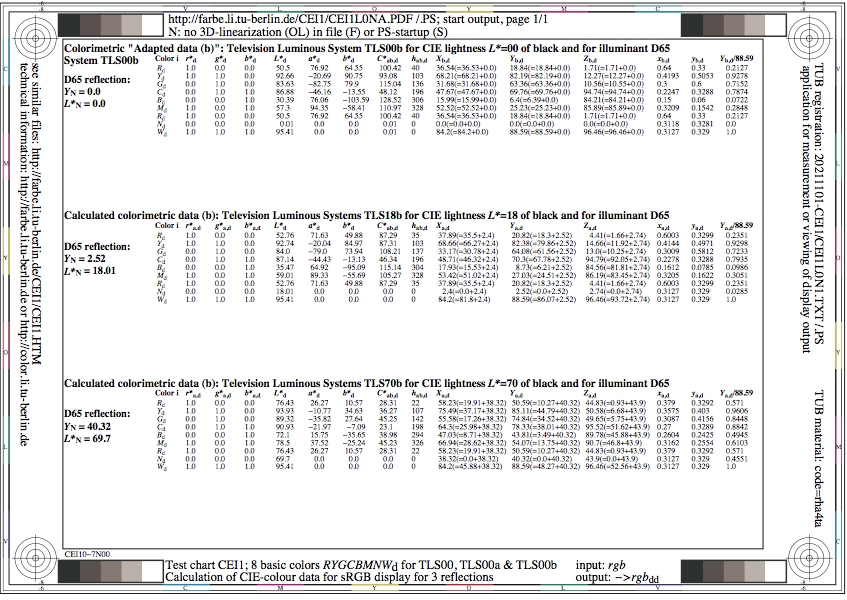
Figure CEI1L0N1.jpg: Output in format A6 of the file
CEI1L0NP.PDF, see
CEI1L0N1.
PS /
TXT /
PDF /
jpg
CEI1: TUB-test chart CEI1; 8 basic colours RYGCBMNW for
the Television-Luminous-Systems TLS00, TLS18, TLS70;
data rgb* and CIELAB LabC*h for 3 reflections

Figure CEI2L0N1.jpg: Output in format A6 of the file
CEI2L0NP.PDF, see
CEI2L0N1.
PS /
TXT /
PDF /
jpg
CEI2: TUB-test chart CEI2; 9 grey steps and NW for
the Television-Luminous-Systems TLS00 to TLS70;
data rgb* and CIELAB LabC*h for 8 reflections

Figure CEI3L0N1.jpg: Output in format A6 of the file
CEI3L0NP.PDF, see
CEI3L0N1.
PS /
TXT /
PDF /
jpg
CEI3: TUB-test chart CEI3; 16 grey steps and NW for
the Television-Luminous-Systems TLS00 to TLS70;
data rgb* and CIELAB LabC*h for 8 reflections
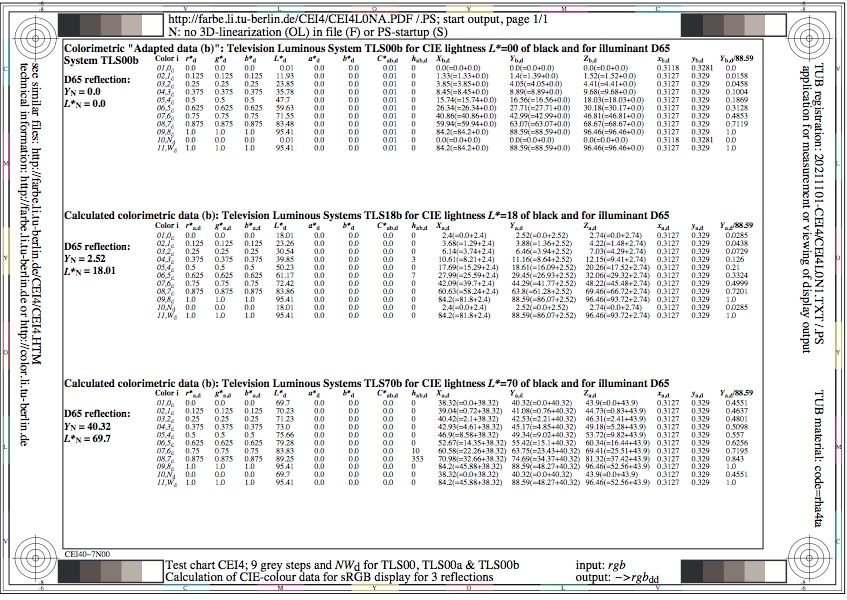
Figure CEI4L0N1.jpg: Output in format A6 of the file
CEI4L0NP.PDF, see
CEI4L0N1.
PS /
TXT /
PDF /
jpg
CEI4: TUB-test chart CEI4; 9 grey steps and NW for
the Television-Luminous-Systems TLS00, TLS18, TLS70;
data rgb* and CIELAB LabC*h for 3 reflections

Figure CEI5L0N1.jpg: Output in format A6 of the file
CEI5L0NP.PDF, see
CEI5L0N1.
PS /
TXT /
PDF /
jpg
CEI5: TUB-test chart CEI5; 16 grey steps and NW for
the Television-Luminous-Systems TLS00, TLS18, TLS70;
data rgb* and CIELAB LabC*h for 3 reflections
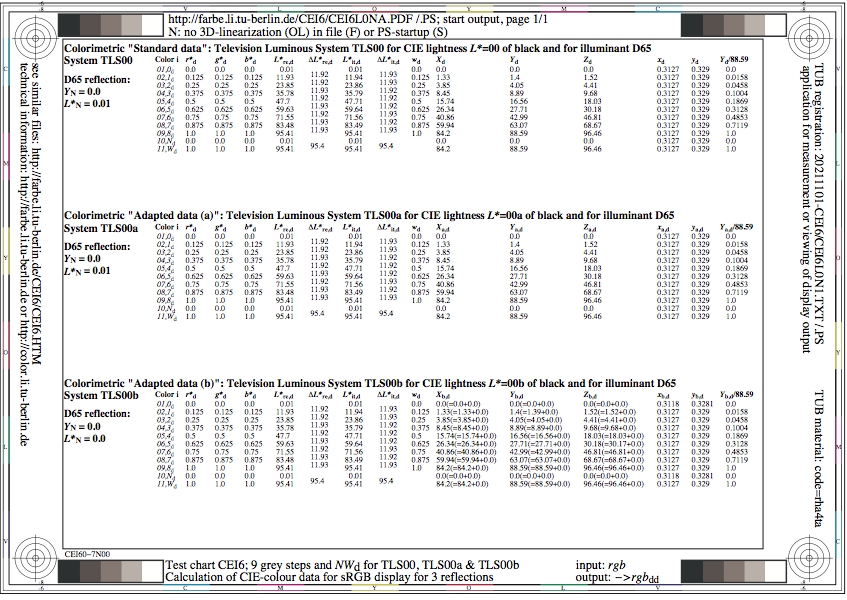
Figure CEI6L0N1.jpg: Output in format A6 of the file
CEI6L0NP.PDF, see
CEI6L0N1.
PS /
TXT /
PDF /
jpg
CEI6: TUB-test chart CEI6; 9 grey steps and NW for
the Television-Luminous-Systems TLS00 to TLS70;
data rgb*, real & intended L* and w for 8 reflections

Figure CEI7L0N1.jpg: Output in format A6 of the file
CEI7L0NP.PDF, see
CEI7L0N1.
PS /
TXT /
PDF /
jpg
CEI7: TUB-test chart CEI7; 16 grey steps and NW for
the Television-Luminous-Systems TLS00 to TLS70;
data rgb*, real & intended L* and w for 8 reflections

Figure CEI8L0N1.jpg: Output in format A6 of the file
CEI8L0NP.PDF, see
CEI8L0N1.
PS /
TXT /
PDF /
jpg
CEI8: TUB-test chart CEI8; 9 grey steps and NW for
the Television-Luminous-Systems TLS00, TLS18, TLS70;
data rgb*, real & intended L* and w for 3 reflections

Figure CEI9L0N1.jpg: Output in format A6 of the file
CEI9L0NP.PDF, see
CEI9L0N1.
PS /
TXT /
PDF /
jpg
CEI9: TUB-test chart CEI9; 16 grey steps and NW for
the Television-Luminous-Systems TLS00, TLS18, TLS70;
data rgb*, real & intended L* and w for 3 reflections
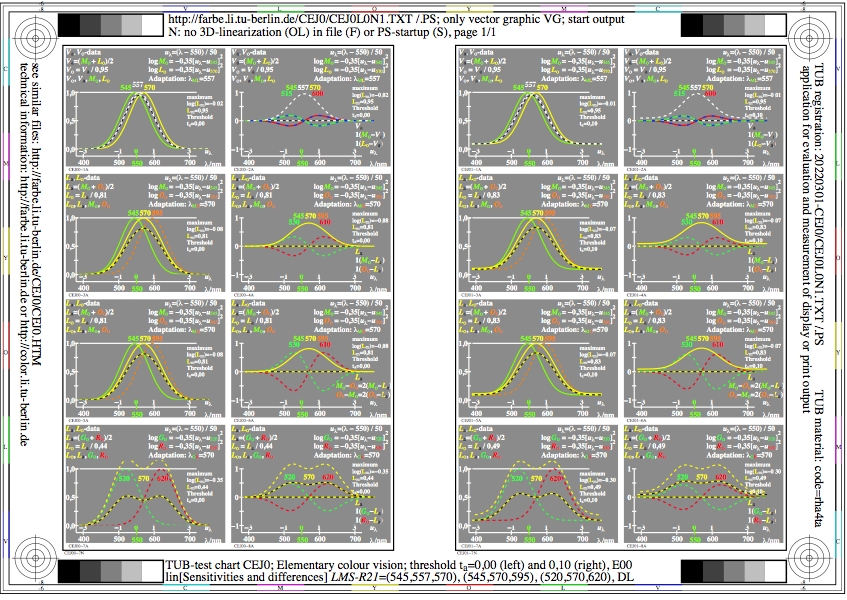
Figure CEJ0L0N1.jpg: Output in format A6 of the file
CEJ0L0NP.PDF, see
CEJ0L0N1.
PS /
TXT /
PDF /
jpg
CEJ0: TUB-test chart CEJ0; Relative colour vision LMS-R21
lin-sensitivity, lin-difference, threshold=0,10, E00, BL
Systems: (545,557,570), (545,570,595), (520,570,620)
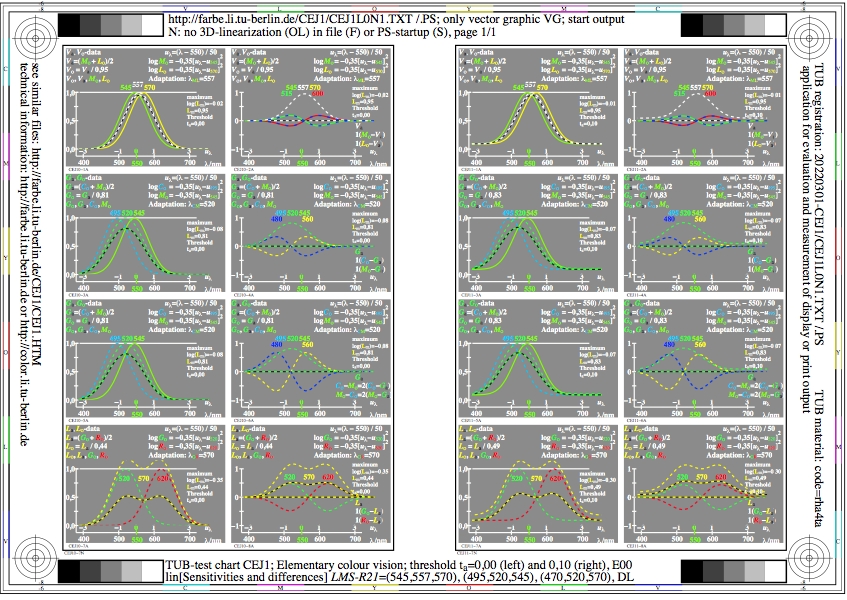
Figure CEJ1L0N1.jpg: Output in format A6 of the file
CEJ1L0NP.PDF, see
CEJ1L0N1.
PS /
TXT /
PDF /
jpg
CEJ1: TUB-test chart CEJ1; Relative colour vision LMS-R21
lin-sensitivity, lin-difference, threshold=0,10, E00, BL
Systems: (545,557,570), (495,520,545), (520,570,620)
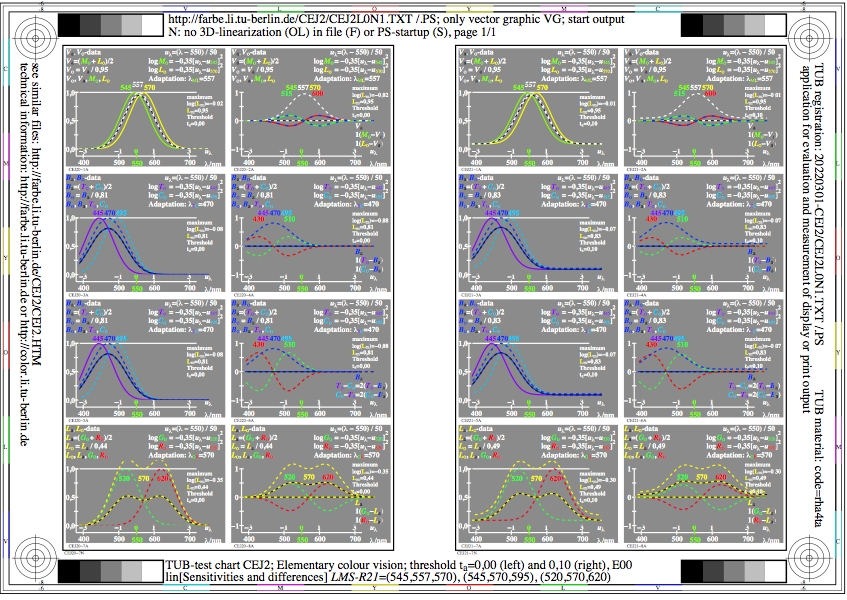
Figure CEJ2L0N1.jpg: Output in format A6 of the file
CEJ2L0NP.PDF, see
CEJ2L0N1.
PS /
TXT /
PDF /
jpg
CEJ2: TUB-test chart CEJ2; Relative colour vision LMS-R21
lin-sensitivity, lin-difference, threshold=0,10, E00, BL
Systems: (545,557,570), (445,470,495), (520,570,620)
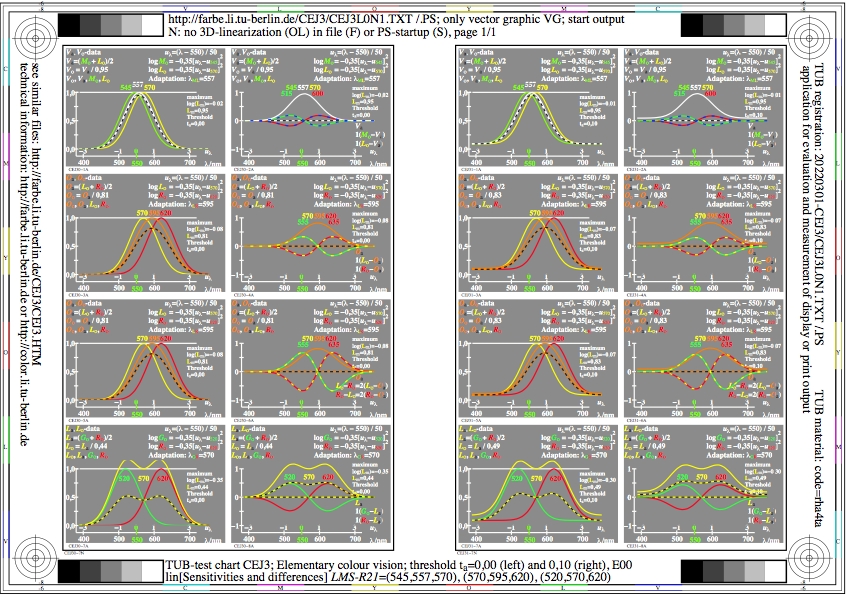
Figure CEJ3L0N1.jpg: Output in format A6 of the file
CEJ3L0NP.PDF, see
CEJ3L0N1.
PS /
TXT /
PDF /
jpg
CEJ3: TUB-test chart CEJ3; Relative colour vision LMS-R21
lin-sensitivity, lin-difference, threshold=0,10, E00
Systems: (545,557,570), (570,595,620), (520,570,620)

Figure CEJ4L0N1.jpg: Output in format A6 of the file
CEJ4L0NP.PDF, see
CEJ4L0N1.
PS /
TXT /
PDF /
jpg
CEJ4: TUB-test chart CEJ4; Relative colour vision LMS-R21
lin-sensitivity, lin-difference, threshold=0,10, E00
Systems: (545,557,570), (545,570,595), (520,570,620)
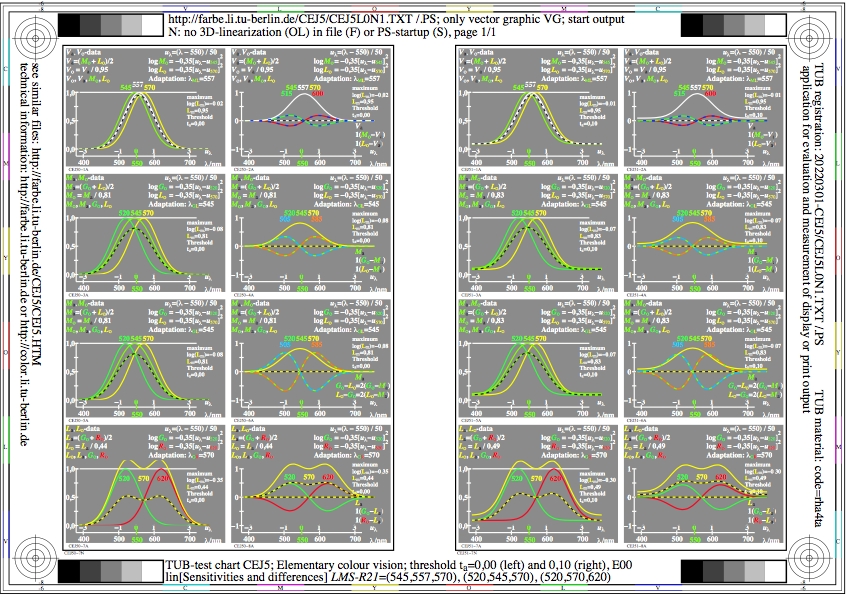
Figure CEJ5L0N1.jpg: Output in format A6 of the file
CEJ5L0NP.PDF, see
CEJ5L0N1.
PS /
TXT /
PDF /
jpg
CEJ5: TUB-test chart CEJ5; Relative colour vision LMS-R21
lin-sensitivity, lin-difference, threshold=0,10, E00
Systems: (545,557,570), (520,545,570), (520,570,620)

Figure CEJ6L0N1.jpg: Output in format A6 of the file
CEJ6L0NP.PDF, see
CEJ6L0N1.
PS /
TXT /
PDF /
jpg
CEJ6: TUB-test chart CEJ6; Relative colour vision LMS-R21
lin-sensitivity, lin-difference, threshold=0,10, E00
Systems: (545,557,570), (495,520,545), (520,570,620)

Figure CEJ7L0N1.jpg: Output in format A6 of the file
CEJ7L0NP.PDF, see
CEJ7L0N1.
PS /
TXT /
PDF /
jpg
CEJ7: TUB-test chart CEJ7; Relative colour vision LMS-R21
lin-sensitivity, lin-difference, threshold=0,10, E00
Systems: (545,557,570), (470,495,520), (520,570,620)
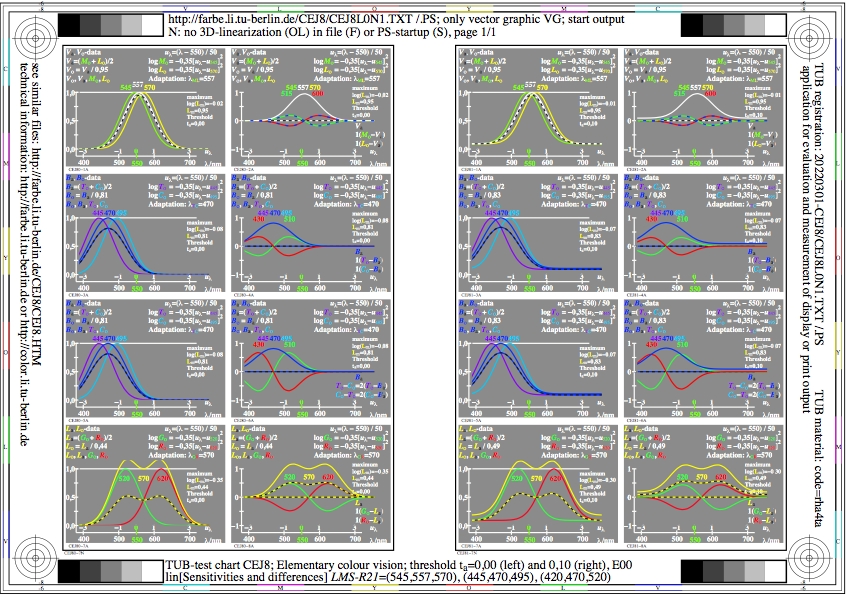
Figure CEJ8L0N1.jpg: Output in format A6 of the file
CEJ8L0NP.PDF, see
CEJ8L0N1.
PS /
TXT /
PDF /
jpg
CEJ8: TUB-test chart CEJ8; Relative colour vision LMS-R21
lin-sensitivity, lin-difference, threshold=0,10, E00
Systems: (545,557,570), (445,470,495), (520,570,620)

Figure CEJ9L0N1.jpg: Output in format A6 of the file
CEJ9L0NP.PDF, see
CEJ9L0N1.
PS /
TXT /
PDF /
jpg
CEJ9: TUB-test chart CEJ9; Relative colour vision LMS-R21
lin-sensitivity, lin-difference, threshold=0,10, E00
Systems: (545,557,570), (420,445,470), (520,570,620)

Figure CEK0L0N1.jpg: Output in format A6 of the file
CEK0L0NP.PDF, see
CEK0L0N1.
PS /
TXT /
PDF /
jpg
CEK0: TUB-test chart CEK0; Relative colour vision LMS-R21
log-sensitivity, log-difference, threshold=0,10, E00, BL
Systems: (545,557,570), (545,570,595), (520,570,620)

Figure CEK1L0N1.jpg: Output in format A6 of the file
CEK1L0NP.PDF, see
CEK1L0N1.
PS /
TXT /
PDF /
jpg
CEK1: TUB-test chart CEK1; Relative colour vision LMS-R21
log-sensitivity, log-difference, threshold=0,10, E00, BL
Systems: (545,557,570), (495,520,545), (520,570,620)
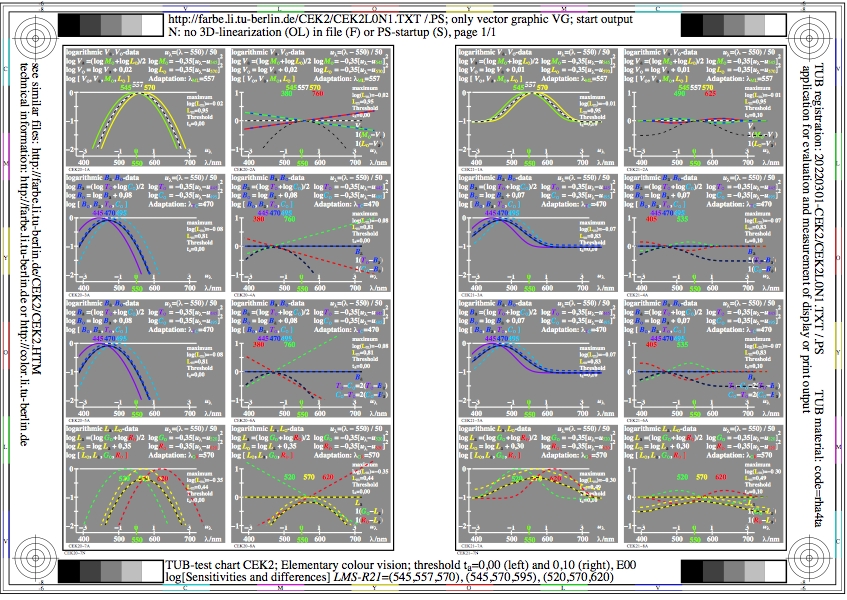
Figure CEK2L0N1.jpg: Output in format A6 of the file
CEK2L0NP.PDF, see
CEK2L0N1.
PS /
TXT /
PDF /
jpg
CEK2: TUB-test chart CEK2; Relative colour vision LMS-R21
log-sensitivity, log-difference, threshold=0,10, E00, BL
Systems: (545,557,570), (445,470,495), (520,570,620)

Figure CEK3L0N1.jpg: Output in format A6 of the file
CEK3L0NP.PDF, see
CEK3L0N1.
PS /
TXT /
PDF /
jpg
CEK3: TUB-test chart CEK3; Relative colour vision LMS-R21
log-sensitivity, log-difference, threshold=0,10, E00
Systems: (545,557,570), (570,595,620), (520,570,620)
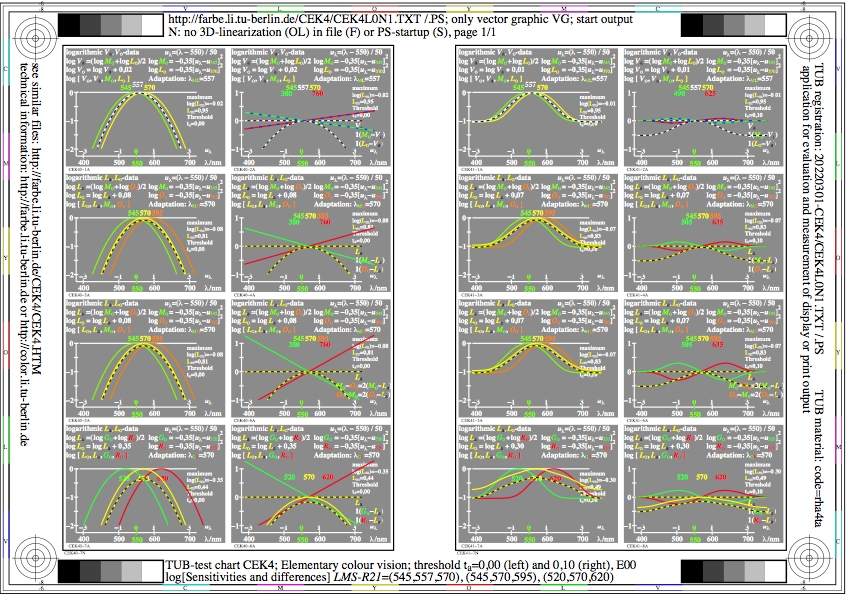
Figure CEK4L0N1.jpg: Output in format A6 of the file
CEK4L0NP.PDF, see
CEK4L0N1.
PS /
TXT /
PDF /
jpg
CEK4: TUB-test chart CEK4; Relative colour vision LMS-R21
log-sensitivity, log-difference, threshold=0,10, E00
Systems: (545,557,570), (545,570,595), (520,570,620)

Figure CEK5L0N1.jpg: Output in format A6 of the file
CEK5L0NP.PDF, see
CEK5L0N1.
PS /
TXT /
PDF /
jpg
CEK5: TUB-test chart CEK5; Relative colour vision LMS-R21
log-sensitivity, log-difference, threshold=0,10, E00
Systems: (545,557,570), (520,545,570), (520,570,620)
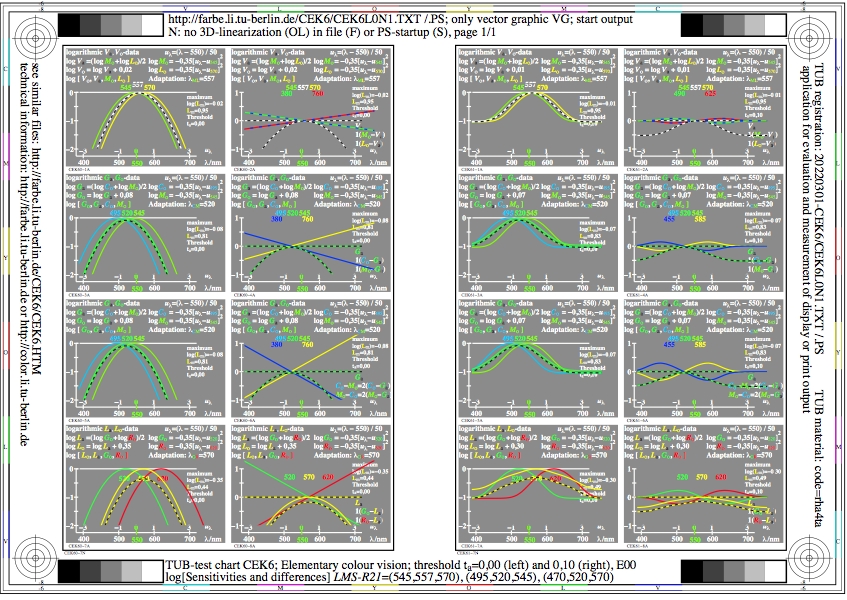
Figure CEK6L0N1.jpg: Output in format A6 of the file
CEK6L0NP.PDF, see
CEK6L0N1.
PS /
TXT /
PDF /
jpg
CEK6: TUB-test chart CEK6; Relative colour vision LMS-R21
log-sensitivity, log-difference, threshold=0,10, E00
Systems: (545,557,570), (495,520,545), (520,570,620)
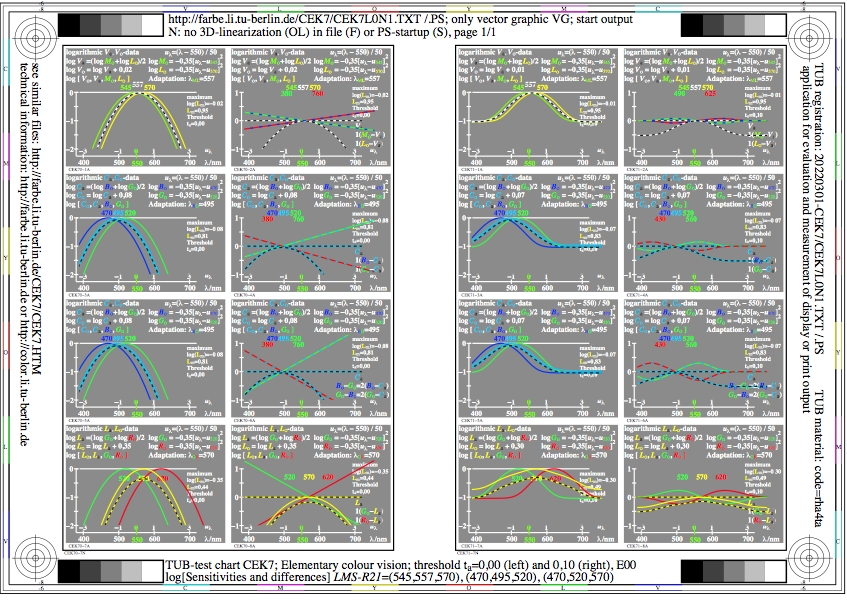
Figure CEK7L0N1.jpg: Output in format A6 of the file
CEK7L0NP.PDF, see
CEK7L0N1.
PS /
TXT /
PDF /
jpg
CEK7: TUB-test chart CEK7; Relative colour vision LMS-R21
log-sensitivity, log-difference, threshold=0,10, E00
Systems: (545,557,570), (470,495,520), (520,570,620)
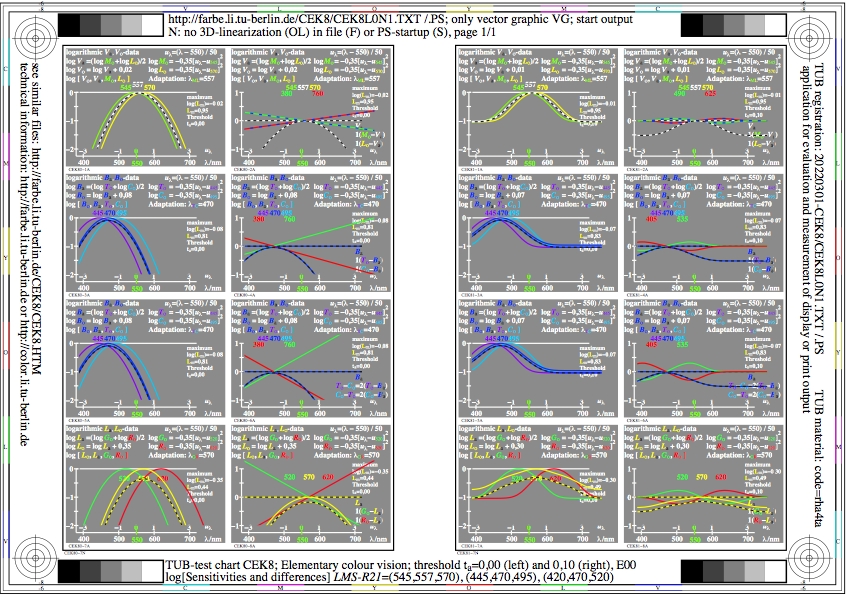
Figure CEK8L0N1.jpg: Output in format A6 of the file
CEK8L0NP.PDF, see
CEK8L0N1.
PS /
TXT /
PDF /
jpg
CEK8: TUB-test chart CEK8; Relative colour vision LMS-R21
log-sensitivity, log-difference, threshold=0,10, E00
Systems: (545,557,570), (445,470,495), (520,570,620)
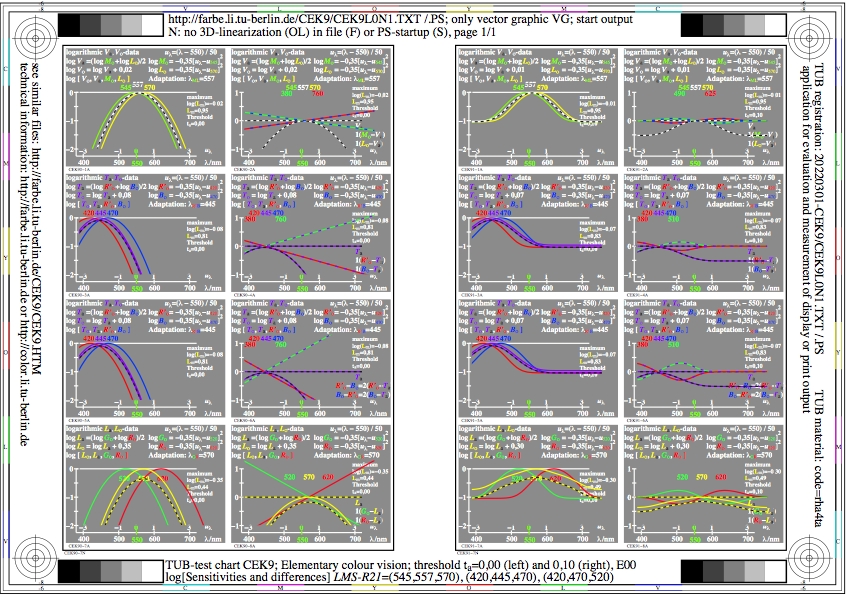
Figure CEK9L0N1.jpg: Output in format A6 of the file
CEK9L0NP.PDF, see
CEK9L0N1.
PS /
TXT /
PDF /
jpg
CEK9: TUB-test chart CEK9; Relative colour vision LMS-R21
log-sensitivity, log-difference, threshold=0,10, E00
Systems: (545,557,570), (420,445,470), (520,570,620)

Figure CEL0L0N1.jpg: Output in format A6 of the file
CEL0L0NP.PDF, see
CEL0L0N1.
PS /
TXT /
PDF /
jpg
CEL0: TUB-test chart CEL0; Relative colour vision LMS-R21
log-sensitivity, lin-difference, threshold=0,10, E00, BL
Systems: (545,557,570), (545,570,595), (520,570,620)
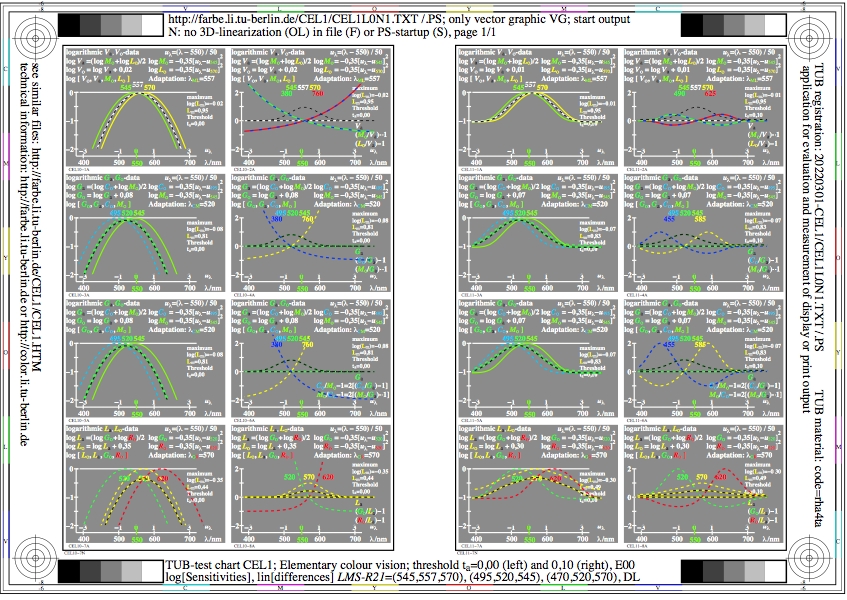
Figure CEL1L0N1.jpg: Output in format A6 of the file
CEL1L0NP.PDF, see
CEL1L0N1.
PS /
TXT /
PDF /
jpg
CEL1: TUB-test chart CEL1; Relative colour vision LMS-R21
log-sensitivity, lin-difference, threshold=0,10, E00, BL
Systems: (545,557,570), (495,520,545), (520,570,620)
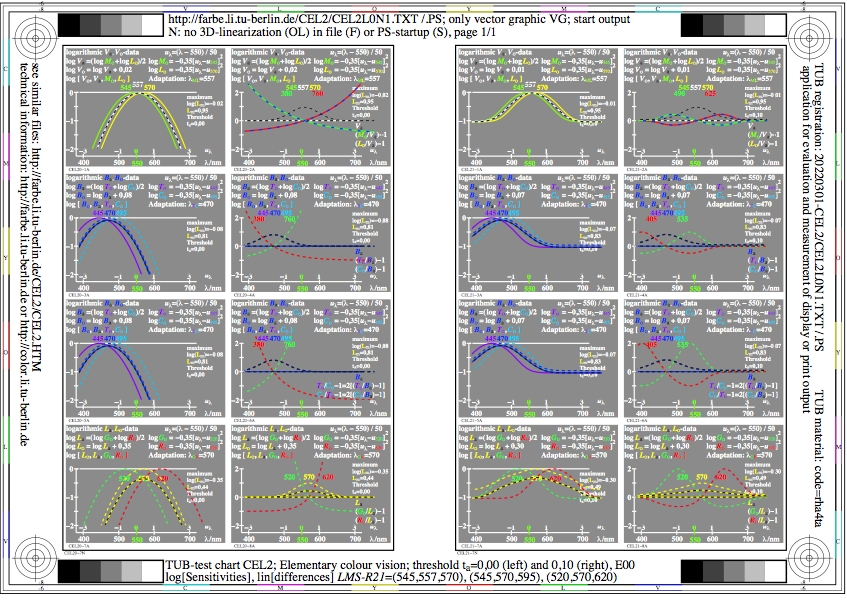
Figure CEL2L0N1.jpg: Output in format A6 of the file
CEL2L0NP.PDF, see
CEL2L0N1.
PS /
TXT /
PDF /
jpg
CEL2: TUB-test chart CEL2; Relative colour vision LMS-R21
log-sensitivity, lin-difference, threshold=0,10, E00, BL
Systems: (545,557,570), (445,470,495), (520,570,620)
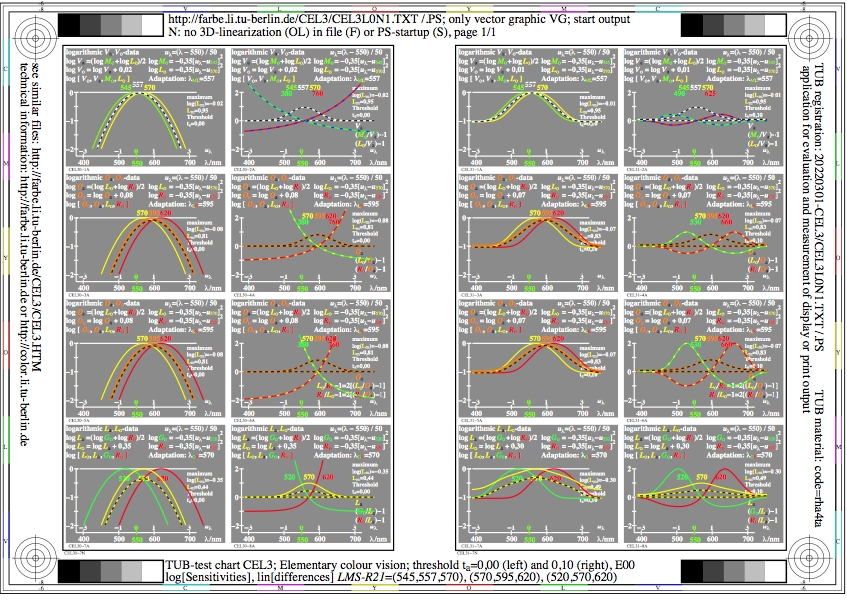
Figure CEL3L0N1.jpg: Output in format A6 of the file
CEL3L0NP.PDF, see
CEL3L0N1.
PS /
TXT /
PDF /
jpg
CEL3: TUB-test chart CEL3; Relative colour vision LMS-R21
log-sensitivity, lin-difference, threshold=0,10, E00
Systems: (545,557,570), (570,595,620), (520,570,620)
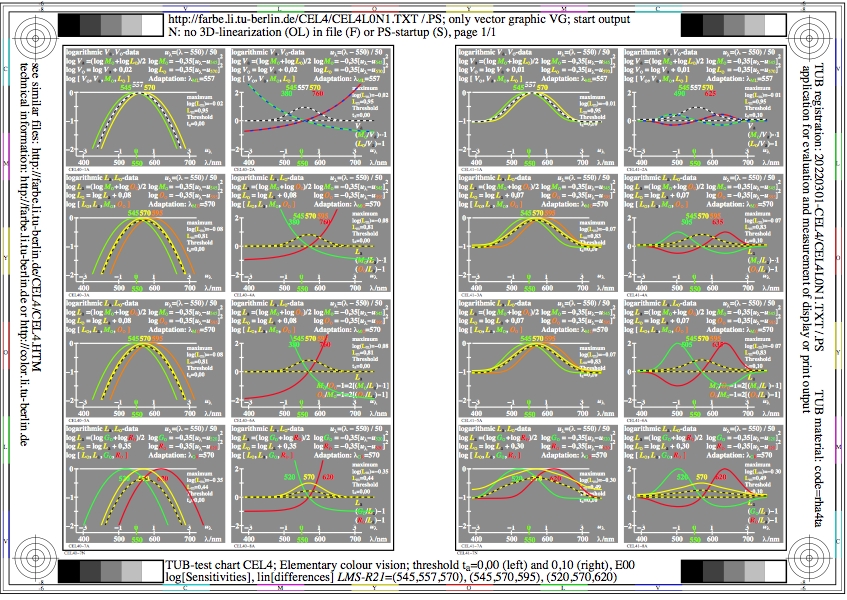
Figure CEL4L0N1.jpg: Output in format A6 of the file
CEL4L0NP.PDF, see
CEL4L0N1.
PS /
TXT /
PDF /
jpg
CEL4: TUB-test chart CEL4; Relative colour vision LMS-R21
log-sensitivity, lin-difference, threshold=0,10, E00
Systems: (545,557,570), (545,570,595), (520,570,620)

Figure CEL5L0N1.jpg: Output in format A6 of the file
CEL5L0NP.PDF, see
CEL5L0N1.
PS /
TXT /
PDF /
jpg
CEL5: TUB-test chart CEL5; Relative colour vision LMS-R21
log-sensitivity, lin-difference, threshold=0,10, E00
Systems: (545,557,570), (520,545,570), (520,570,620)

Figure CEL6L0N1.jpg: Output in format A6 of the file
CEL6L0NP.PDF, see
CEL6L0N1.
PS /
TXT /
PDF /
jpg
CEL6: TUB-test chart CEL6; Relative colour vision LMS-R21
log-sensitivity, lin-difference, threshold=0,10, E00
Systems: (545,557,570), (495,520,545), (520,570,620)
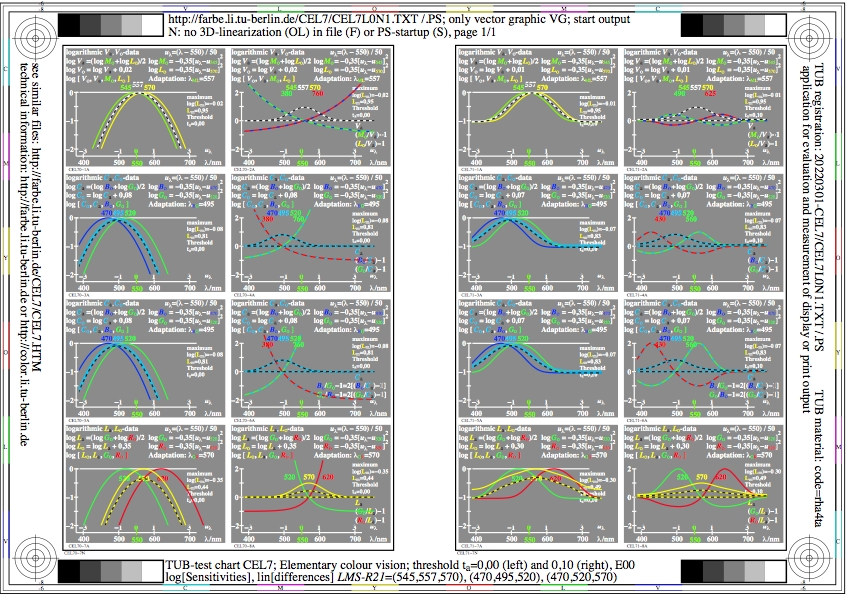
Figure CEL7L0N1.jpg: Output in format A6 of the file
CEL7L0NP.PDF, see
CEL7L0N1.
PS /
TXT /
PDF /
jpg
CEL7: TUB-test chart CEL7; Relative colour vision LMS-R21
log-sensitivity, lin-difference, threshold=0,10, E00
Systems: (545,557,570), (470,495,520), (520,570,620)
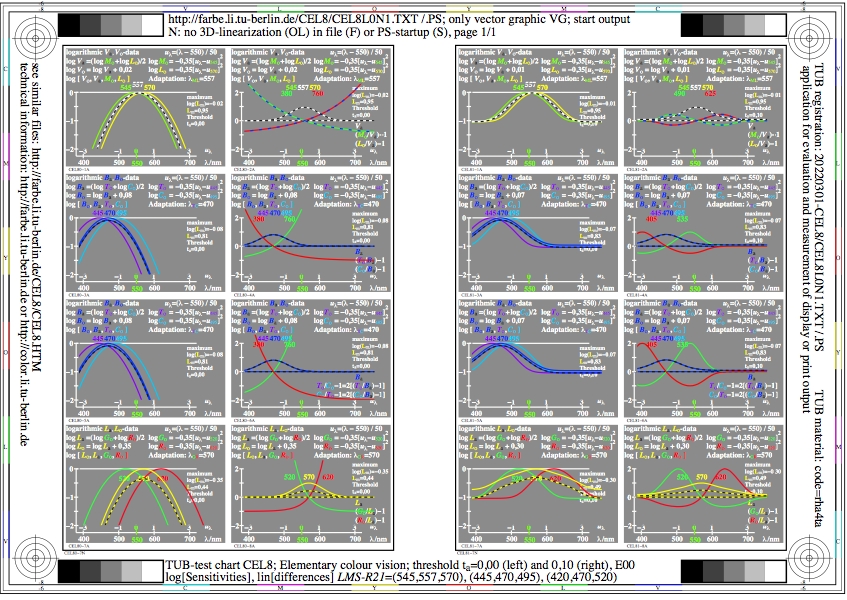
Figure CEL8L0N1.jpg: Output in format A6 of the file
CEL8L0NP.PDF, see
CEL8L0N1.
PS /
TXT /
PDF /
jpg
CEL8: TUB-test chart CEL8; Relative colour vision LMS-R21
log-sensitivity, lin-difference, threshold=0,10, E00
Systems: (545,557,570), (445,470,495), (520,570,620)

Figure CEL9L0N1.jpg: Output in format A6 of the file
CEL9L0NP.PDF, see
CEL9L0N1.
PS /
TXT /
PDF /
jpg
CEL9: TUB-test chart CEL9; Relative colour vision LMS-R21
log-sensitivity, lin-difference, threshold=0,10, E00
Systems: (545,557,570), (420,445,470), (520,570,620)

Figure CEM0L0N1.jpg: Output in format A6 of the file
CEM0L0NP.PDF, see
CEM0L0N1.
PS /
TXT /
PDF /
jpg
CEM0: TUB-Test chart CEM0; CIE 02-degree colorimetry
HPE-Cone sensitivity, hue translation, and spectral
tristimulus values only for CIE illuminant D65; linear data

Figure CEM1L0N1.jpg: Output in format A6 of the file
CEM1L0NP.PDF, see
CEM1L0N1.
PS /
TXT /
PDF /
jpg
CEM1: TUB-Test chart CEM1; CIE 10-degree colorimetry
HPE-CIE Cone sensitivity, hue translation, and spectral
tristimulus values only for CIE illuminant D65; linear data

Figure CEM2L0N1.jpg: Output in format A6 of the file
CEM2L0NP.PDF, see
CEM2L0N1.
PS /
TXT /
PDF /
jpg
CEM2: TUB-Test chart CEM2; CIE 02-degree colorimetry
HPE-Cone sensitivity, hue translation, and spectral
tristimulus values only for CIE illuminant E00; linear data
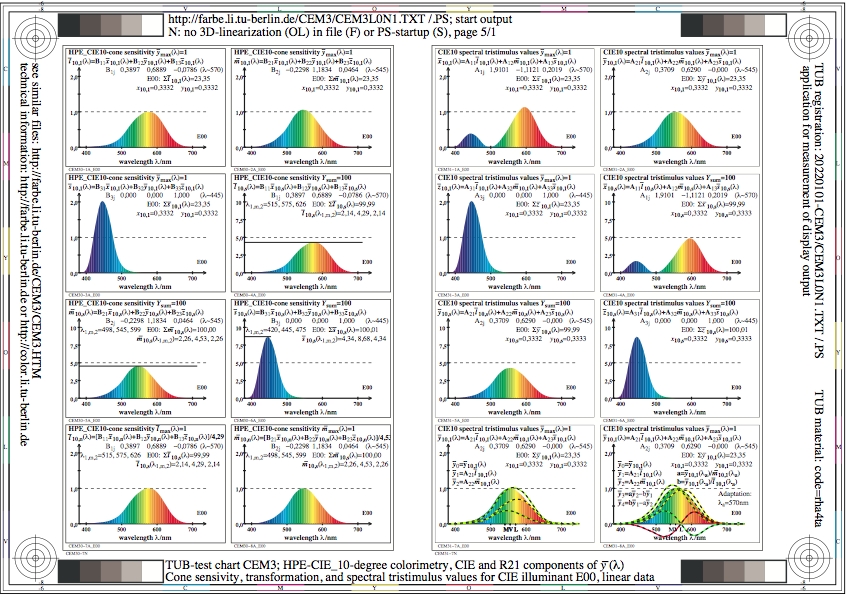
Figure CEM3L0N1.jpg: Output in format A6 of the file
CEM3L0NP.PDF, see
CEM3L0N1.
PS /
TXT /
PDF /
jpg
CEM3: TUB-Test chart CEM3; CIE 10-degree colorimetry
HPE-CIE Cone sensitivity, hue translation, and spectral
tristimulus values only for CIE illuminant E00; linear data
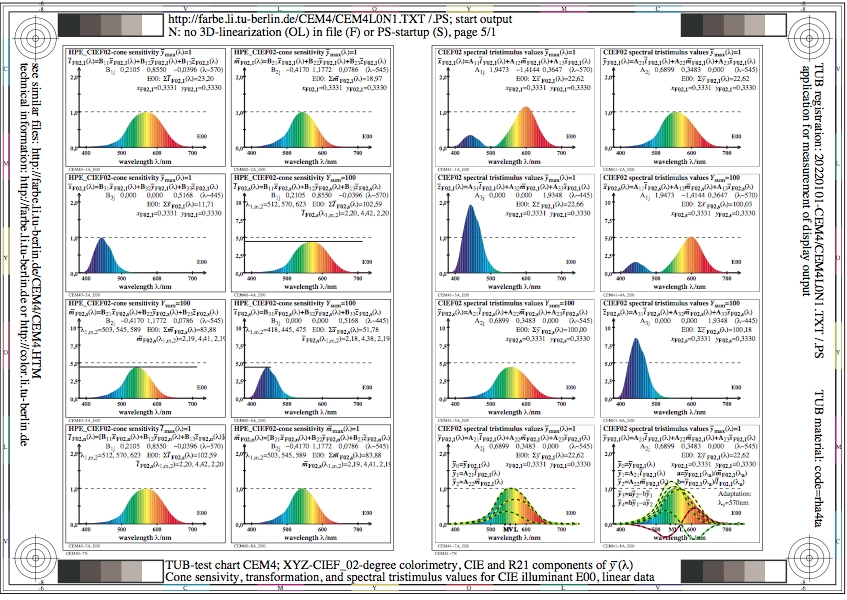
Figure CEM4L0N1.jpg: Output in format A6 of the file
CEM4L0NP.PDF, see
CEM4L0N1.
PS /
TXT /
PDF /
jpg
CEM4: TUB-Test chart CEM4; CIE F02-degree colorimetry
HPE-Cone sensitivity, hue translation, and spectral
tristimulus values only for CIE illuminant E00; linear data
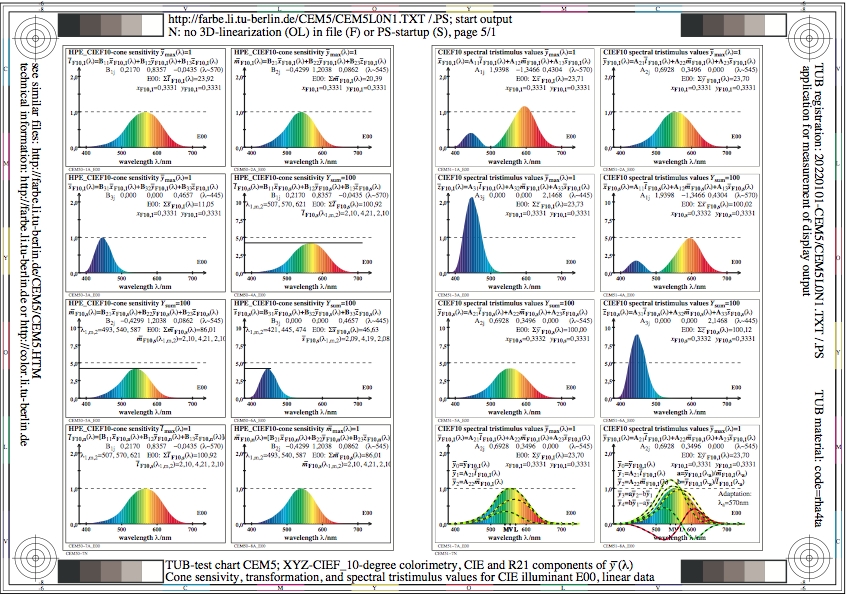
Figure CEM5L0N1.jpg: Output in format A6 of the file
CEM5L0NP.PDF, see
CEM5L0N1.
PS /
TXT /
PDF /
jpg
CEM5: TUB-Test chart CEM5; CIE F10-degree colorimetry
HPE-Cone sensitivity, hue translation, and spectral
tristimulus values only for CIE illuminant E00; linear data

Figure CEM6L0N1.jpg: Output in format A6 of the file
CEM6L0NP.PDF, see
CEM6L0N1.
PS /
TXT /
PDF /
jpg
CEM6: TUB-Test chart CEM6; CIE 02-degree colorimetry
HPE-Cone sensitivity, hue translation, and spectral
tristimulus values only for CIE illuminants D50; linear data

Figure CEM7L0N1.jpg: Output in format A6 of the file
CEM7L0NP.PDF, see
CEM7L0N1.
PS /
TXT /
PDF /
jpg
CEM7: TUB-Test chart CEM7; CIE 10-degree colorimetry
HPE-CIE Cone sensitivity, hue translation, and spectral
tristimulus values only for CIE illuminant D50; linear data
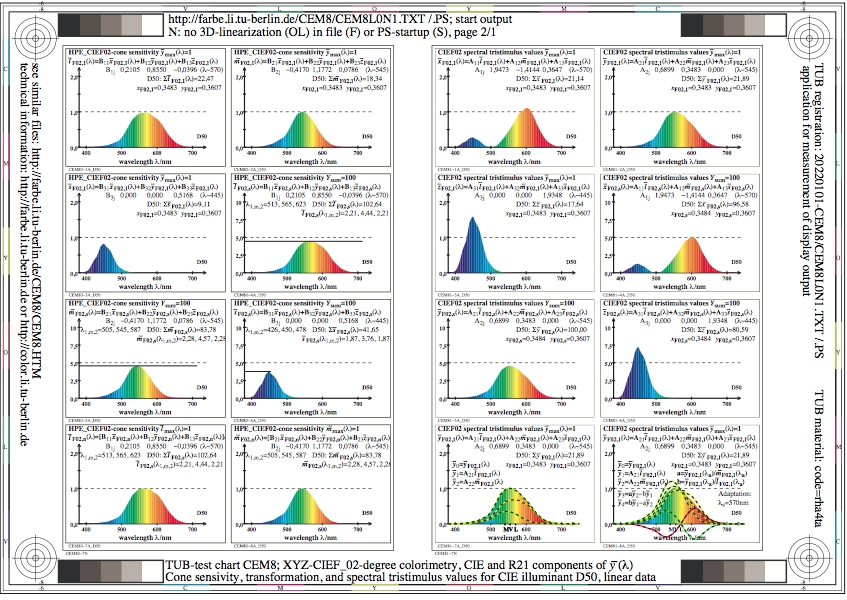
Figure CEM8L0N1.jpg: Output in format A6 of the file
CEM8L0NP.PDF, see
CEM8L0N1.
PS /
TXT /
PDF /
jpg
CEM8: TUB-Test chart CEM8; CIE F02-degree colorimetry
HPE-Cone sensitivity, hue translation, and spectral
tristimulus values only for CIE illuminant D50; linear data
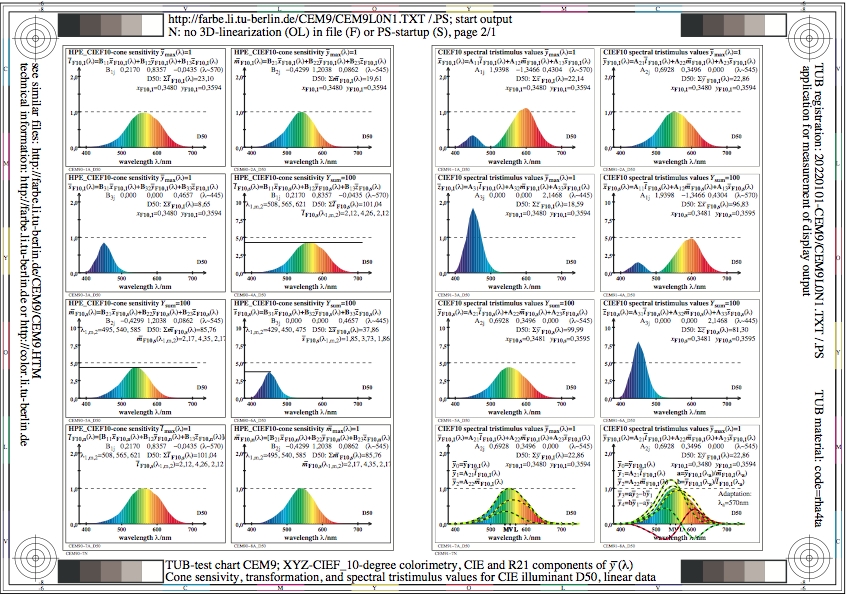
Figure CEM9L0N1.jpg: Output in format A6 of the file
CEM9L0NP.PDF, see
CEM9L0N1.
PS /
TXT /
PDF /
jpg
CEM9: TUB-Test chart CEM9; CIE F10-degree colorimetry
HPE-Cone sensitivity, hue translation, and spectral
tristimulus values only for CIE illuminant D50; linear data

Figure CEN0L0N1.jpg: Output in format A6 of the file
CEN0L0NP.PDF, see
CEN0L0N1.
PS /
TXT /
PDF /
jpg
CEN0: TUB-Test chart CEN0; CIE F02-degree colorimetry
HPE-Cone sensitivity, hue translation, and spectral
tristimulus values only for CIE illuminant D65; linear data

Figure CEN1L0N1.jpg: Output in format A6 of the file
CEN1L0NP.PDF, see
CEN1L0N1.
PS /
TXT /
PDF /
jpg
CEN1: TUB-Test chart CEN1; CIE F10-degree colorimetry
HPE-CIE Cone sensitivity, hue translation, and spectral
tristimulus values only for CIE illuminant D65; linear data

Figure CEN2L0N1.jpg: Output in format A6 of the file
CEN2L0NP.PDF, see
CEN2L0N1.
PS /
TXT /
PDF /
jpg
CEN2: TUB-Test chart CEN2; CIE 02-degree colorimetry
HPE-Cone sensitivity, hue translation, and spectral
tristimulus values only for CIE illuminant P00; linear data

Figure CEN3L0N1.jpg: Output in format A6 of the file
CEN3L0NP.PDF, see
CEN3L0N1.
PS /
TXT /
PDF /
jpg
CEN3: TUB-Test chart CEN3; CIE 10-degree colorimetry
HPE-CIE Cone sensitivity, hue translation, and spectral
tristimulus values only for CIE illuminant P00; linear data

Figure CEN4L0N1.jpg: Output in format A6 of the file
CEN4L0NP.PDF, see
CEN4L0N1.
PS /
TXT /
PDF /
jpg
CEN4: TUB-Test chart CEN4; CIE F02-degree colorimetry
HPE-Cone sensitivity, hue translation, and spectral
tristimulus values only for CIE illuminant P00; linear data
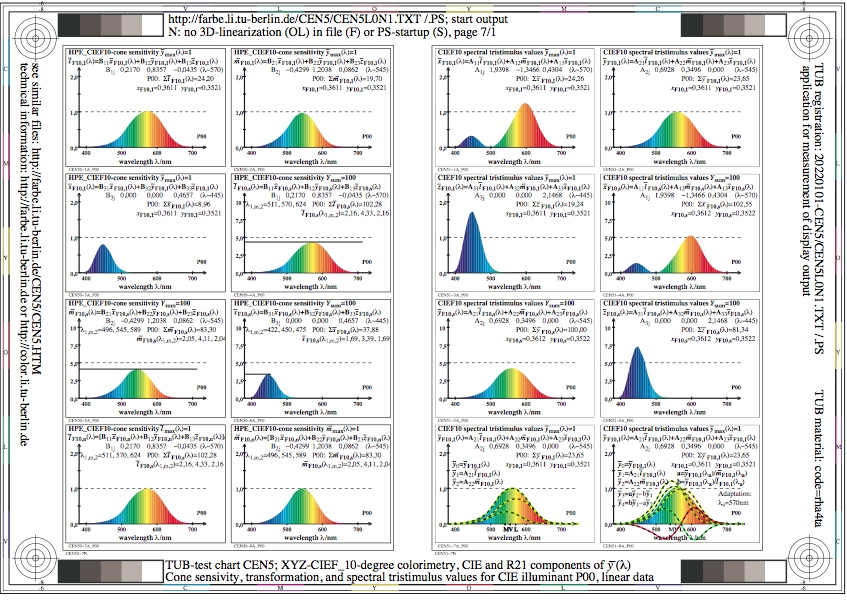
Figure CEN5L0N1.jpg: Output in format A6 of the file
CEN5L0NP.PDF, see
CEN5L0N1.
PS /
TXT /
PDF /
jpg
CEN5: TUB-Test chart CEN5; CIE F10-degree colorimetry
HPE-Cone sensitivity, hue translation, and spectral
tristimulus values only for CIE illuminant P00; linear data
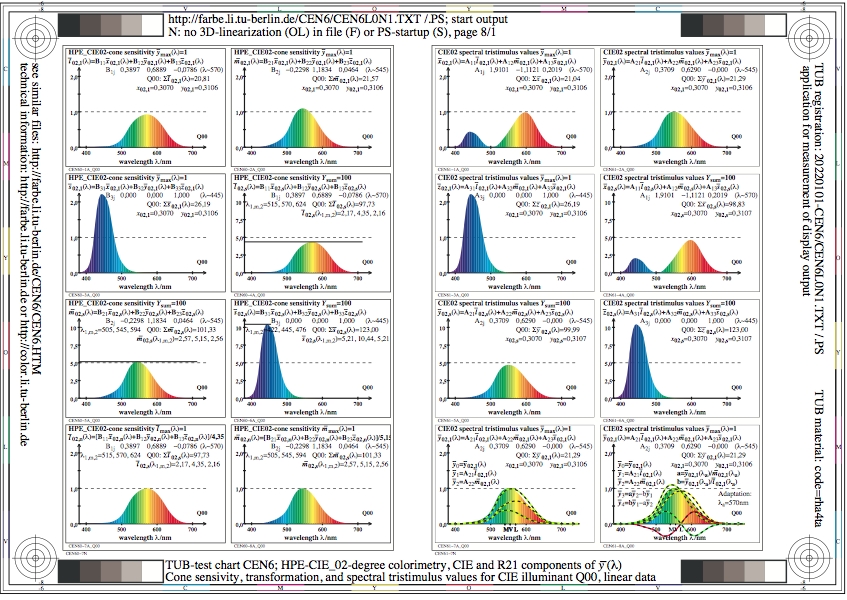
Figure CEN6L0N1.jpg: Output in format A6 of the file
CEN6L0NP.PDF, see
CEN6L0N1.
PS /
TXT /
PDF /
jpg
CEN6: TUB-Test chart CEN6; CIE 02-degree colorimetry
HPE-Cone sensitivity, hue translation, and spectral
tristimulus values only for CIE illuminants Q00; linear data
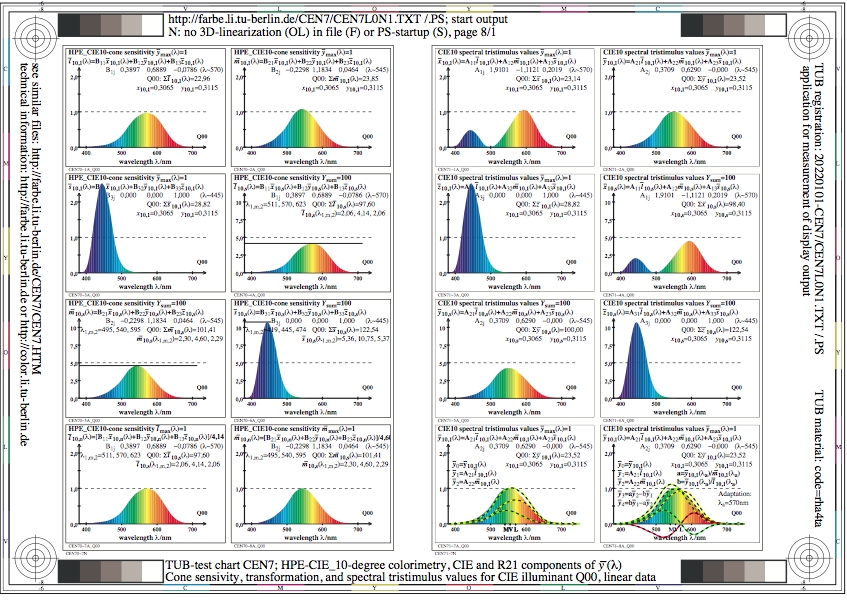
Figure CEN7L0N1.jpg: Output in format A6 of the file
CEN7L0NP.PDF, see
CEN7L0N1.
PS /
TXT /
PDF /
jpg
CEN7: TUB-Test chart CEN7; CIE 10-degree colorimetry
HPE-CIE Cone sensitivity, hue translation, and spectral
tristimulus values only for CIE illuminant Q00; linear data

Figure CEN8L0N1.jpg: Output in format A6 of the file
CEN8L0NP.PDF, see
CEN8L0N1.
PS /
TXT /
PDF /
jpg
CEN8: TUB-Test chart CEN8; CIE F02-degree colorimetry
HPE-Cone sensitivity, hue translation, and spectral
tristimulus values only for CIE illuminant Q00; linear data

Figure CEN9L0N1.jpg: Output in format A6 of the file
CEN9L0NP.PDF, see
CEN9L0N1.
PS /
TXT /
PDF /
jpg
CEN9: TUB-Test chart CEN9; CIE F10-degree colorimetry
HPE-Cone sensitivity, hue translation, and spectral
tristimulus values only for CIE illuminant Q00; linear data

Figure CEO0L0N1.jpg: Output in format A6 of the file
CEO0L0NP.PDF, see
CEO0L0N1.
PS /
TXT /
PDF /
jpg
CEO0: TUB-Test chart CEO0; CIE F02-degree colorimetry
LMS-CIE-Cone sensitivity, hue translation, and spectral
CIE/R21-tristimulus-value translation CIE E00; linear data

Figure CEO1L0N1.jpg: Output in format A6 of the file
CEO1L0NP.PDF, see
CEO1L0N1.
PS /
TXT /
PDF /
jpg
CEO1: TUB-Test chart CEO1; CIE F10-degree colorimetry
LMS-CIE-Cone sensitivity, hue translation, and spectral
CIE/R21-tristimulus value translation CIE E00; linear data
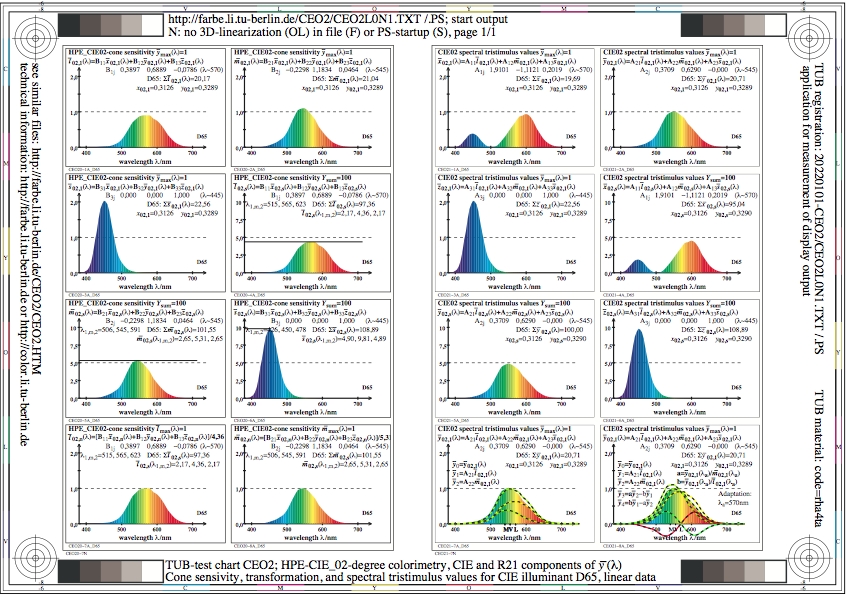
Figure CEO2L0N1.jpg: Output in format A6 of the file
CEO2L0NP.PDF, see
CEO2L0N1.
PS /
TXT /
PDF /
jpg
CEO2: TUB-Test chart CEO2; CIE 02-degree colorimetry
HPE-CIE-Cone sensitivity, hue translation, and spectral
tristimulus values for 8 illuminants Dxx; linear data

Figure CEO3L0N1.jpg: Output in format A6 of the file
CEO3L0NP.PDF, see
CEO3L0N1.
PS /
TXT /
PDF /
jpg
CEO3: TUB-Test chart CEO3; CIE 10-degree colorimetry
HPE-CIE-Cone sensitivity, hue translation, and spectral
tristimulus values for 8 illuminants Dxx; linear data
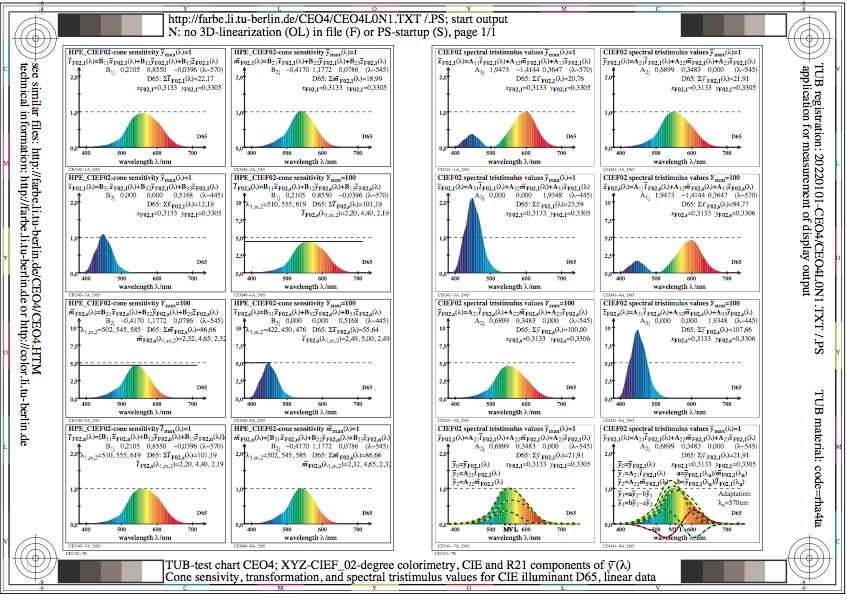
Figure CEO4L0N1.jpg: Output in format A6 of the file
CEO4L0NP.PDF, see
CEO4L0N1.
PS /
TXT /
PDF /
jpg
CEO4: TUB-Test chart CEO4; CIE F02-degree colorimetry
LMS-CIE-Cone sensitivity, hue translation, and spectral
tristimulus values for 8 illuminants Dxx; linear data

Figure CEO5L0N1.jpg: Output in format A6 of the file
CEO5L0NP.PDF, see
CEO5L0N1.
PS /
TXT /
PDF /
jpg
CEO5: TUB-Test chart CEO5; CIE F10-degree colorimetry
LMS-CIE-Cone sensitivity, hue translation, and spectral
tristimulus values for 8 illuminants Dxx; linear data

Figure CEO6L0N1.jpg: Output in format A6 of the file
CEO6L0NP.PDF, see
CEO6L0N1.
PS /
TXT /
PDF /
jpg
CEO6: TUB-Test chart CEO6; CIE 02-degree colorimetry
HPE-CIE-Cone sensitivity, hue translation, and spectral
tristimulus values for 8 illuminants Pxx; linear data
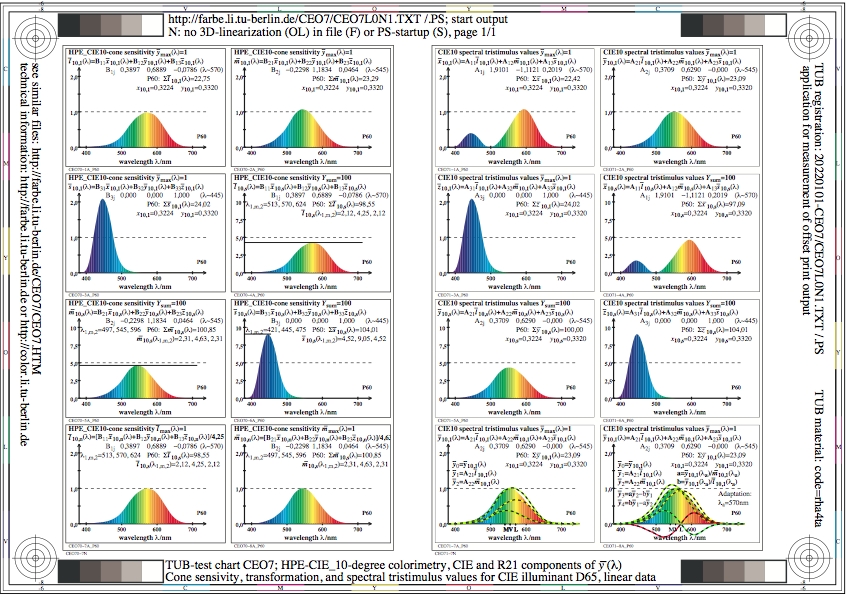
Figure CEO7L0N1.jpg: Output in format A6 of the file
CEO7L0NP.PDF, see
CEO7L0N1.
PS /
TXT /
PDF /
jpg
CEO7: TUB-Test chart CEO7; CIE 10-degree colorimetry
HPE-CIE-Cone sensitivity, hue translation, and spectral
tristimulus values for 8 illuminants Pxx; linear data
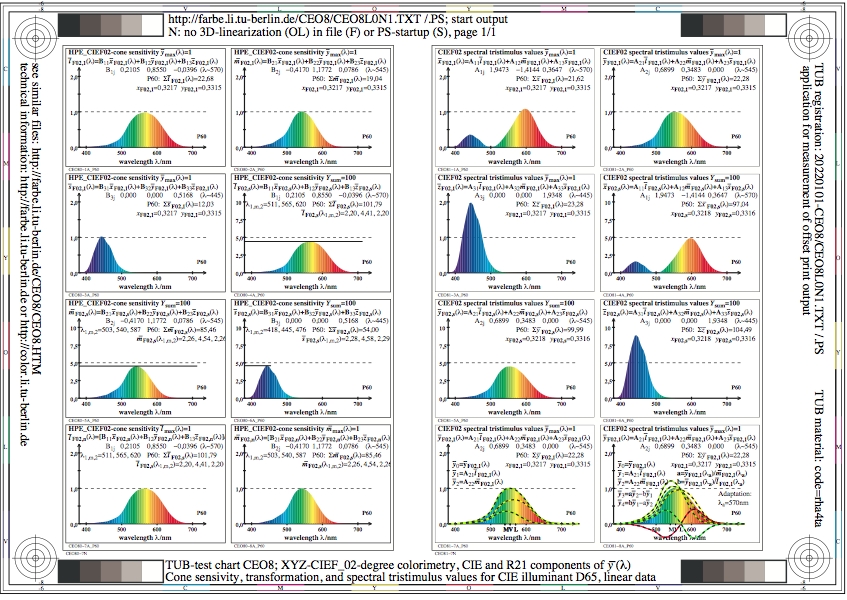
Figure CEO8L0N1.jpg: Output in format A6 of the file
CEO8L0NP.PDF, see
CEO8L0N1.
PS /
TXT /
PDF /
jpg
CEO8: TUB-Test chart CEO8; CIE F02-degree colorimetry
LMS-CIE-Cone sensitivity, hue translation, and spectral
tristimulus values for 8 illuminants Pxx; linear data
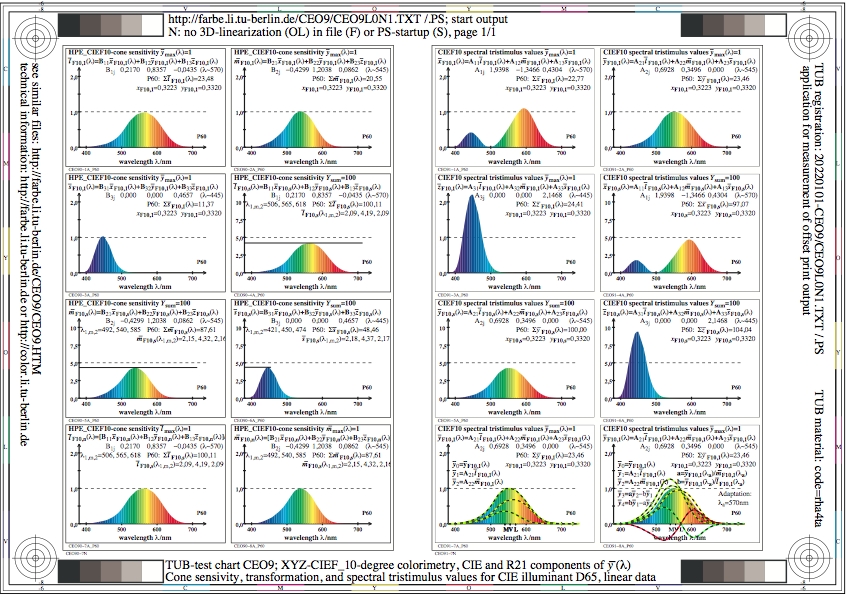
Figure CEO9L0N1.jpg: Output in format A6 of the file
CEO9L0NP.PDF, see
CEO9L0N1.
PS /
TXT /
PDF /
jpg
CEO9: TUB-Test chart CEO9; CIE F10-degree colorimetry
LMS-CIE-Cone sensitivity, hue translation, and spectral
tristimulus values for 8 illuminants Pxx; linear data
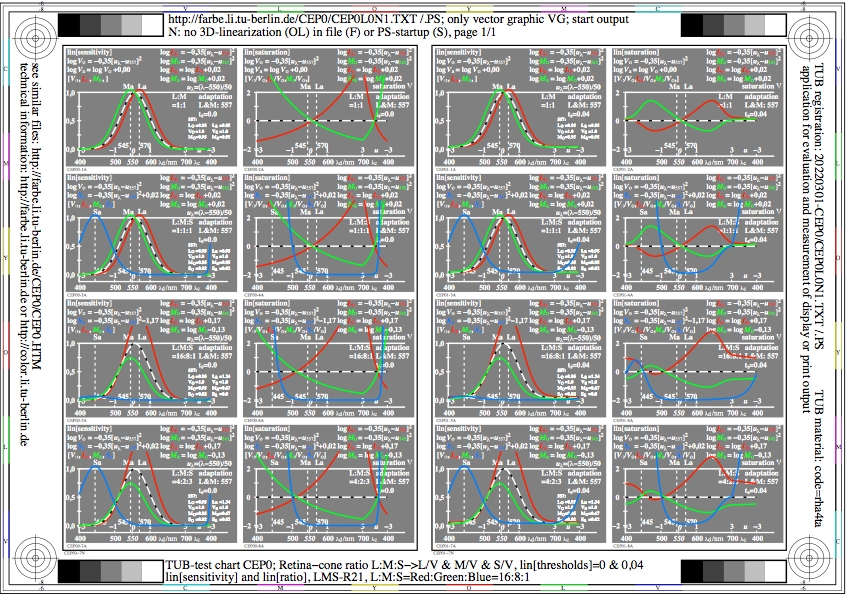
Figure CEP0L0N1.jpg: Output in format A6 of the file
CEP0L0NP.PDF, see
CEP0L0N1.
PS /
TXT /
PDF /
jpg
CEP0: TUB-test chart CEQ0; LMS-R21-colour vision modell
cone ratio red:green:blue=16:8:1
log[sensitivity], log[ratio], lin[threshold]=0&0,04
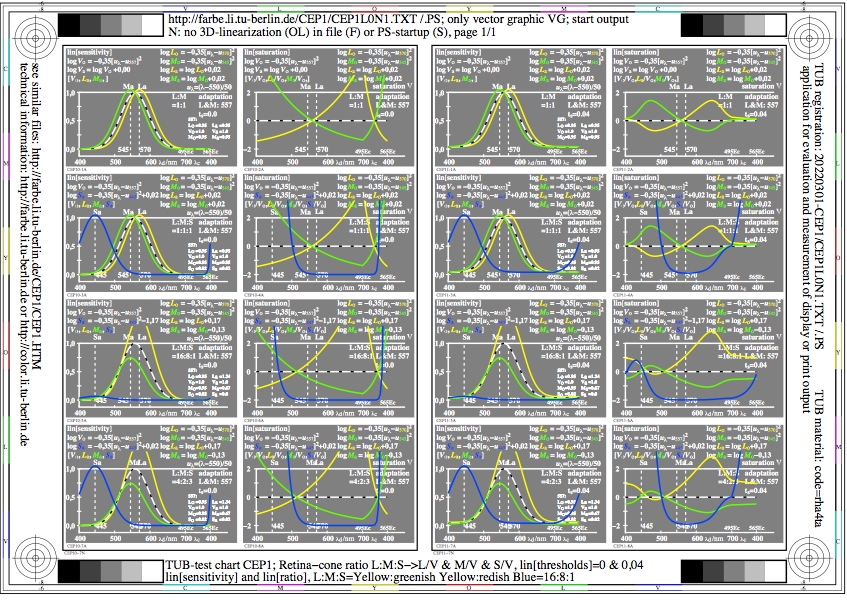
Figure CEP1L0N1.jpg: Output in format A6 of the file
CEP1L0NP.PDF, see
CEP1L0N1.
PS /
TXT /
PDF /
jpg
CEP1: TUB-test chart CEQ1; LMS-R21-colour vision modell
cone ratio yellow:greenish yellow:reddish blue=16:8:1
log[sensitivity], log[ratio], lin[threshold]=0&0,04
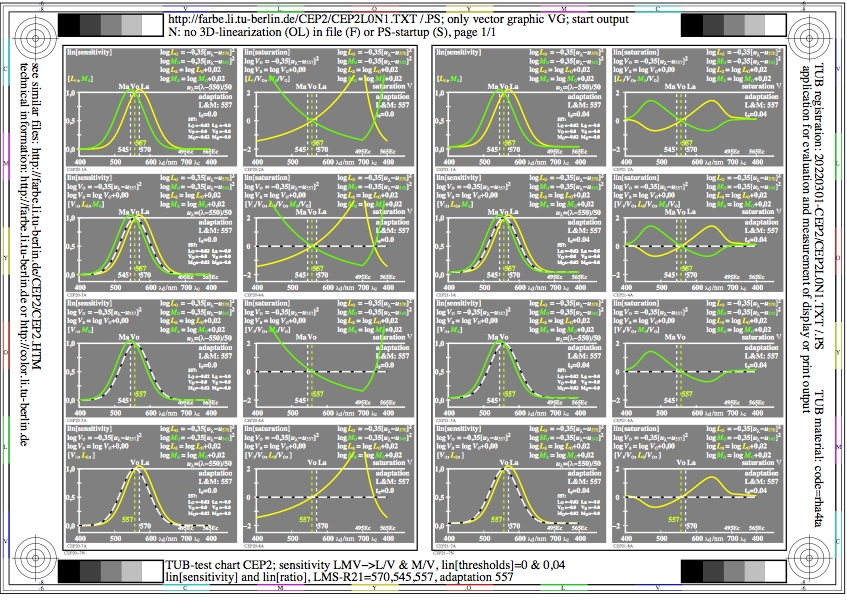
Figure CEP2L0N1.jpg: Output in format A6 of the file
CEP2L0NP.PDF, see
CEP2L0N1.
PS /
TXT /
PDF /
jpg
CEP2: TUB-test chart CEQ2; LMS-R21-colour vision modell
sensitivity 570,557,545, LMV->L/V&M/V, adaptation 557
log[sensitivity], log[ratio], lin[threshold]=0&0,04

Figure CEP3L0N1.jpg: Output in format A6 of the file
CEP3L0NP.PDF, see
CEP3L0N1.
PS /
TXT /
PDF /
jpg
CEP3: TUB-test chart CEQ3; LMS-R21-colour vision modell
sensitivity 595,570,545, OLM->O/L&M/L, adaptation 570
log[sensitivity], log[ratio], lin[threshold]=0&0,04
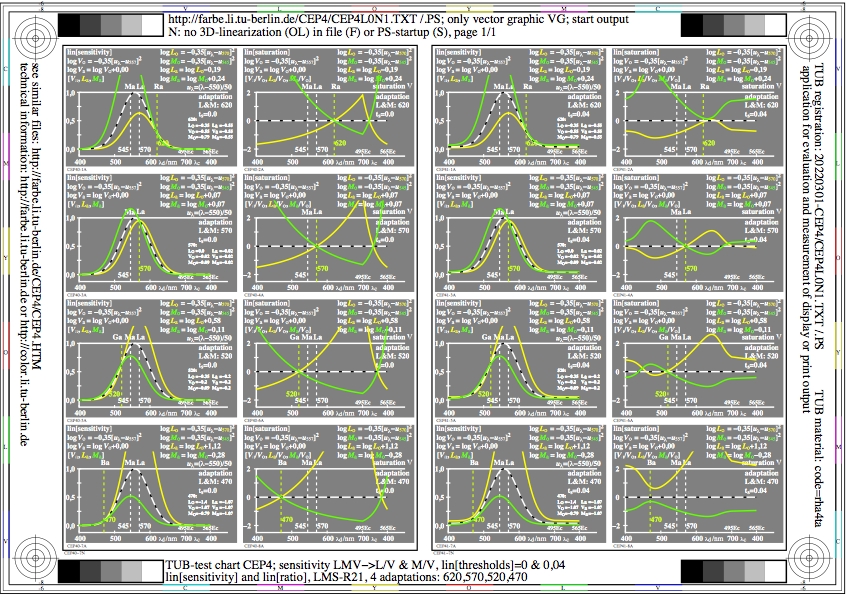
Figure CEP4L0N1.jpg: Output in format A6 of the file
CEP4L0NP.PDF, see
CEP4L0N1.
PS /
TXT /
PDF /
jpg
CEP4: TUB-test chart CEQ4; LMS-R21-colour vision modell
sensitivity LMV->L/V&M/V, 4 adaptations 620,570,520,470
log[sensitivity], log[ratio], lin[threshold]=0&0,04
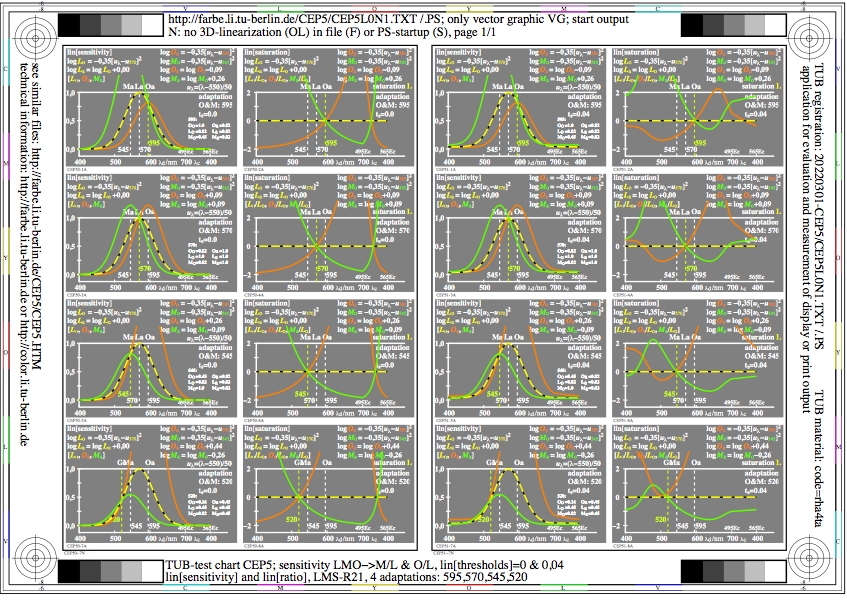
Figure CEP5L0N1.jpg: Output in format A6 of the file
CEP5L0NP.PDF, see
CEP5L0N1.
PS /
TXT /
PDF /
jpg
CEP5: TUB-test chart CEQ5; LMS-R21-colour vision modell
sensitivity OLM->O/L&M/L, 4 adaptations 595,570,545,520
log[sensitivity], log[ratio], lin[threshold]=0&0,04
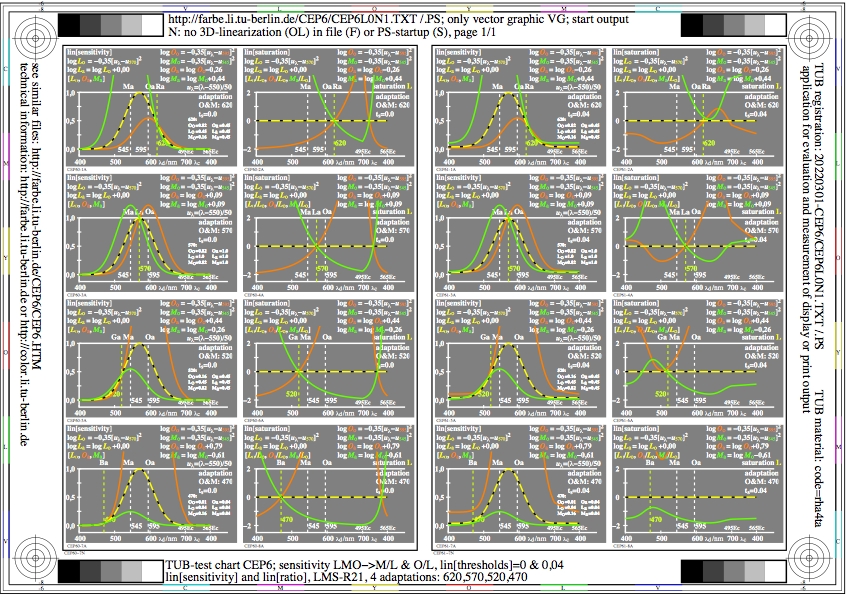
Figure CEP6L0N1.jpg: Output in format A6 of the file
CEP6L0NP.PDF, see
CEP6L0N1.
PS /
TXT /
PDF /
jpg
CEP6: TUB-test chart CEQ6; LMS-R21-colour vision modell
sensitivity OLM->O/L&M/L, 4 adaptations: 620,570,520,470
log[sensitivity], log[ratio], lin[threshold]=0&0,04

Figure CEP7L0N1.jpg: Output in format A6 of the file
CEP7L0NP.PDF, see
CEP7L0N1.
PS /
TXT /
PDF /
jpg
CEP7: TUB-test chart CEQ7; LMS-R21-colour vision modell
sensitivity OLM->O/V&M/V, 4 adaptations: 595,570,545,520
log[sensitivity], log[ratio], lin[threshold]=0&0,04

Figure CEP8L0N1.jpg: Output in format A6 of the file
CEP8L0NP.PDF, see
CEP8L0N1.
PS /
TXT /
PDF /
jpg
CEP8: TUB-test chart CEQ8; LMS-R21-colour vision modell
sensitivity 557,457,507, VNg->V/g&N/g, WN-antagonisme
log[sensitivity], log[ratio], lin[threshold]=0&0,04

Figure CEP9L0N1.jpg: Output in format A6 of the file
CEP9L0NP.PDF, see
CEP9L0N1.
PS /
TXT /
PDF /
jpg
CEP9: TUB-test chart CEQ9; LMS-R21-colour vision modell
sensitivity 570,470,520, YBG->Y/G&B/G, YB-antagonisme
log[sensitivity], log[ratio], lin[threshold]=0&0,04
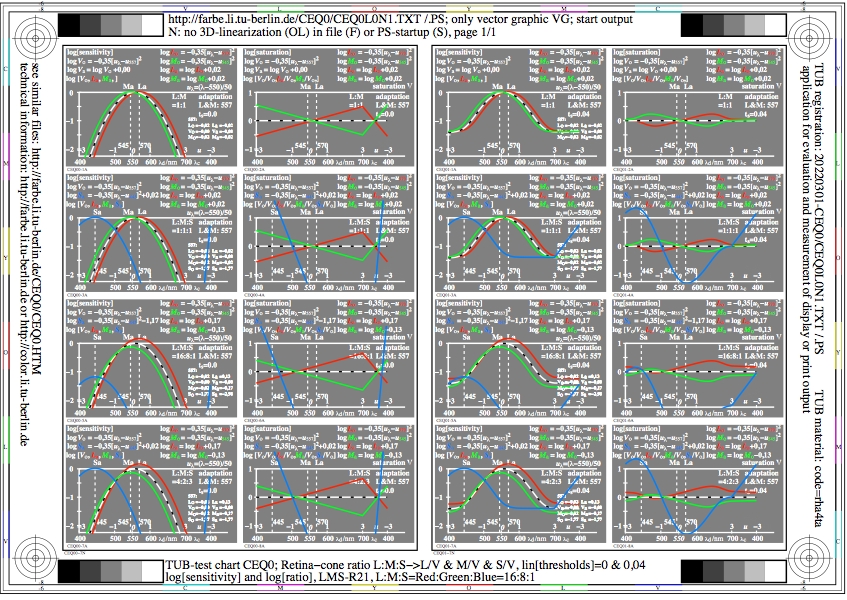
Figure CEQ0L0N1.jpg: Output in format A6 of the file
CEQ0L0NP.PDF, see
CEQ0L0N1.
PS /
TXT /
PDF /
jpg
CEQ0: TUB-test chart CEQ0; LMS-R21-colour vision modell
cone ratio red:green:blue=16:8:1
log[sensitivity], log[ratio], lin[threshold]=0&0,04
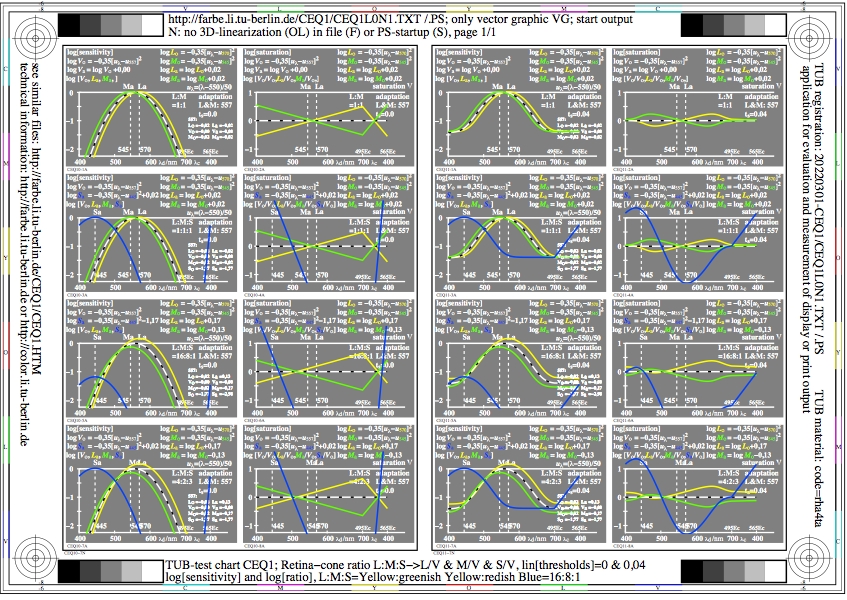
Figure CEQ1L0N1.jpg: Output in format A6 of the file
CEQ1L0NP.PDF, see
CEQ1L0N1.
PS /
TXT /
PDF /
jpg
CEQ1: TUB-test chart CEQ1; LMS-R21-colour vision modell
cone ratio yellow:greenish yellow:reddish blue=16:8:1
log[sensitivity], log[ratio], lin[threshold]=0&0,04

Figure CEQ2L0N1.jpg: Output in format A6 of the file
CEQ2L0NP.PDF, see
CEQ2L0N1.
PS /
TXT /
PDF /
jpg
CEQ2: TUB-test chart CEQ2; LMS-R21-colour vision modell
sensitivity 570,557,545, LMV->L/V&M/V, adaptation 557
log[sensitivity], log[ratio], lin[threshold]=0&0,04
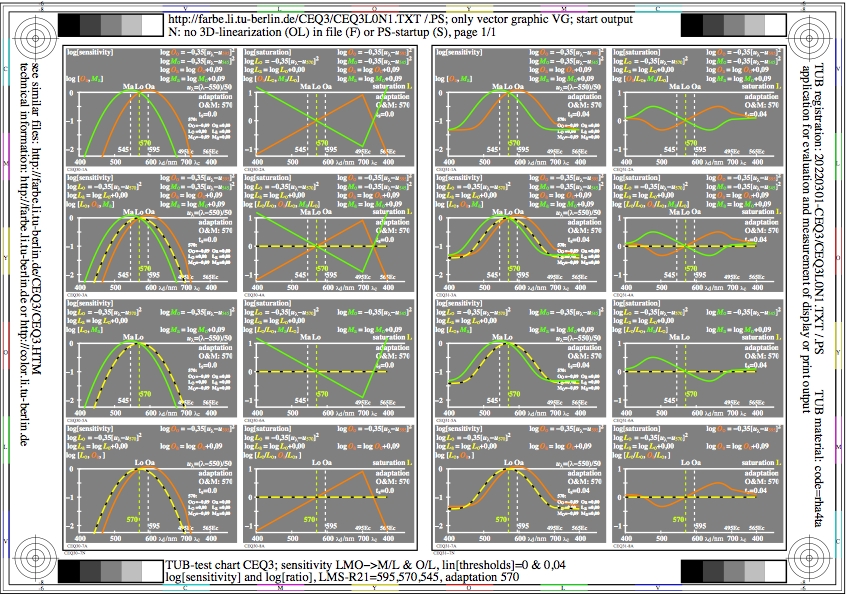
Figure CEQ3L0N1.jpg: Output in format A6 of the file
CEQ3L0NP.PDF, see
CEQ3L0N1.
PS /
TXT /
PDF /
jpg
CEQ3: TUB-test chart CEQ3; LMS-R21-colour vision modell
sensitivity 595,570,545, OLM->O/L&M/L, adaptation 570
log[sensitivity], log[ratio], lin[threshold]=0&0,04
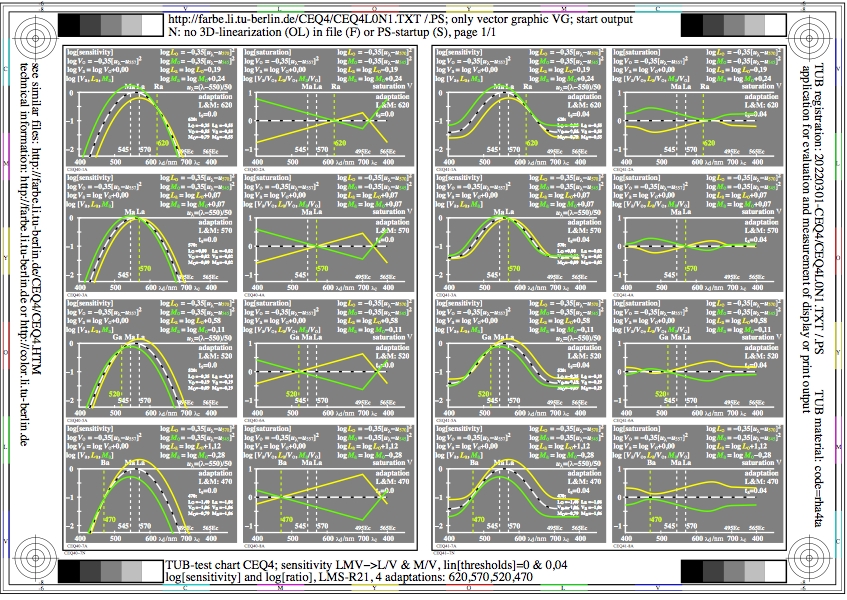
Figure CEQ4L0N1.jpg: Output in format A6 of the file
CEQ4L0NP.PDF, see
CEQ4L0N1.
PS /
TXT /
PDF /
jpg
CEQ4: TUB-test chart CEQ4; LMS-R21-colour vision modell
sensitivity LMV->L/V&M/V, 4 adaptations 620,570,520,470
log[sensitivity], log[ratio], lin[threshold]=0&0,04
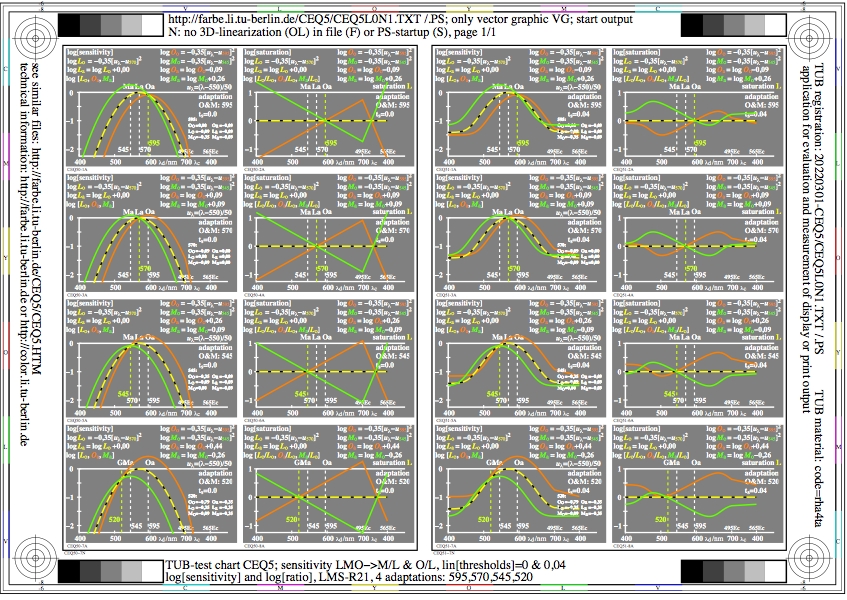
Figure CEQ5L0N1.jpg: Output in format A6 of the file
CEQ5L0NP.PDF, see
CEQ5L0N1.
PS /
TXT /
PDF /
jpg
CEQ5: TUB-test chart CEQ5; LMS-R21-colour vision modell
sensitivity OLM->O/L&M/L, 4 adaptations 595,570,545,520
log[sensitivity], log[ratio], lin[threshold]=0&0,04
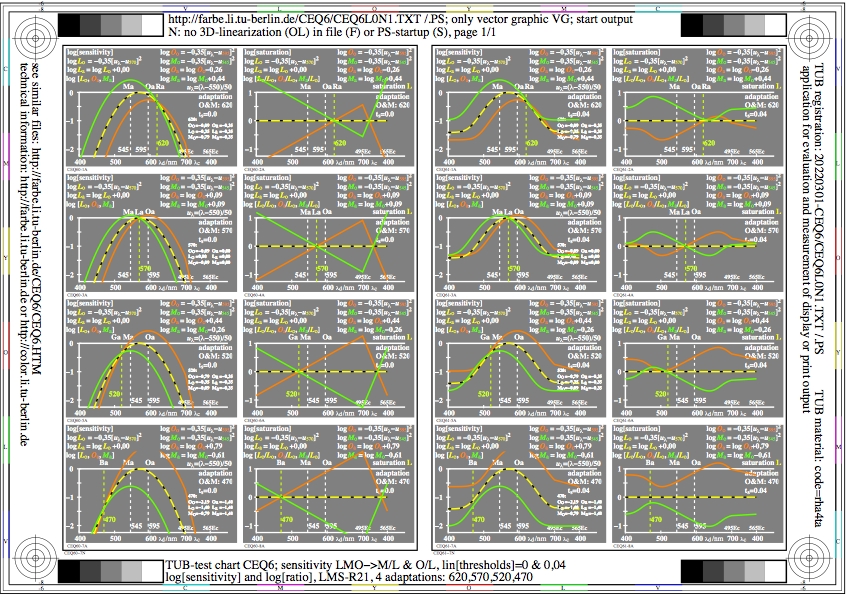
Figure CEQ6L0N1.jpg: Output in format A6 of the file
CEQ6L0NP.PDF, see
CEQ6L0N1.
PS /
TXT /
PDF /
jpg
CEQ6: TUB-test chart CEQ6; LMS-R21-colour vision modell
sensitivity OLM->O/L&M/L, 4 adaptations: 620,570,520,470
log[sensitivity], log[ratio], lin[threshold]=0&0,04
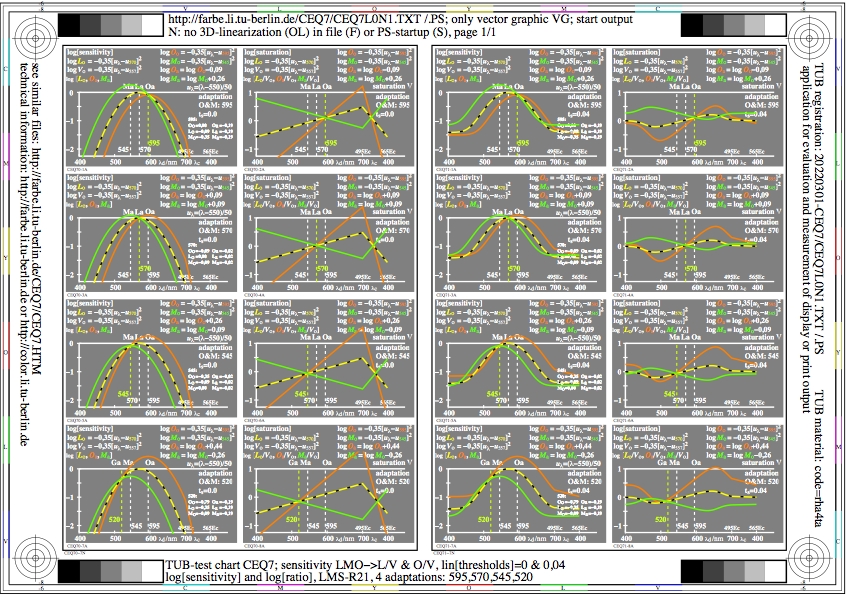
Figure CEQ7L0N1.jpg: Output in format A6 of the file
CEQ7L0NP.PDF, see
CEQ7L0N1.
PS /
TXT /
PDF /
jpg
CEQ7: TUB-test chart CEQ7; LMS-R21-colour vision modell
sensitivity OLM->O/V&M/V, 4 adaptations: 595,570,545,520
log[sensitivity], log[ratio], lin[threshold]=0&0,04
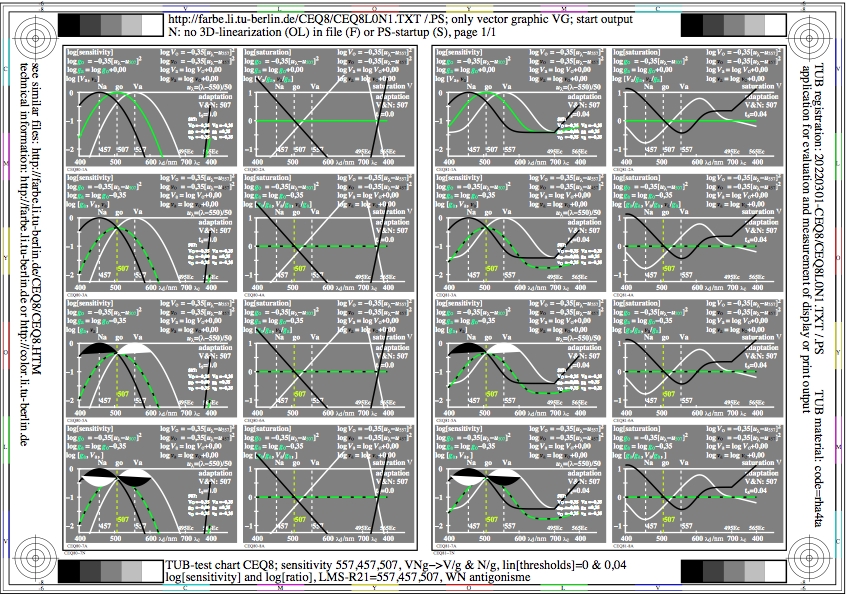
Figure CEQ8L0N1.jpg: Output in format A6 of the file
CEQ8L0NP.PDF, see
CEQ8L0N1.
PS /
TXT /
PDF /
jpg
CEQ8: TUB-test chart CEQ8; LMS-R21-colour vision modell
sensitivity 557,457,507, VNg->V/g&N/g, WN-antagonisme
log[sensitivity], log[ratio], lin[threshold]=0&0,04
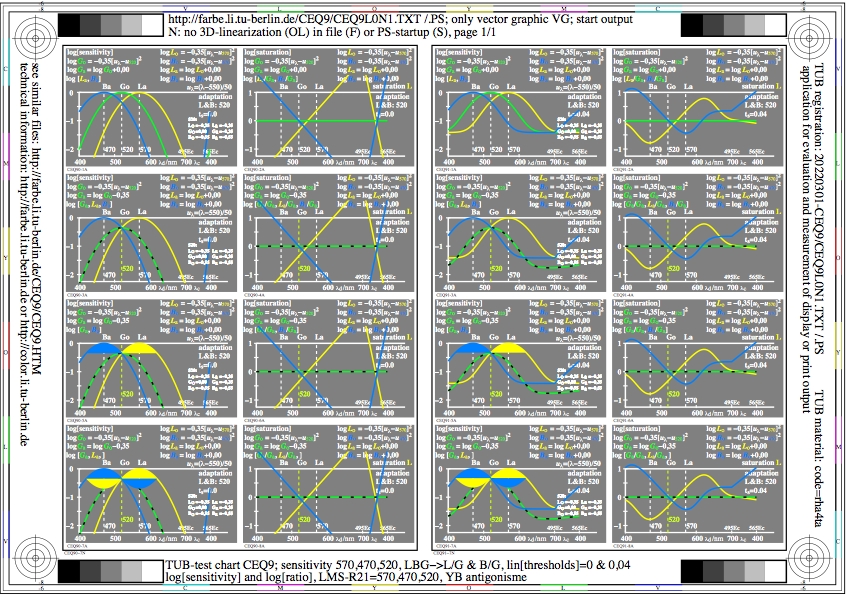
Figure CEQ9L0N1.jpg: Output in format A6 of the file
CEQ9L0NP.PDF, see
CEQ9L0N1.
PS /
TXT /
PDF /
jpg
CEQ9: TUB-test chart CEQ9; LMS-R21-colour vision modell
sensitivity 570,470,520, YBG->Y/G&B/G, YB-antagonisme
log[sensitivity], log[ratio], lin[threshold]=0&0,04
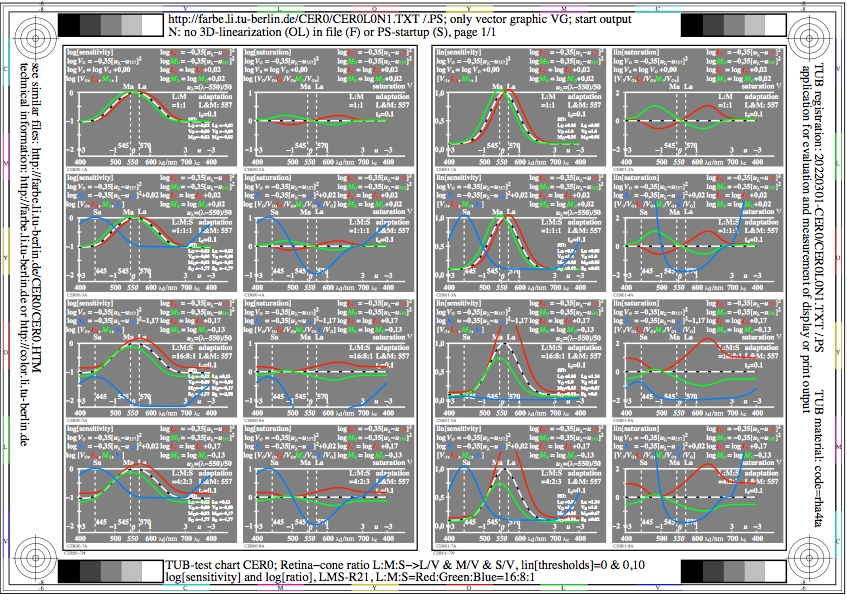
Figure CER0L0N1.jpg: Output in format A6 of the file
CER0L0NP.PDF, see
CER0L0N1.
PS /
TXT /
PDF /
jpg
CER0: TUB-test chart CER0; LMS-R21-colour vision modell
cone ratio red:green:blue=16:8:1
log & lin[sensitivity & ratio], lin[threshold]=0&0,04
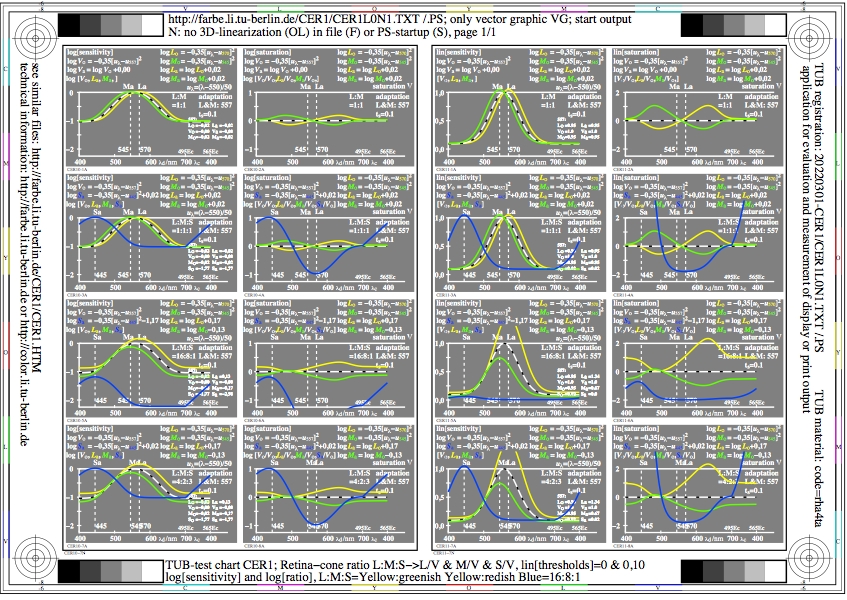
Figure CER1L0N1.jpg: Output in format A6 of the file
CER1L0NP.PDF, see
CER1L0N1.
PS /
TXT /
PDF /
jpg
CER1: TUB-test chart CER1; LMS-R21-colour vision modell
cone ratio yellow:greenish yellow:reddish blue=16:8:1
log & lin[sensitivity & ratio], lin[threshold]=0&0,04
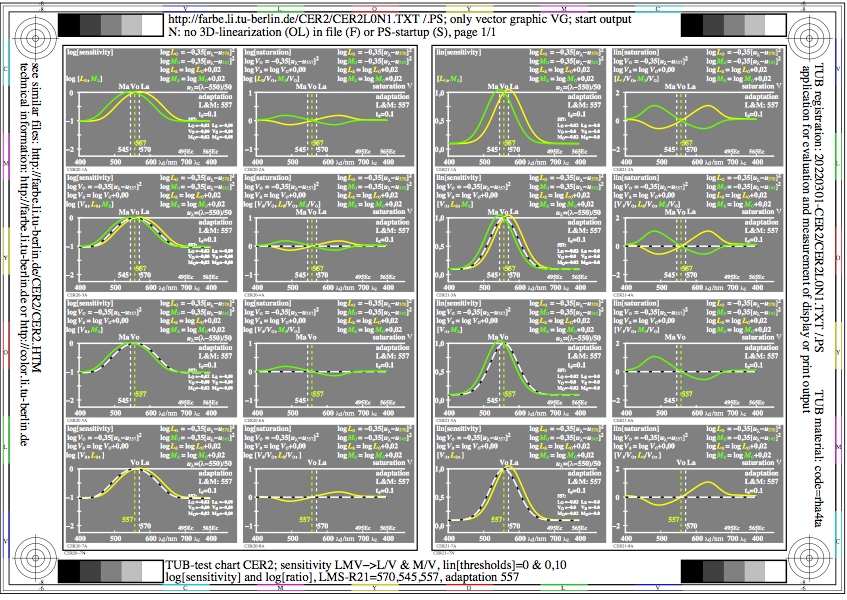
Figure CER2L0N1.jpg: Output in format A6 of the file
CER2L0NP.PDF, see
CER2L0N1.
PS /
TXT /
PDF /
jpg
CER2: TUB-test chart CER2; LMS-R21-colour vision modell
sensitivity 570,557,545, LMV->L/V&M/V, adaptation 557
log & lin[sensitivity & ratio], lin[threshold]=0&0,04

Figure CER3L0N1.jpg: Output in format A6 of the file
CER3L0NP.PDF, see
CER3L0N1.
PS /
TXT /
PDF /
jpg
CER3: TUB-test chart CER3; LMS-R21-colour vision modell
sensitivity 595,570,545, OLM->O/L&M/L, adaptation 570
log & lin[sensitivity & ratio], lin[threshold]=0&0,04
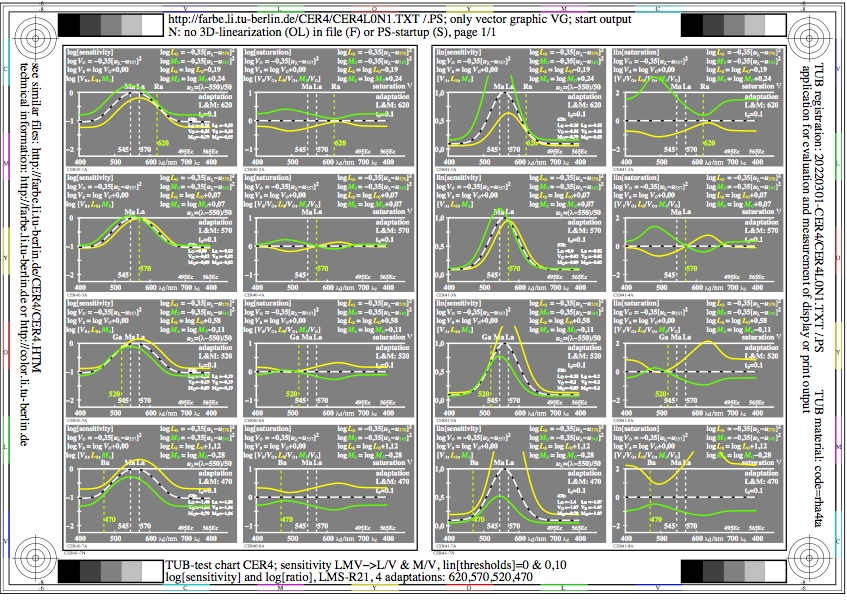
Figure CER4L0N1.jpg: Output in format A6 of the file
CER4L0NP.PDF, see
CER4L0N1.
PS /
TXT /
PDF /
jpg
CER4: TUB-test chart CER4; LMS-R21-colour vision modell
sensitivity LMV->L/V&M/V, 4 adaptations 620,570,520,470
log & lin[sensitivity & ratio], lin[threshold]=0&0,04
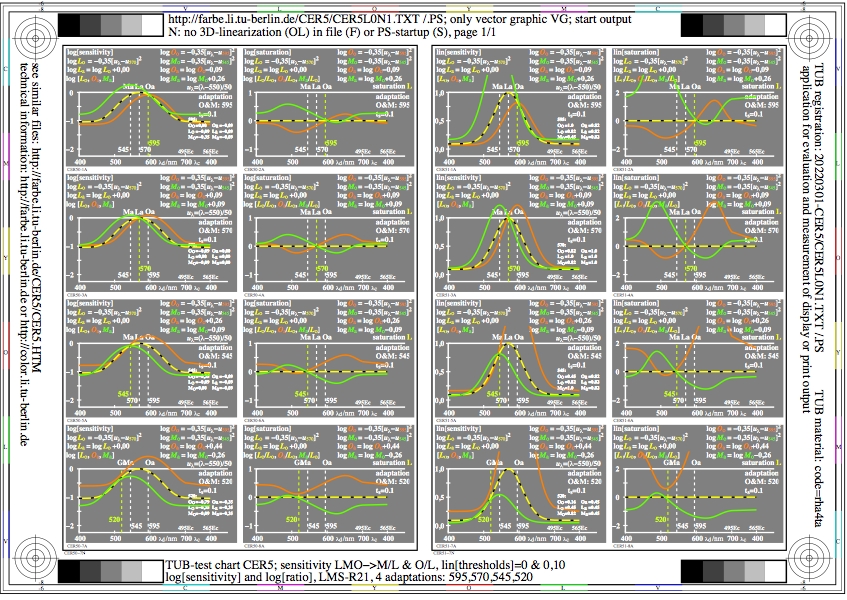
Figure CER5L0N1.jpg: Output in format A6 of the file
CER5L0NP.PDF, see
CER5L0N1.
PS /
TXT /
PDF /
jpg
CER5: TUB-test chart CER5; LMS-R21-colour vision modell
sensitivity OLM->O/L&M/L, 4 adaptations 595,570,545,520
log & lin[sensitivity & ratio], lin[threshold]=0&0,04
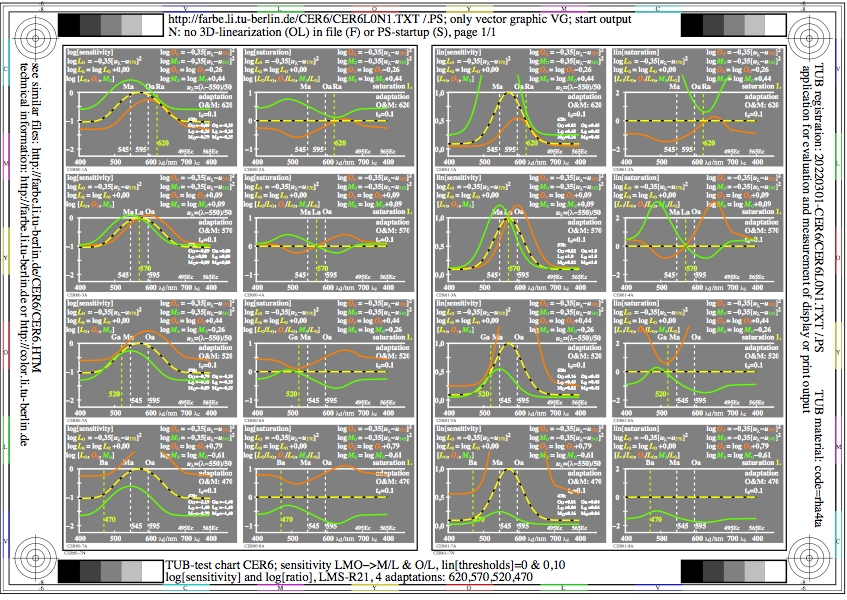
Figure CER6L0N1.jpg: Output in format A6 of the file
CER6L0NP.PDF, see
CER6L0N1.
PS /
TXT /
PDF /
jpg
CER6: TUB-test chart CER6; LMS-R21-colour vision modell
sensitivity OLM->O/L&M/L, 4 adaptations: 620,570,520,470
log & lin[sensitivity & ratio], lin[threshold]=0&0,04
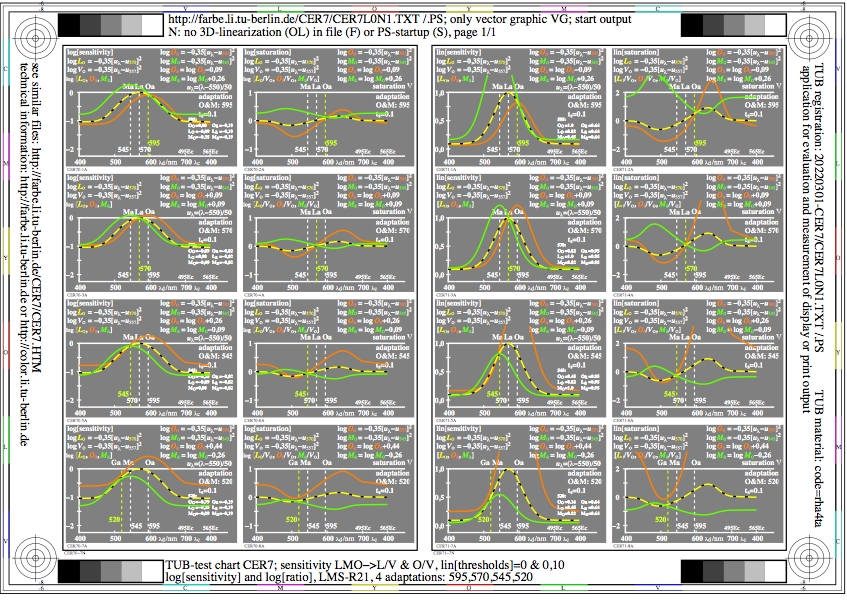
Figure CER7L0N1.jpg: Output in format A6 of the file
CER7L0NP.PDF, see
CER7L0N1.
PS /
TXT /
PDF /
jpg
CER7: TUB-test chart CER7; LMS-R21-colour vision modell
sensitivity OLM->O/V&M/V, 4 adaptations: 595,570,545,520
log & lin[sensitivity & ratio], lin[threshold]=0&0,04
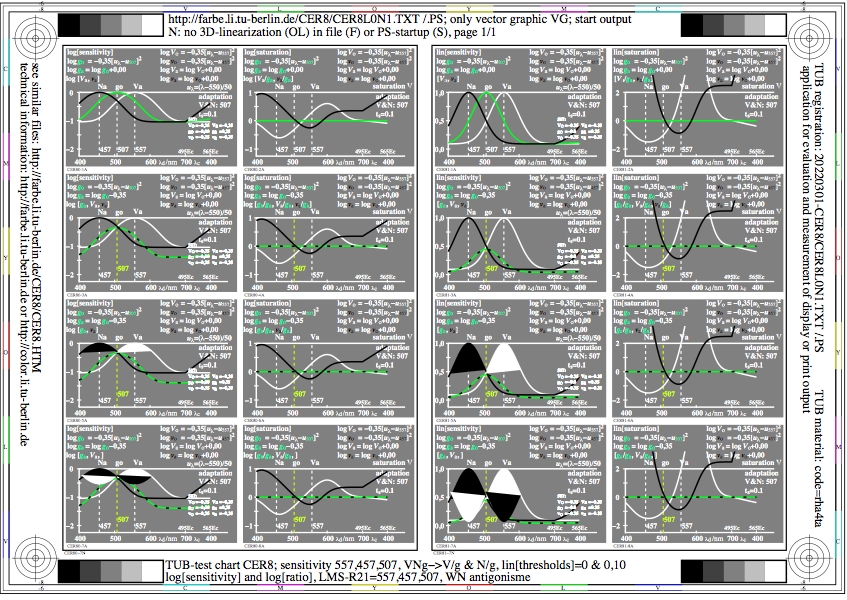
Figure CER8L0N1.jpg: Output in format A6 of the file
CER8L0NP.PDF, see
CER8L0N1.
PS /
TXT /
PDF /
jpg
CER8: TUB-test chart CER8; LMS-R21-colour vision modell
sensitivity 557,457,507, VNg->V/g&N/g, WN-antagonisme
log & lin[sensitivity & ratio], lin[threshold]=0&0,04
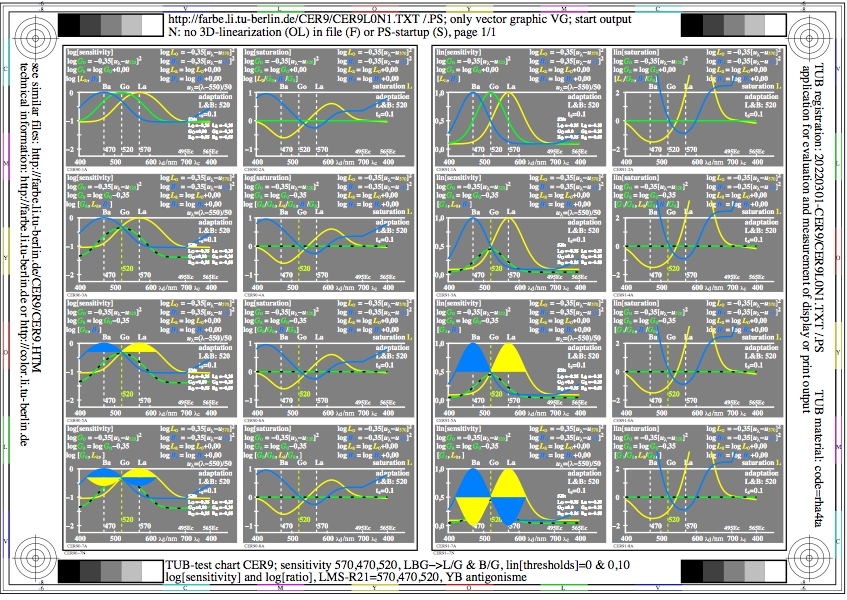
Figure CER9L0N1.jpg: Output in format A6 of the file
CER9L0NP.PDF, see
CER9L0N1.
PS /
TXT /
PDF /
jpg
CER9: TUB-test chart CER9; LMS-R21-colour vision modell
sensitivity 570,470,520, YBG->Y/G&B/G, YB-antagonisme
log & lin[sensitivity & ratio], lin[threshold]=0&0,04
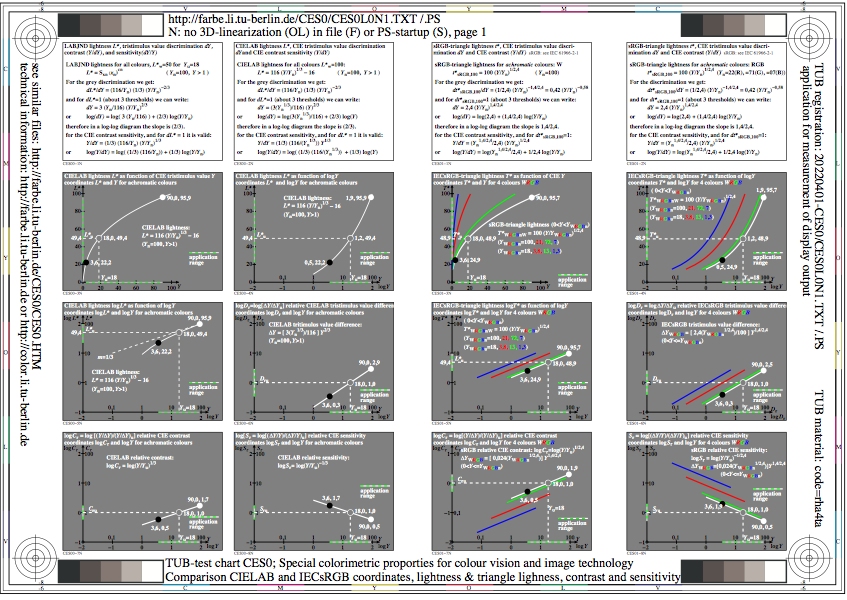
Figure CES0L0N1.jpg: Output in format A6 of the file
CES0L0NP.PDF, see
CES0L0N1.
PS /
TXT /
PDF /
jpg
CES0: TUB-test chart CES0; Special properties of colour vision,
Comparison of CIELAB and IECsRGB coordinates,
Lightness & triangle lightness, contrast and sensitivity

Figure CES1L0N1.jpg: Output in format A6 of the file
CES1L0NP.PDF, see
CES1L0N1.
PS /
TXT /
PDF /
jpg
CES1: TUB-test chart CES1; Special properties of colour vision,
CIELAB modifications with chromaticity diagrams,
Achromatic and chromatic thresholds as function of Y

Figure CES2L0N1.jpg: Output in format A6 of the file
CES2L0NP.PDF, see
CES2L0N1.
PS /
TXT /
PDF /
jpg
CES2: TUB-test chart CES2; Special properties of colour vision,
Elementary colours, complementary wavelength,
CIELAB equation and modifications from Yn to Yu
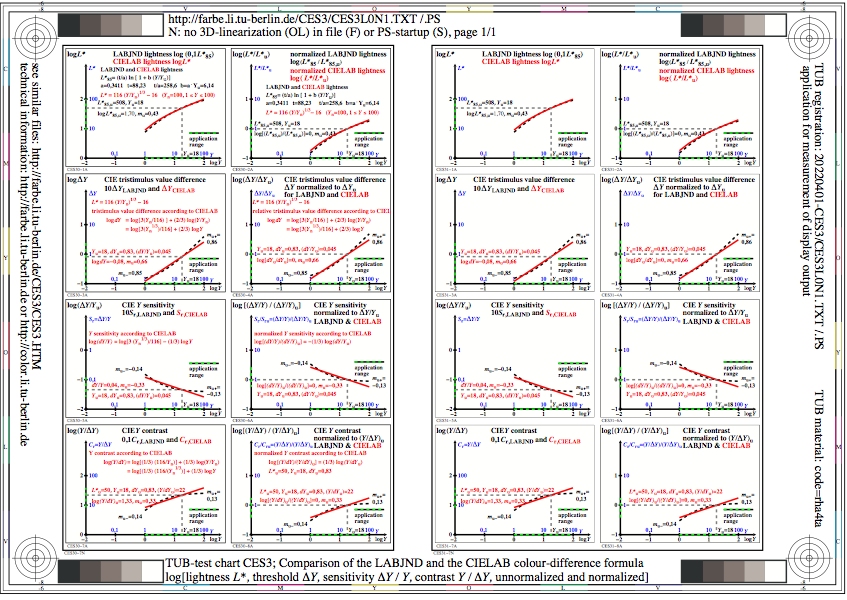
Figure CES3L0N1.jpg: Output in format A6 of the file
CES3L0NP.PDF, see
CES3L0N1.
PS /
TXT /
PDF /
jpg
CES3: TUB-Test chart CES3; Comparison of LABJND & CIELAB formula,
CIE lightness L*, derivation dL*/dY, and threshold dY,
CIE sensitivity dY/Y and CIE contrast Y/dY

Figure CES4L0N1.jpg: Output in format A6 of the file
CES4L0NP.PDF, see
CES4L0N1.
PS /
TXT /
PDF /
jpg
CES4: TUB-Test chart CES4; Comparison of LABJND & CIEDE2000 formula
CIE lightness L*, derivation dL*/dY, and threshold dY,
CIE sensitivity dY/Y and CIE contrast Y/dY
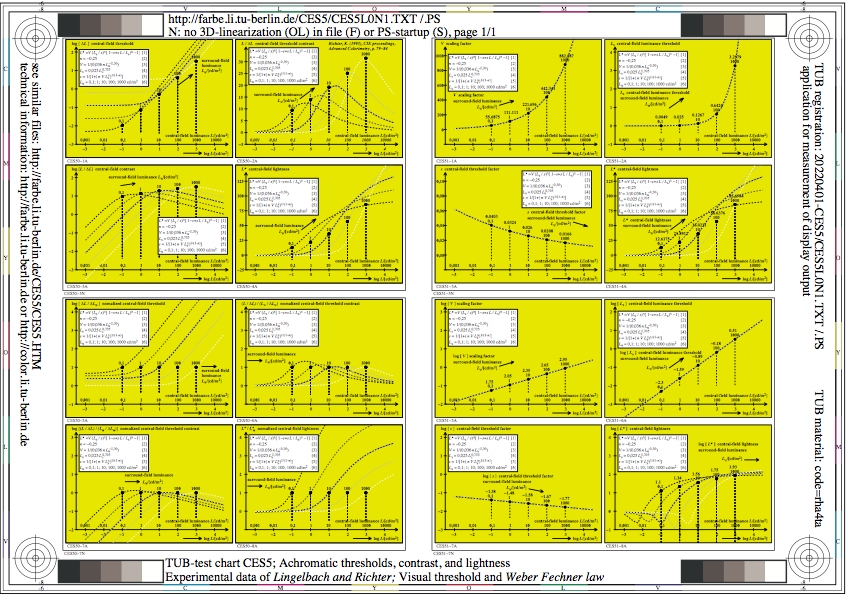
Figure CES5L0N1.jpg: Output in format A6 of the file
CES5L0NP.PDF, see
CES5L0N1.
PS /
TXT /
PDF /
jpg
CES5: TUB-Test chart CES5; Achromatic thresholds,
luminance thresholds, contrast, and lightness,
experimental data of Lingelbach and Richter
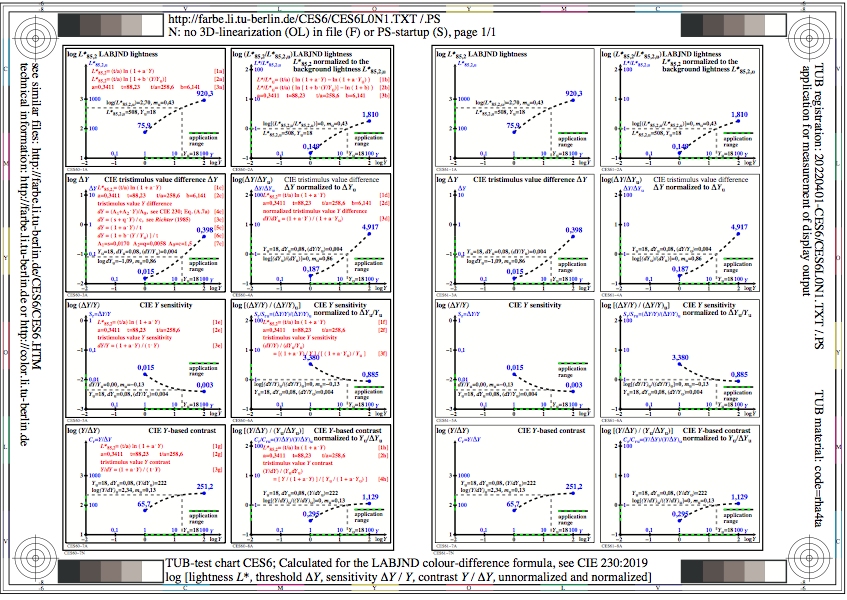
Figure CES6L0N1.jpg: Output in format A6 of the file
CES6L0NP.PDF, see
CES6L0N1.
PS /
TXT /
PDF /
jpg
CES6: TUB-Test chart CES6; LABJND colour differences, CIE 230:2019,
logarithmic ordinate for LABJND lightness L*,
derivation dL*/dY, sensitivity dY/Y, and contrast Y/dY
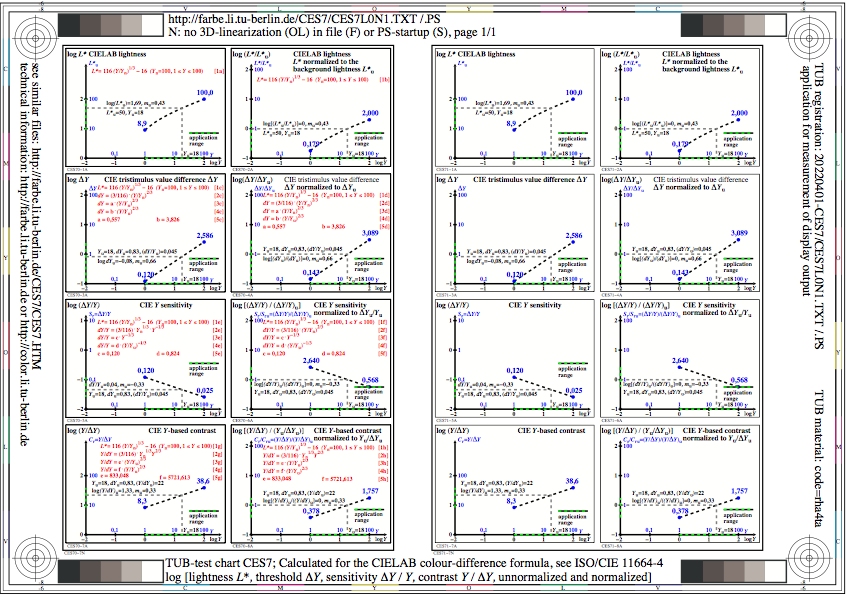
Figure CES7L0N1.jpg: Output in format A6 of the file
CES7L0NP.PDF, see
CES7L0N1.
PS /
TXT /
PDF /
jpg
CES7: TUB-Test chart CES7; CIELAB colour differences, ISO/CIE 11664-4,
logarithmic ordinate for CIELAB lightness L*,
derivation dL*/dY, sensitivity dY/Y, and contrast Y/dY
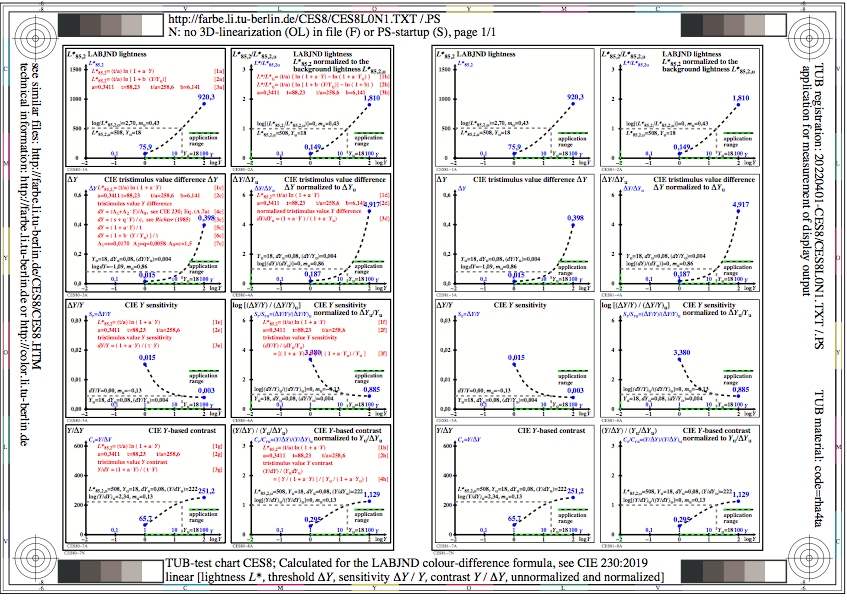
Figure CES8L0N1.jpg: Output in format A6 of the file
CES8L0NP.PDF, see
CES8L0N1.
PS /
TXT /
PDF /
jpg
CES8: TUB-Test chart CES8; LABJND colour differences, CIE 230:2019,
linear ordinate for LABJND lightness L*,
derivation dL*/dY, sensitivity dY/Y, and contrast Y/dY

Figure CES9L0N1.jpg: Output in format A6 of the file
CES9L0NP.PDF, see
CES9L0N1.
PS /
TXT /
PDF /
jpg
CES9: TUB-Test chart CES9; CIELAB colour differences, ISO/CIE 11664-4,
linear ordinate for CIELAB lightness L*,
derivation dL*/dY, sensitivity dY/Y, and contrast Y/dY
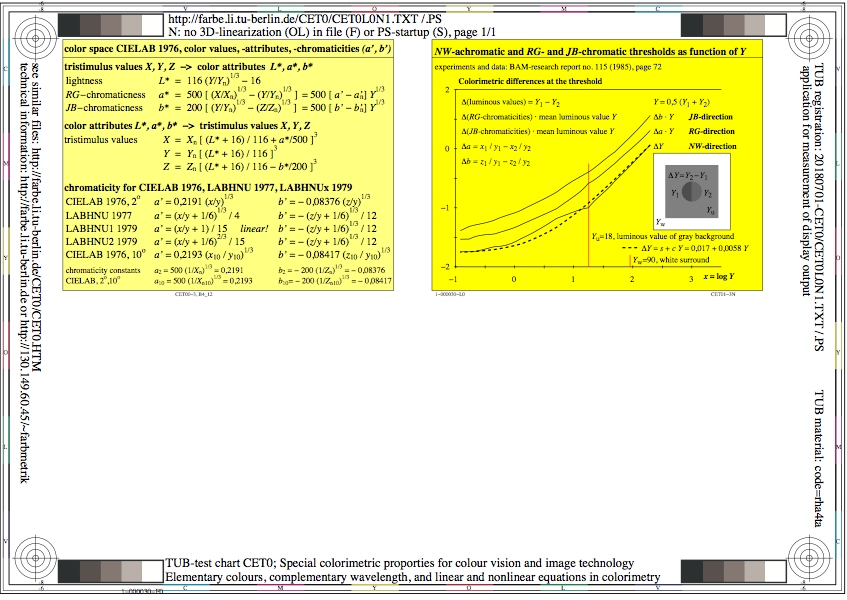
Figure CET0L0N1.jpg: Output in format A6 of the file
CET0L0NP.PDF, see
CET0L0N1.
PS /
TXT /
PDF /
jpg
CET0: TUB-test chart CET0; Special colorimetric properties
Colour space CIELAB 1976, colour values, colour attributes
chromaticities (a', b') of CIELAB 1976 and LABHNUx 1979
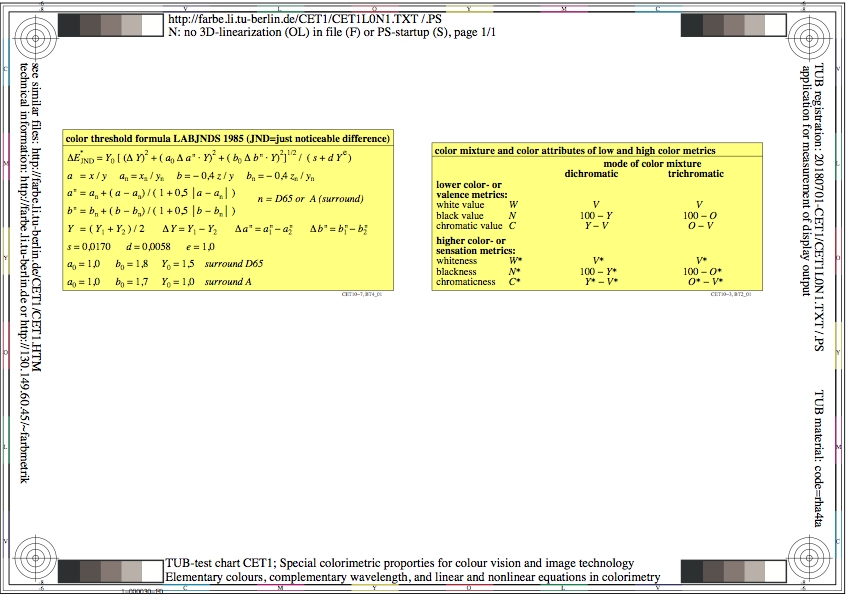
Figure CET1L0N1.jpg: Output in format A6 of the file
CET1L0NP.PDF, see
CET1L0N1.
PS /
TXT /
PDF /
jpg
CET1: TUB-test chart CET1; Special colorimetric properties
colour mixture, colour attributes of low and higher metrics
colour-threshold formula LABJND 1985, see CIE 230:2019
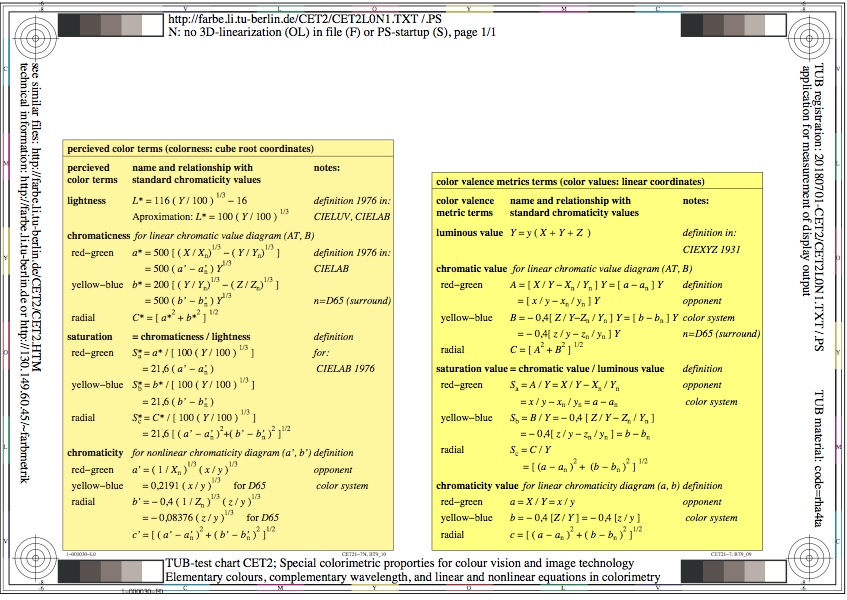
Figure CET2L0N1.jpg: Output in format A6 of the file
CET2L0NP.PDF, see
CET2L0N1.
PS /
TXT /
PDF /
jpg
CET2: TUB-test chart CET2; Special colorimetric properties
for colour vision and image technology; colour valence metric
chromatic value, saturation value, chromaticity value

Figure CET3L0N1.jpg: Output in format A6 of the file
CET3L0NP.PDF, see
CET3L0N1.
PS /
TXT /
PDF /
jpg
CET3: TUB-test chart CET3; Special colorimetric properties
for colour vision and image technolgoy; elementary colours
complementary wavelength; equations in colorimetry
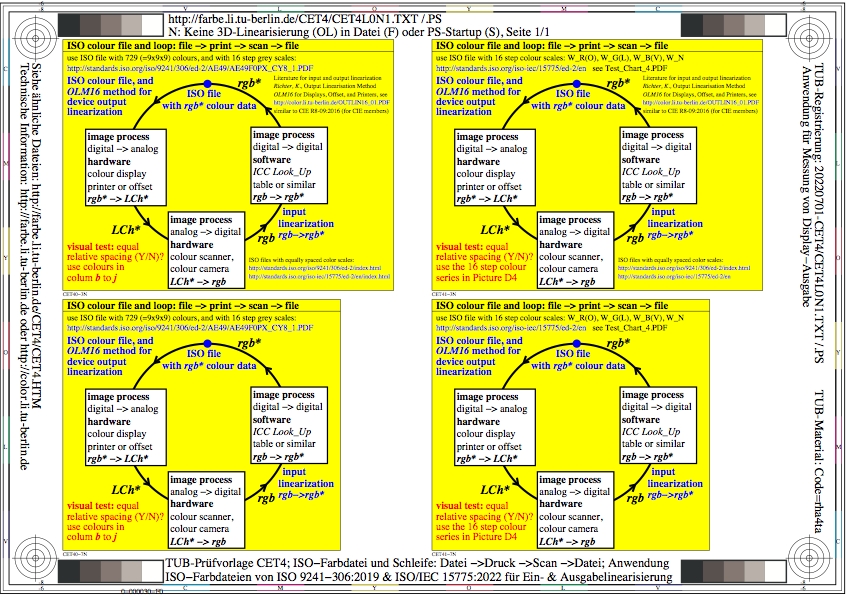
Figure CET4L0N1.jpg: Output in format A6 of the file
CET4L0NP.PDF, see
CET4L0N1.
PS /
TXT /
PDF /
jpg
CET4: TUB-test chart CET4; ISO-colour file and colour pei
Colour circle: ISO file -> print -> scan -> ISO file
ISO 9241-306 & ISO/IEC 15775: input and output linearization

Figure CET5L0N1.jpg: Output in format A6 of the file
CET5L0NP.PDF, see
CET5L0N1.
PS /
TXT /
PDF /
jpg
CET5: TUB-test chart CET5; comparison lightness formulae
CIELAB, IECsRGB, CIEDE2000 and LABJND (CIE 230:2019)
Lightness L* and relative contrast Cr=Y/dY as function of Y
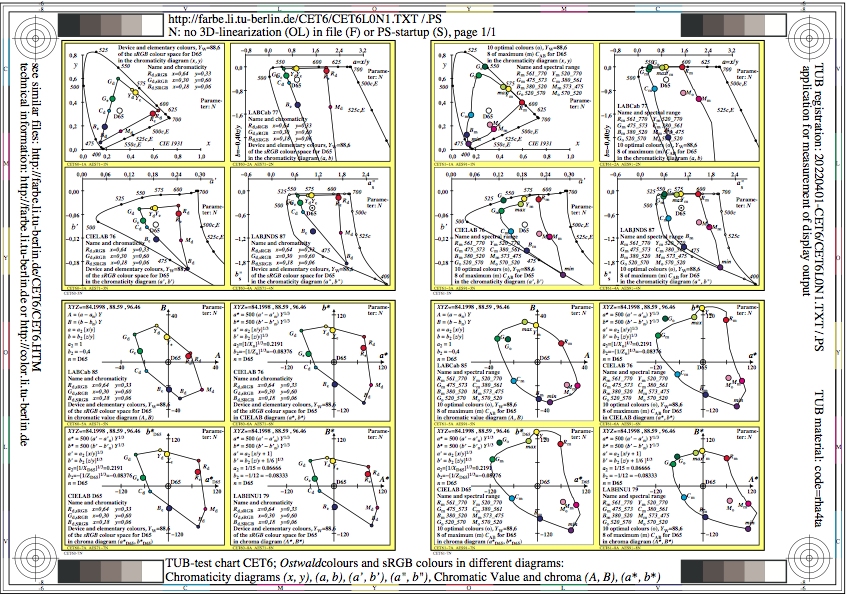
Figure CET6L0N1.jpg: Output in format A6 of the file
CET6L0NP.PDF, see
CET6L0N1.
PS /
TXT /
PDF /
jpg
CET6: TUB-test chart CET6; Ostwald colours and sRGB colours
chromaticities (x,y), (a,b), and nonlinear ones (a',b')
Chromatic values and chroma: (A,B), (a*,b*), (a*,b*)D65, (A*,B*)

Figure CET7L0N1.jpg: Output in format A6 of the file
CET7L0NP.PDF, see
CET7L0N1.
PS /
TXT /
PDF /
jpg
CET7: TUB-test chart CET7; Wavelength ranges of 6
Ostwald colours and W, contrast C=25:1, +-signals
Reflections R, Rr=R/0,18, Rs=log(Rr), hue threshold dhA2B2=6
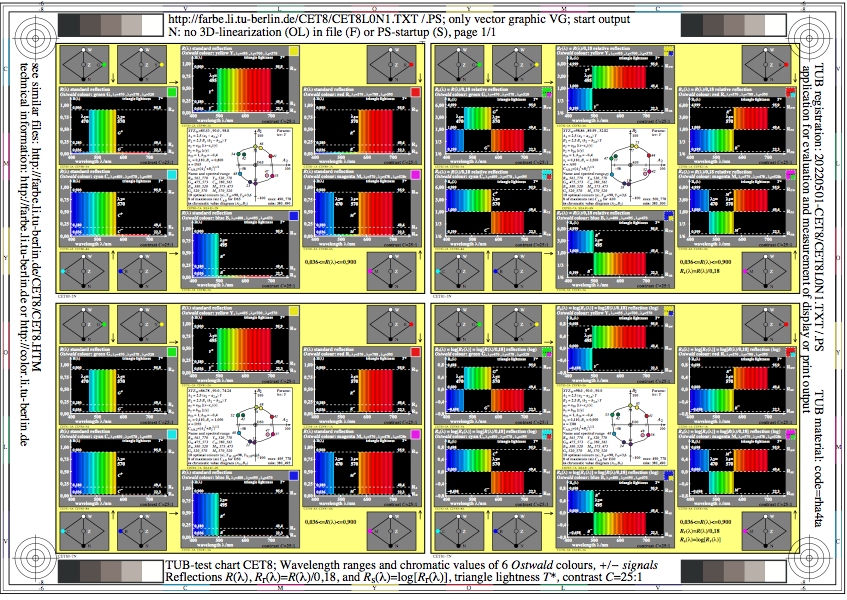
Figure CET8L0N1.jpg: Output in format A6 of the file
CET8L0NP.PDF, see
CET8L0N1.
PS /
TXT /
PDF /
jpg
CET8: TUB-test chart CET8; Wavelength ranges of 6
Ostwald colours and W, contrast C=2:1, +-signals
Reflections R, Rr=R/0,18, Rs=log(Rr), hue threshold dhA2B2=18

Figure CET9L0N1.jpg: Output in format A6 of the file
CET9L0NP.PDF, see
CET9L0N1.
PS /
TXT /
PDF /
jpg
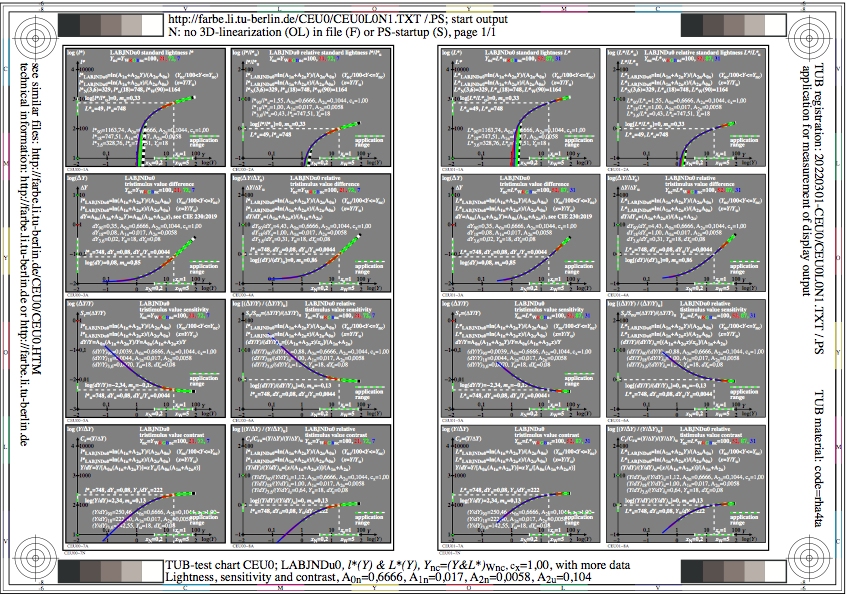
Figure CEU0L0N1.jpg: Output in format A6 of the file
CEU0L0NP.PDF, see
CEU0L0N1.
PS /
TXT /
PDF /
jpg
CEU0: TUB-test chart CEU0; LABJNDu0 formulae similar to CIE 230
LABJND lightness, A0n=1,50, A1n, A2n, cx=1,00 & data
absolute and relative lightness, sensitivity and contrast
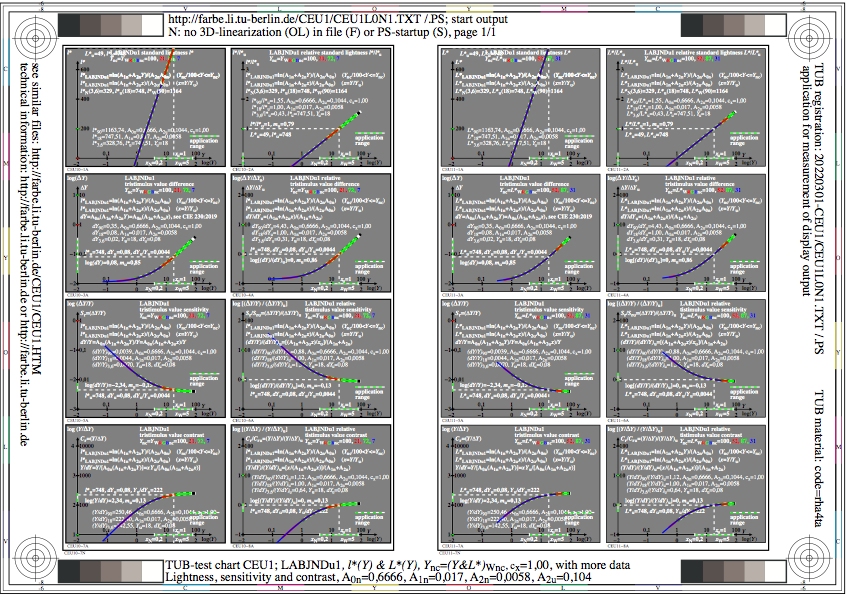
Figure CEU1L0N1.jpg: Output in format A6 of the file
CEU1L0NP.PDF, see
CEU1L0N1.
PS /
TXT /
PDF /
jpg
CEU1: TUB-test chart CEU1; LABJNDu1 formulae similar to CIE 230
LABJND lightness, A0n=1,50, A1n, A2n, cx=1,00 & data
absolute and relative lightness, sensitivity and contrast
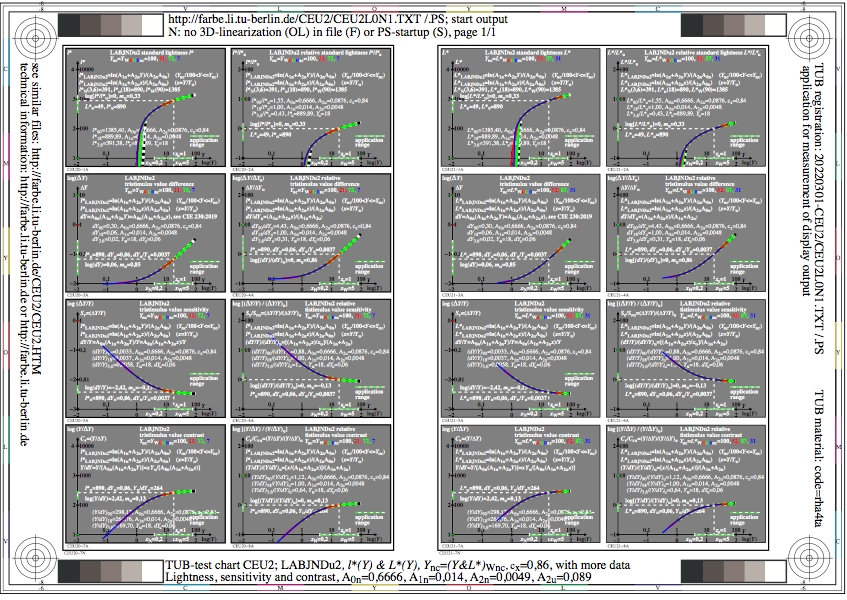
Figure CEU2L0N1.jpg: Output in format A6 of the file
CEU2L0NP.PDF, see
CEU2L0N1.
PS /
TXT /
PDF /
jpg
CEU2: TUB-test chart CEU2; LABJNDu2 formulae similar to CIE 230
LABJND lightness, A0n=1,50, A1n, A2n, cx=0,84 & data
absolute and relative lightness, sensitivity and contrast

Figure CEU3L0N1.jpg: Output in format A6 of the file
CEU3L0NP.PDF, see
CEU3L0N1.
PS /
TXT /
PDF /
jpg
CEU3: TUB-test chart CEU3; LABJNDu3 formulae similar to CIE 230
LABJND lightness, A0n=1,50, A1n, A2n, cx=0,67 & data
absolute and relative lightness, sensitivity and contrast
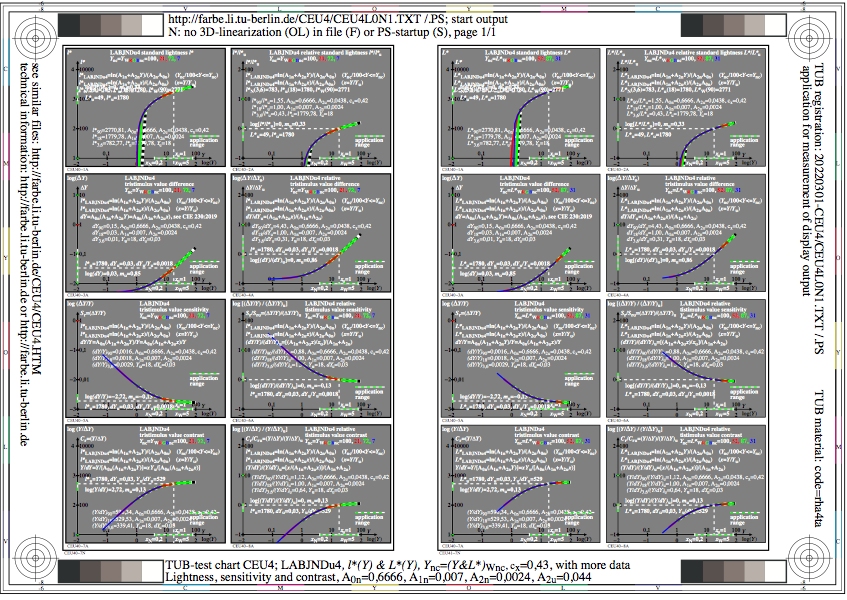
Figure CEU4L0N1.jpg: Output in format A6 of the file
CEU4L0NP.PDF, see
CEU4L0N1.
PS /
TXT /
PDF /
jpg
CEU4: TUB-test chart CEU4; LABJNDu4 formulae similar to CIE 230
LABJND lightness, A0n=1,50, A1n, A2n, cx=0,42 & data
absolute and relative lightness, sensitivity and contrast

Figure CEU5L0N1.jpg: Output in format A6 of the file
CEU5L0NP.PDF, see
CEU5L0N1.
PS /
TXT /
PDF /
jpg
CEU5: TUB-test chart CEU5; LABJNDu5 formulae similar to CIE 230
LABJND lightness, A0n=1,50, A1n, A2n, cx=1,00 & data
absolute and relative lightness, sensitivity and contrast
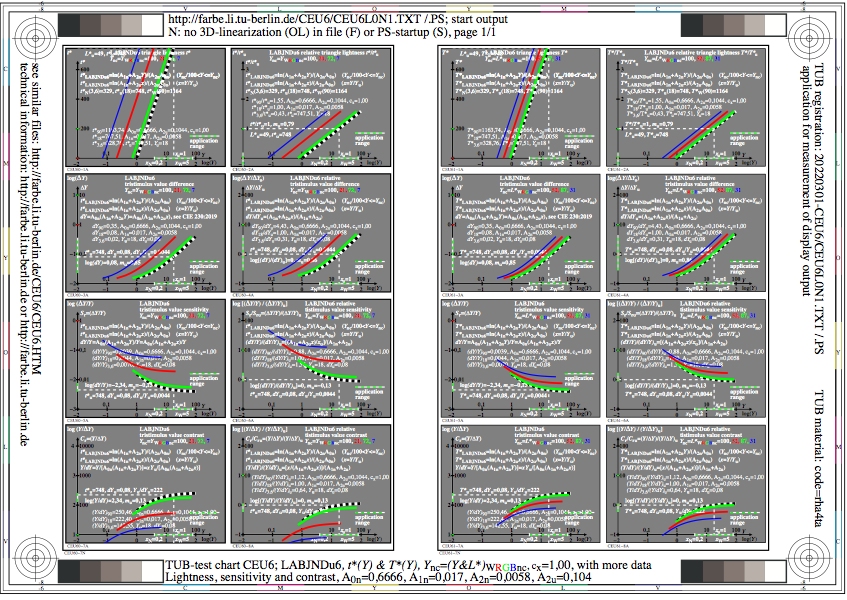
Figure CEU6L0N1.jpg: Output in format A6 of the file
CEU6L0NP.PDF, see
CEU6L0N1.
PS /
TXT /
PDF /
jpg
CEU6: TUB-test chart CEU6; LABJNDu6 formulae similar to CIE 230
LABJND lightness, A0n=1,50, A1n, A2n, cx=1,00 & data
absolute and relative lightness, sensitivity and contrast
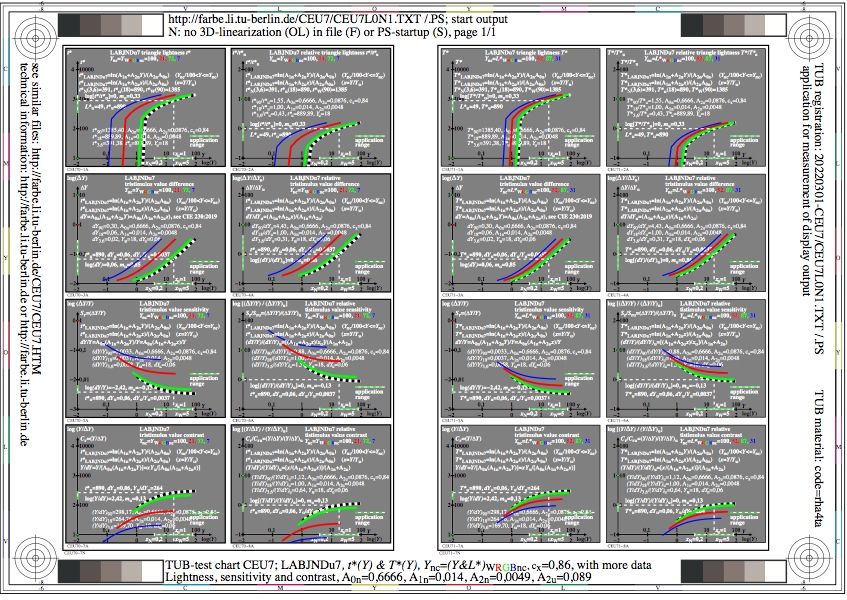
Figure CEU7L0N1.jpg: Output in format A6 of the file
CEU7L0NP.PDF, see
CEU7L0N1.
PS /
TXT /
PDF /
jpg
CEU7: TUB-test chart CEU7; LABJNDu7 formulae similar to CIE 230
LABJND lightness, A0n=1,50, A1n, A2n, cx=0,84 & data
absolute and relative lightness, sensitivity and contrast
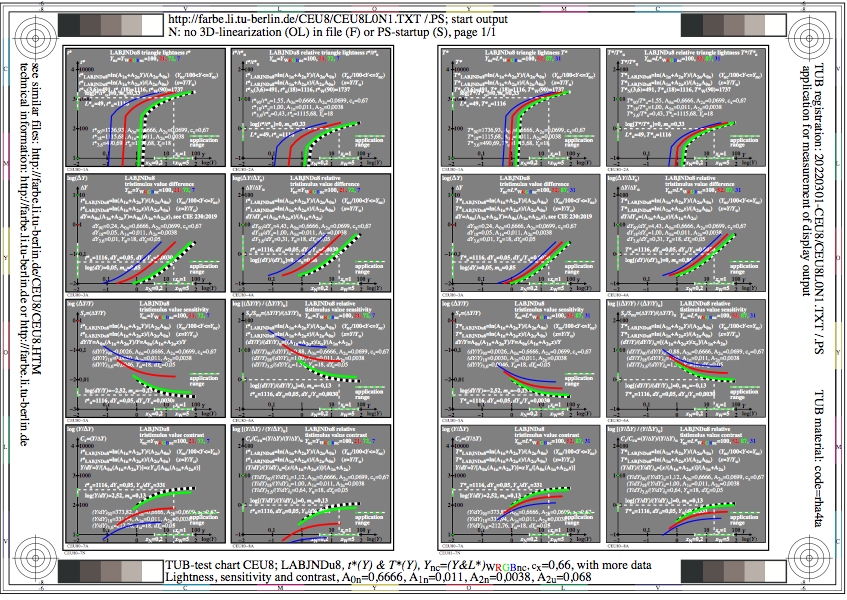
Figure CEU8L0N1.jpg: Output in format A6 of the file
CEU8L0NP.PDF, see
CEU8L0N1.
PS /
TXT /
PDF /
jpg
CEU8: TUB-test chart CEU8; LABJNDu8 formulae similar to CIE 230
LABJND lightness, A0n=1,50, A1n, A2n, cx=0,67 & data
absolute and relative lightness, sensitivity and contrast
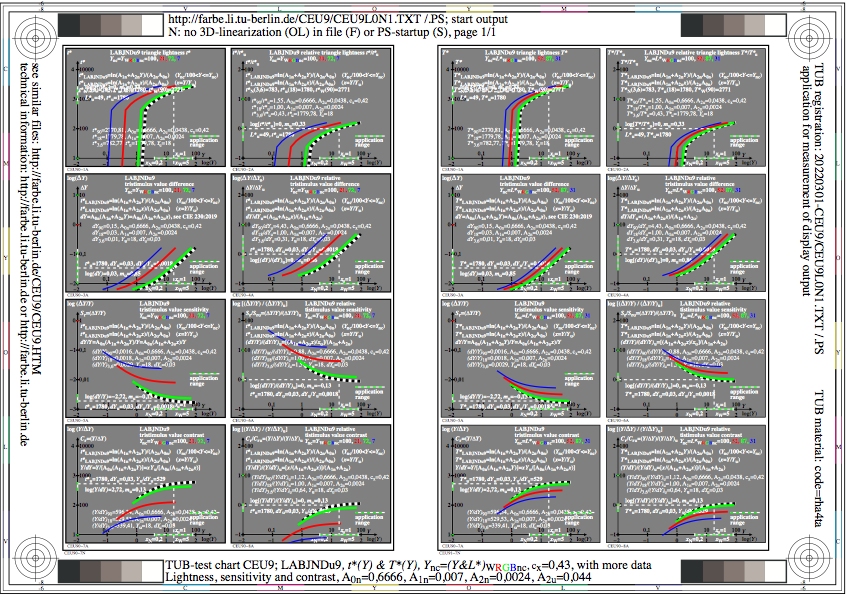
Figure CEU9L0N1.jpg: Output in format A6 of the file
CEU9L0NP.PDF, see
CEU9L0N1.
PS /
TXT /
PDF /
jpg
CEU9: TUB-test chart CEU9; LABJNDu9 formulae similar to CIE 230
LABJND lightness, A0n=1,50, A1n, A2n, cx=0,42 & data
absolute and relative lightness, sensitivity and contrast

Figure CEV0L0N1.jpg: Output in format A6 of the file
CEV0L0NP.PDF, see
CEV0L0N1.
PS /
TXT /
PDF /
jpg
CEV0: TUB-test chart CEV0; Printed ISO-test charts
Colour material of the Technical University Berlin (TUB)
RECS and CV&E with test charts of ISO/IEC 15775 & ISO 9241-306

Figure CEV1L0N1.jpg: Output in format A6 of the file
CEV1L0NP.PDF, see
CEV1L0N1.
PS /
TXT /
PDF /
jpg
CEV1: TUB-test chart CEV1; Free Copyright of TUB images
Free Copyright, if images are changed with PS code
Find of web sites, files and images with WayBackMachine (WBM)
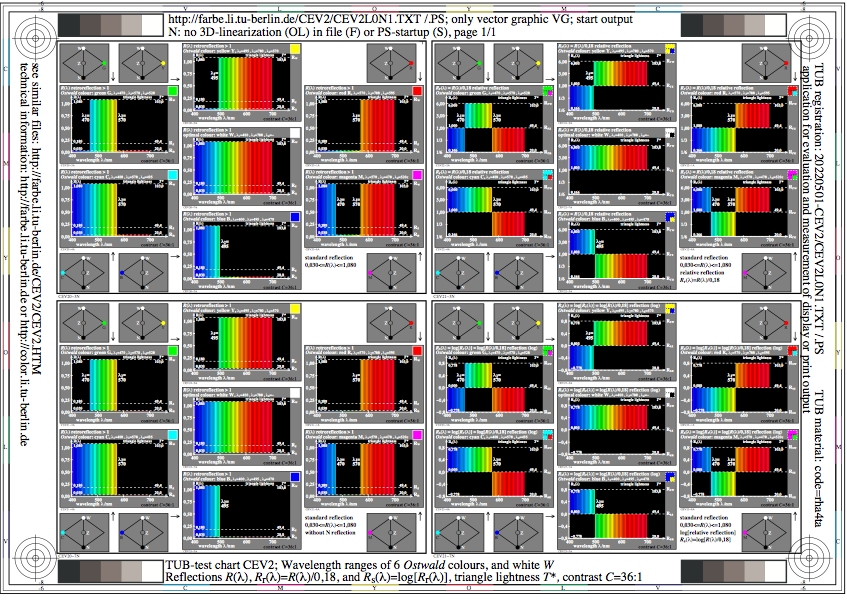
Figure CEV2L0N1.jpg: Output in format A6 of the file
CEV2L0NP.PDF, see
CEV2L0N1.
PS /
TXT /
PDF /
jpg
CEV2: TUB-test chart CEV2; Wavelength ranges of 6
Ostwald colours and W, contrast C>288:1
Reflections R, Rr=R/0,18, Rs=log(Rr), and triangle lightness T*
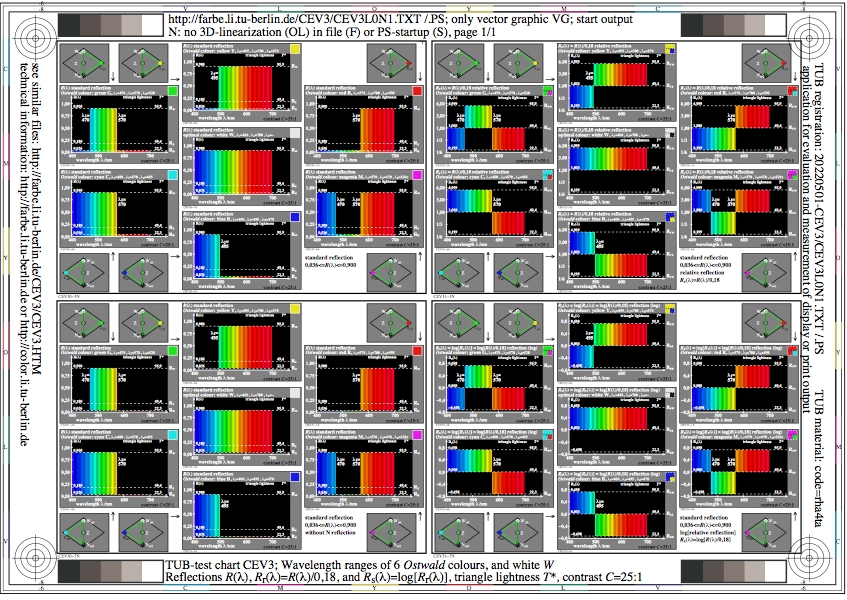
Figure CEV3L0N1.jpg: Output in format A6 of the file
CEV3L0NP.PDF, see
CEV3L0N1.
PS /
TXT /
PDF /
jpg
CEV3: TUB-test chart CEV3; Wavelength ranges of 6
Ostwald colours and W, contrast C=25:1
Reflections R, Rr=R/0,18, Rs=log(Rr), and triangle lightness
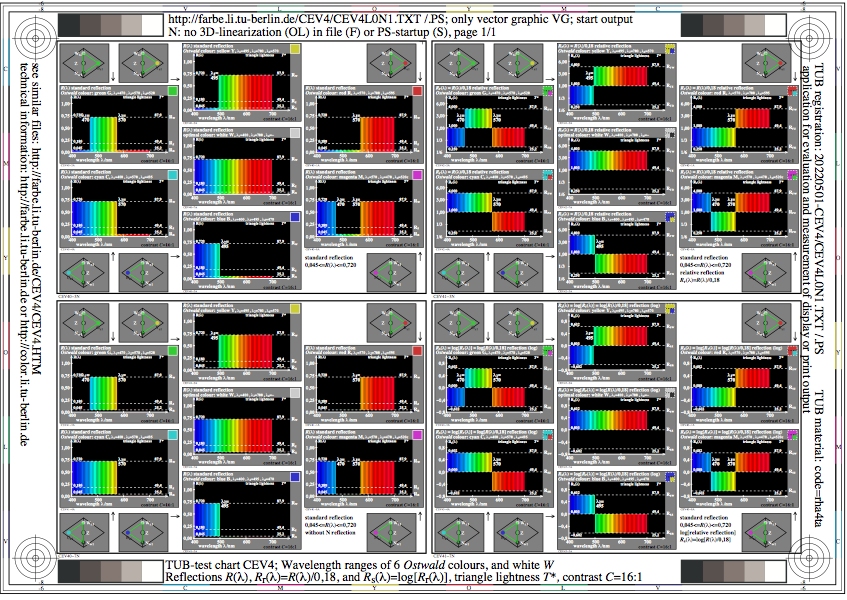
Figure CEV4L0N1.jpg: Output in format A6 of the file
CEV4L0NP.PDF, see
CEV4L0N1.
PS /
TXT /
PDF /
jpg
CEV4: TUB-test chart CEV4; Wavelength ranges of 6
Ostwald colours and W, contrast C=16:1
Reflections R, Rr=R/0,18, Rs=log(Rr), and triangle lightness

Figure CEV5L0N1.jpg: Output in format A6 of the file
CEV5L0NP.PDF, see
CEV5L0N1.
PS /
TXT /
PDF /
jpg
CEV5: TUB-test chart CEV5; Wavelength ranges of 6
Ostwald colours and W, contrast C=9:1
Reflections R, Rr=R/0,18, Rs=log(Rr), and triangle lightness
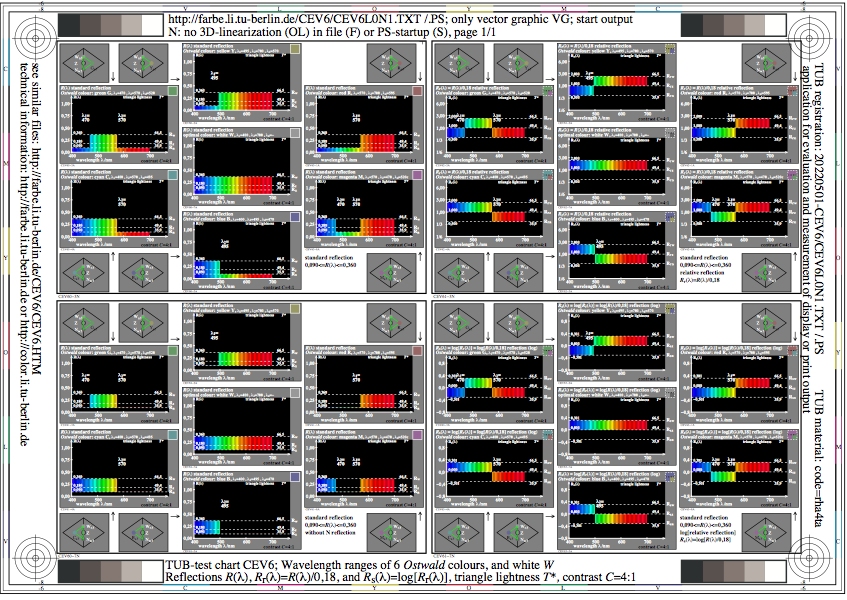
Figure CEV6L0N1.jpg: Output in format A6 of the file
CEV6L0NP.PDF, see
CEV6L0N1.
PS /
TXT /
PDF /
jpg
CEV6: TUB-test chart CEV6; Wavelength ranges of 6
Ostwald colours and W, contrast C=4:1
Reflections R, Rr=R/0,18, Rs=log(Rr), and triangle lightness
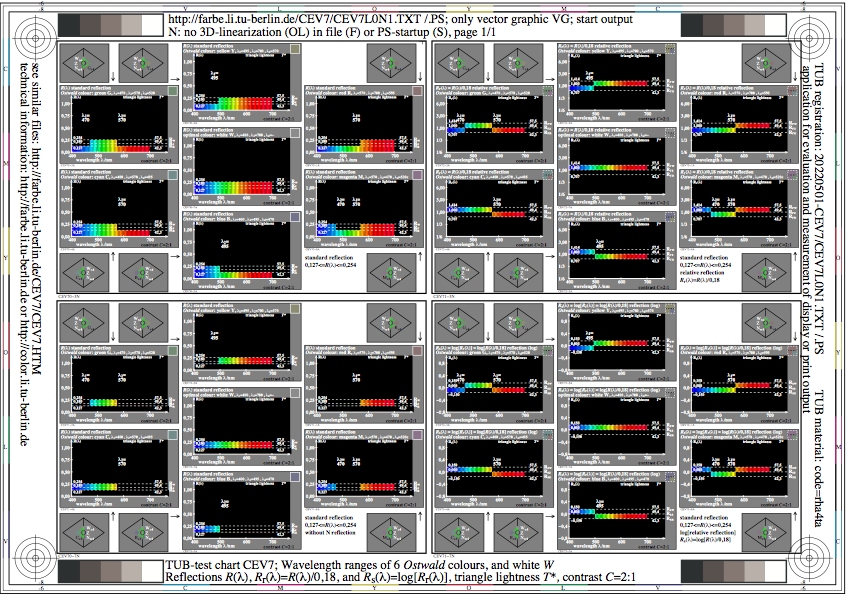
Figure CEV7L0N1.jpg: Output in format A6 of the file
CEV7L0NP.PDF, see
CEV7L0N1.
PS /
TXT /
PDF /
jpg
CEV7: TUB-test chart CEV7; Wavelength ranges of 6
Ostwald colours and W, contrast C=2:1
Reflections R, Rr=R/0,18, Rs=log(Rr), and triangle lightness

Figure CEV8L0N1.jpg: Output in format A6 of the file
CEV8L0NP.PDF, see
CEV8L0N1.
PS /
TXT /
PDF /
jpg
CEV8: TUB-test chart CEV8; Wavelength ranges of 6
Ostwald colours and W, contrast C=25:1, +-signals
Reflections R, Rr=R/0,18, Rs=log(Rr), and triangle lightness
Figure CEV9L0N1.jpg: Output in format A6 of the file
CEV9L0NP.PDF, see
CEV9L0N1.
PS /
TXT /
PDF /
jpg
CEV9: TUB-test chart CEV9; Wavelength ranges of 6
Ostwald colours and W, contrast C=2:1, +-signals
Reflections R, Rr=R/0,18, Rs=log(Rr), and triangle lightness
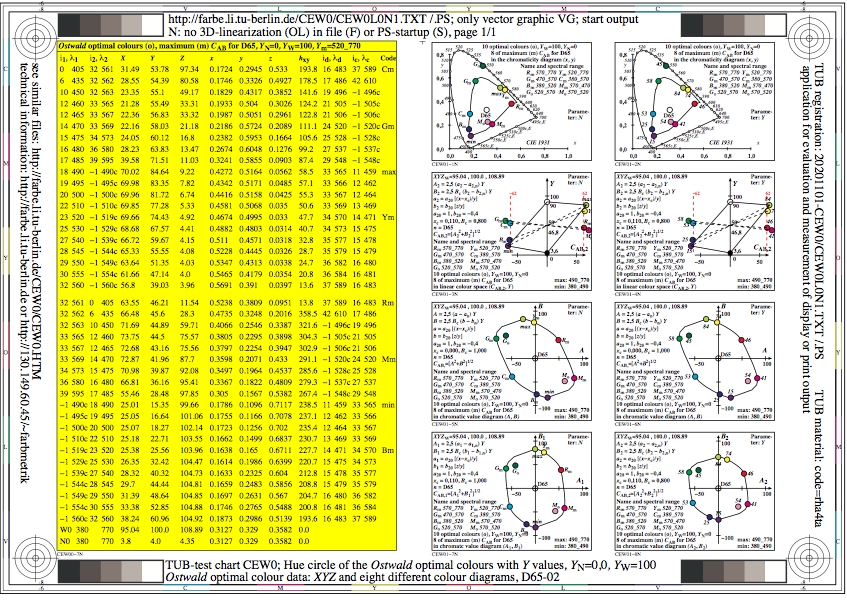
Figure CEW0L0N1.jpg: Output in format A6 of the file
CEW0L0NP.PDF, see
CEW0L0N1.
PS /
TXT /
PDF /
jpg
CEW0: TUB-test chart CEW0; Ostwald-optimal colours
YN=0, YW=100, CIE illuminant D65, CIE 02 degree
XYZ data of hue circle in 8 colour diagrams

Figure CEW1L0N1.jpg: Output in format A6 of the file
CEW1L0NP.PDF, see
CEW1L0N1.
PS /
TXT /
PDF /
jpg
CEW1: TUB-test chart CEW1; Ostwald-optimal colours
YN=0, YW=100, CIE illuminant D65, CIE 02 degree
Data XYZ and YABCh as table with wavelength

Figure CEW2L0N1.jpg: Output in format A6 of the file
CEW2L0NP.PDF, see
CEW2L0N1.
PS /
TXT /
PDF /
jpg
CEW2: TUB-test chart CEW2; Ostwald-optimal colours
YN=0, YW=100, CIE illuminant D65, CIE 02 degree
Data YABCh1 and YABCh2 as table with wavelength

Figure CEW3L0N1.jpg: Output in format A6 of the file
CEW3L0NP.PDF, see
CEW3L0N1.
PS /
TXT /
PDF /
jpg
CEW3: TUB-test chart CEW3; Ostwald-optimal colours
YN=0, YW=100, CIE illuminant D65, CIE 10 degree
XYZ data and 8 colour diagrams

Figure CEW4L0N1.jpg: Output in format A6 of the file
CEW4L0NP.PDF, see
CEW4L0N1.
PS /
TXT /
PDF /
jpg
CEW4: TUB-test chart CEW4; Ostwald-optimal colours
YN=0, YW=100, CIE illuminant D65, CIE 10 degree
Data XYZ and YABCh as table with wavelength
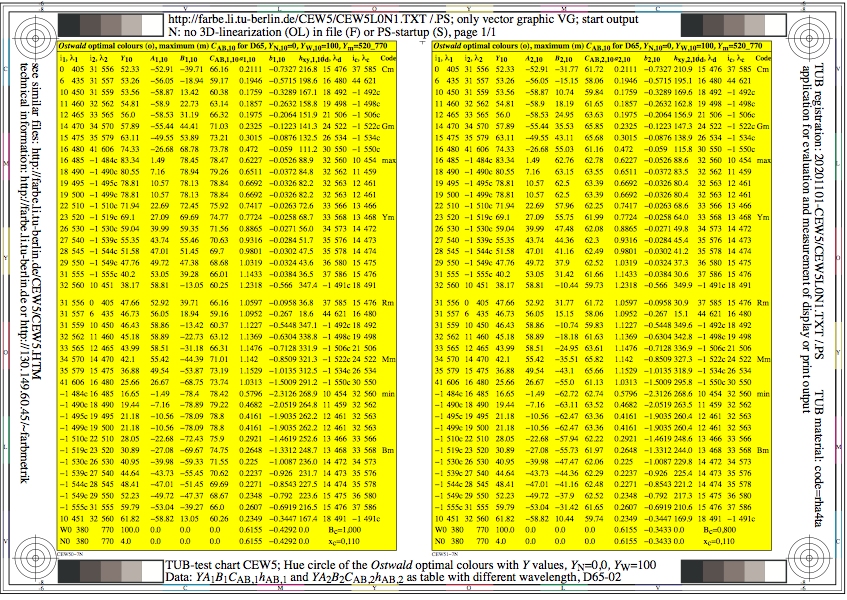
Figure CEW5L0N1.jpg: Output in format A6 of the file
CEW5L0NP.PDF, see
CEW5L0N1.
PS /
TXT /
PDF /
jpg
CEW5: TUB-test chart CEW5;Ostwald-optimal colours
YN=0, YW=100, CIE illuminant D65, CIE 10 degree
Data YABCh1 and YABCh2 as table with wavelength

Figure CEW6L0N1.jpg: Output in format A6 of the file
CEW6L0NP.PDF, see
CEW6L0N1.
PS /
TXT /
PDF /
jpg
CEW6: TUB-test chart CEW6; Ostwald-optimal colours
YN=0, YW=100, CIE illuminant D50, CIE 02 degree
XYZ data of hue circle 8 colour diagrams

Figure CEW7L0N1.jpg: Output in format A6 of the file
CEW7L0NP.PDF, see
CEW7L0N1.
PS /
TXT /
PDF /
jpg
CEW7: TUB-test chart CEW7; Ostwald-optimal colours
YN=0, YW=100, CIE illuminant D50, CIE 02 degree
Data XYZ and YABCh as table with wavelength
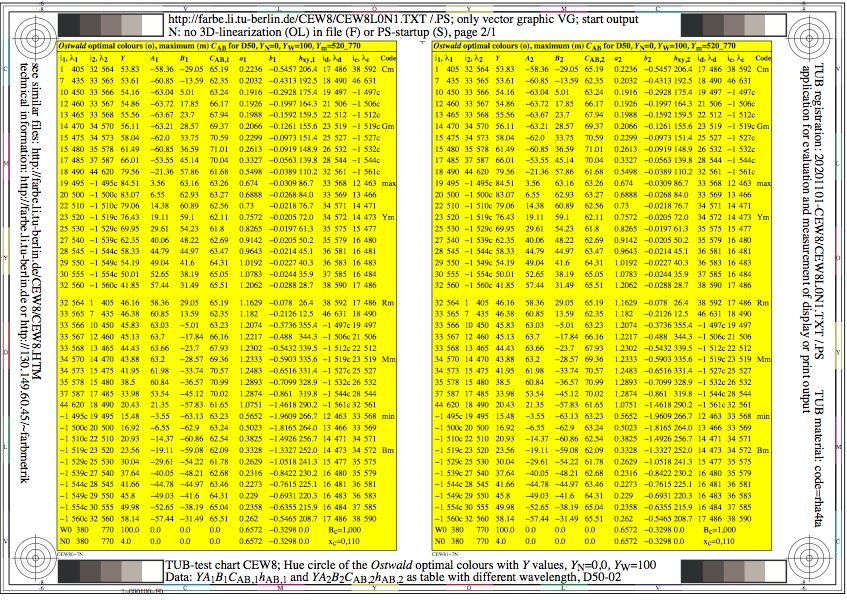
Figure CEW8L0N1.jpg: Output in format A6 of the file
CEW8L0NP.PDF, see
CEW8L0N1.
PS /
TXT /
PDF /
jpg
CEW8: TUB-test chart CEW8; Ostwald-optimal colours
YN=0, YW=100, CIE illuminant D50, CIE 02 degree
Data YABCh1 and YABCh2 as table with wavelength
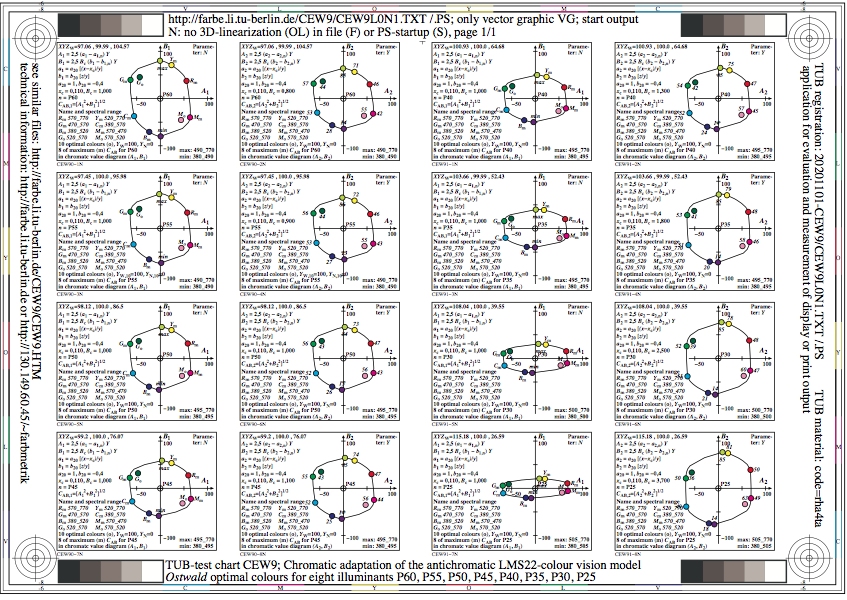
Figure CEW9L0N1.jpg: Output in format A6 of the file
CEW9L0NP.PDF, see
CEW9L0N1.
PS /
TXT /
PDF /
jpg
CEW9: TUB-test chart CEW9; Chromatic adaptation of LMS22 model
Ostwald-optimal colours for 8 illuminants:
P60 (6000K), P55, P50, P45, P40, P35, P30, P25 (2500K)

Figure CEX0L0N1.jpg: Output in format A6 of the file
CEX0L0NP.PDF, see
CEX0L0N1.
PS /
TXT /
PDF /
jpg
CEX0: TUB-test chart CEX0; Ostwald-optimal colours
YN=0, YW=100, 8 illuminants Dxx, CIE 02 degree
XYZ data of hue circle in 8 colour diagrams
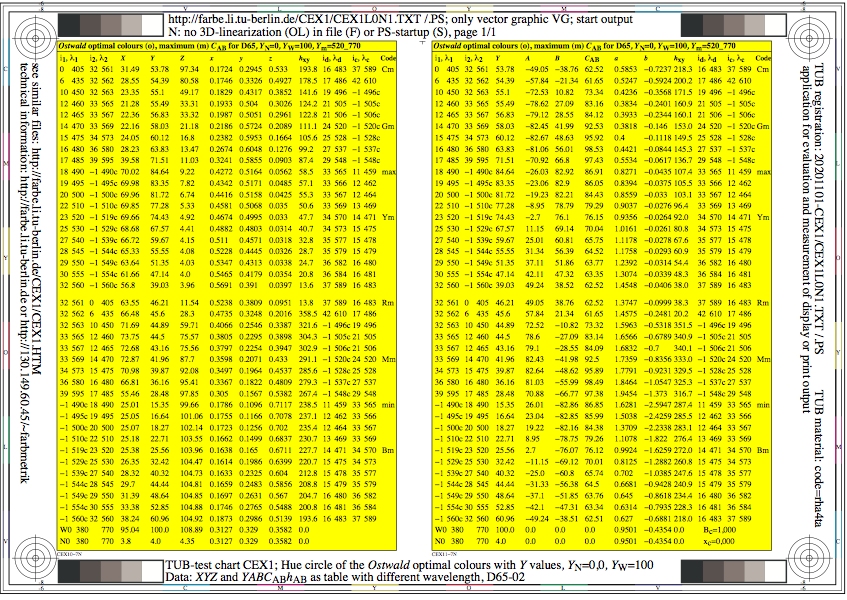
Figure CEX1L0N1.jpg: Output in format A6 of the file
CEX1L0NP.PDF, see
CEX1L0N1.
PS /
TXT /
PDF /
jpg
CEX1: TUB-test chart CEX1; Ostwald-optimal colours
YN=0, YW=100, 8 illuminants Dxx, CIE 02 degree
Data XYZ and YABCh as table with wavelength
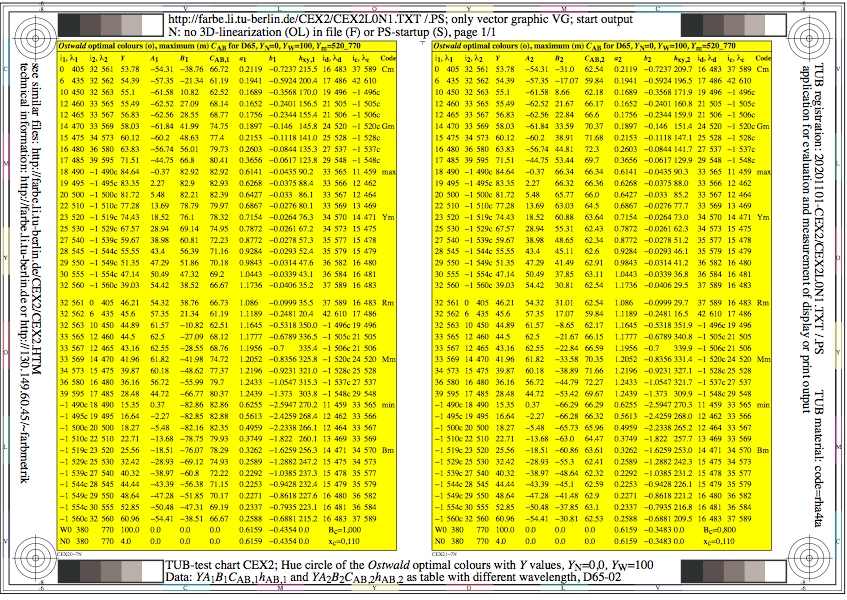
Figure CEX2L0N1.jpg: Output in format A6 of the file
CEX2L0NP.PDF, see
CEX2L0N1.
PS /
TXT /
PDF /
jpg
CEX2: TUB-test chart CEX2; Ostwald-optimal colours
YN=0, YW=100, 8 illuminants Dxx, CIE 02 degree
Data YABCh1 and YABCh2 as table with wavelength

Figure CEX3L0N1.jpg: Output in format A6 of the file
CEX3L0NP.PDF, see
CEX3L0N1.
PS /
TXT /
PDF /
jpg
CEX3: TUB-test chart CEX3; Ostwald-optimal colours
YN=0, YW=100, 8 illuminants Dxx, CIE 10 degree
XYZ data of hue circle in 8 colour diagrams
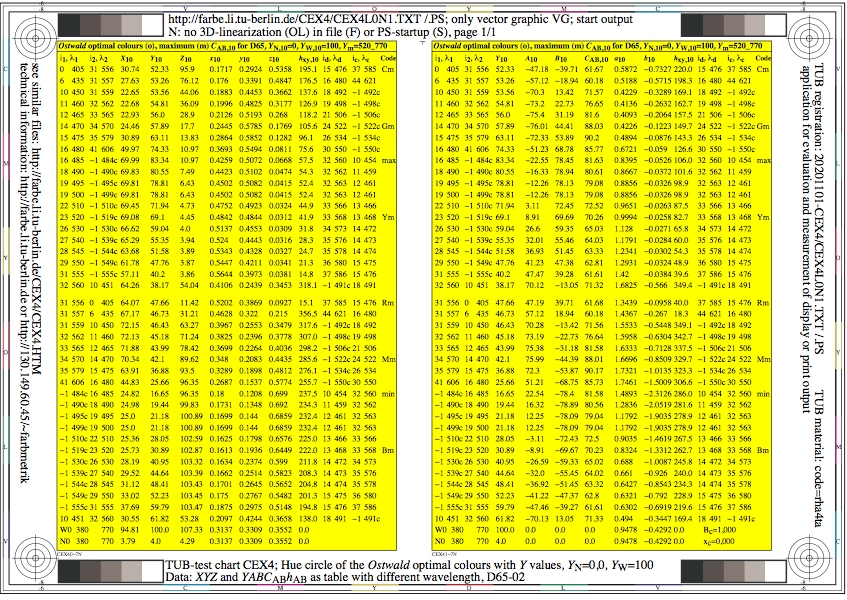
Figure CEX4L0N1.jpg: Output in format A6 of the file
CEX4L0NP.PDF, see
CEX4L0N1.
PS /
TXT /
PDF /
jpg
CEX4: TUB-test chart CEX4; Ostwald-optimal colours
YN=0, YW=100, 8 illuminants Dxx, CIE 10 degree
Data XYZ and YABCh as table with wavelength

Figure CEX5L0N1.jpg: Output in format A6 of the file
CEX5L0NP.PDF, see
CEX5L0N1.
PS /
TXT /
PDF /
jpg
CEX5: TUB-test chart CEX5;Ostwald-optimal colours
YN=0, YW=100, 8 illuminants Dxx, CIE 10 degree
Data YABCh1 and YABCh2 as table with wavelength

Figure CEX6L0N1.jpg: Output in format A6 of the file
CEX6L0NP.PDF, see
CEX6L0N1.
PS /
TXT /
PDF /
jpg
CEX6: TUB-test chart CEX6; Ostwald-optimal colours
YN=0, YW=100, 8 illuminants Pxx, CIE 02 degree
XYZ data of hue circle in 8 colour diagrams

Figure CEX7L0N1.jpg: Output in format A6 of the file
CEX7L0NP.PDF, see
CEX7L0N1.
PS /
TXT /
PDF /
jpg
CEX7: TUB-test chart CEX7; Ostwald-optimal colours
YN=0, YW=100, 8 illuminants Pxx, CIE 02 degree
Data XYZ and YABCh as table with wavelength
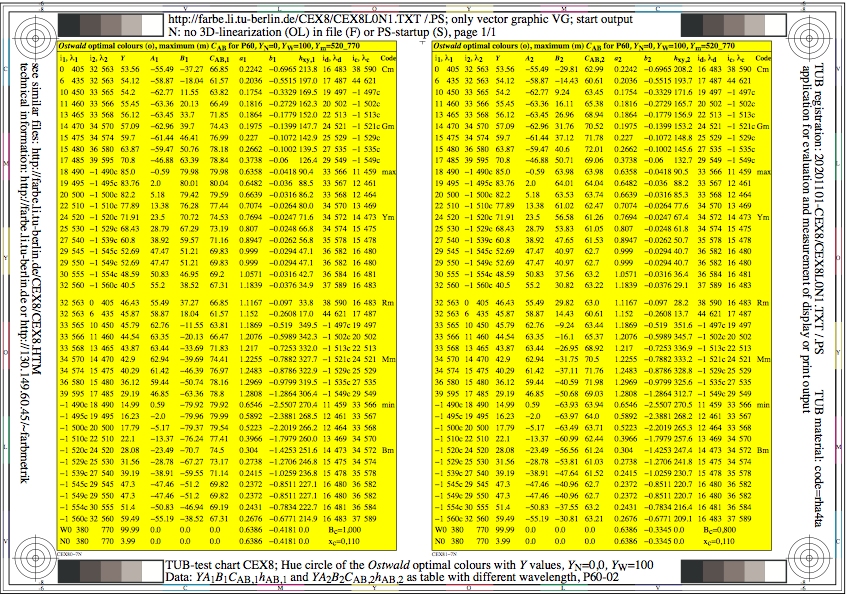
Figure CEX8L0N1.jpg: Output in format A6 of the file
CEX8L0NP.PDF, see
CEX8L0N1.
PS /
TXT /
PDF /
jpg
CEX8: TUB-test chart CEX8; Ostwald-optimal colours
YN=0, YW=100, 8 illuminants Pxx, CIE 02 degree
Data YABCh1 and YABCh2 as table with wavelength
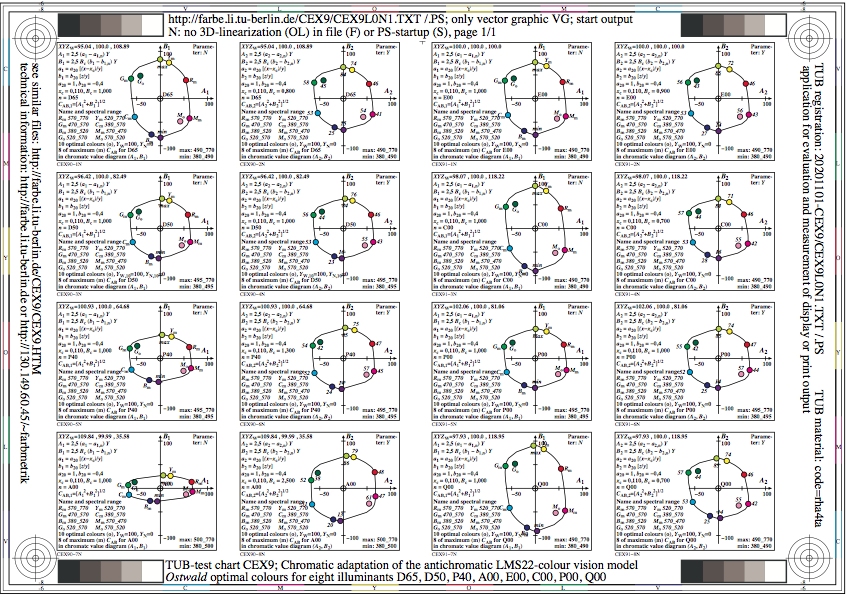
Figure CEX9L0N1.jpg: Output in format A6 of the file
CEX9L0NP.PDF, see
CEX9L0N1.
PS /
TXT /
PDF /
jpg
CEX9: TUB-test chart CEX9; Chromatic adaptation of LMS22 model
Ostwald-optimal colours for 8 illuminants:
D65 (6500K), D50, P40 (4000K), A00, E00, C00, P00, Q00
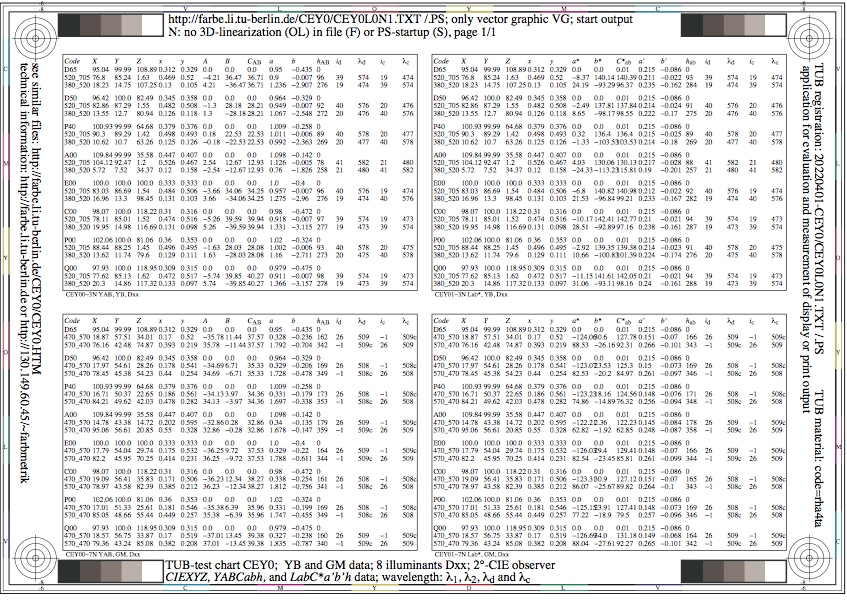
Figure CEY0L0N1.jpg: Output in format A6 of the file
CEY0L0NP.PDF, see
CEY0L0N1.
PS /
TXT /
PDF /
jpg
CEY0: TUB-test chart CEY0; YB and GM data for 8 Dxx illuminants
CIE 2 and 10 degree observer, CIEXYZ, LABJND, and CIELAB data
YABCabh data, wavelength lamda(1,2,d,c) of Ostwald colors
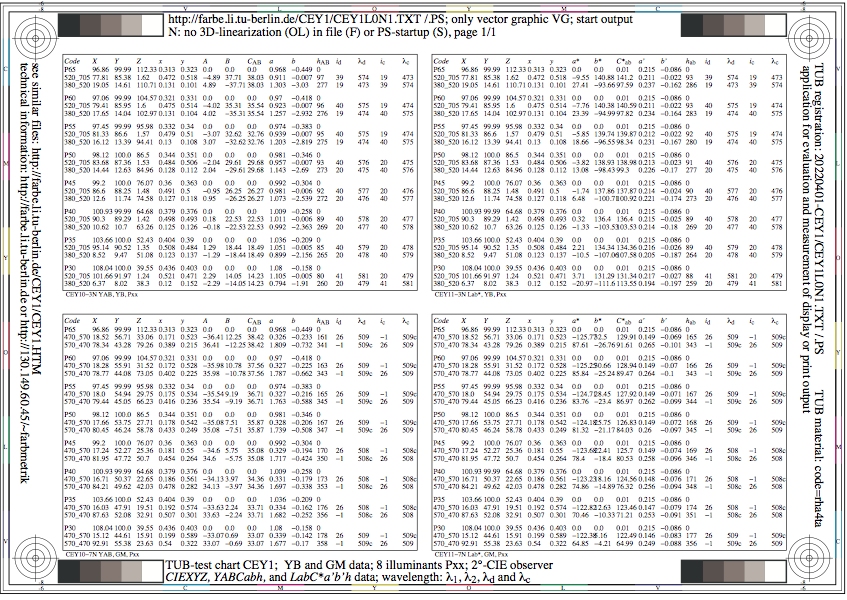
Figure CEY1L0N1.jpg: Output in format A6 of the file
CEY1L0NP.PDF, see
CEY1L0N1.
PS /
TXT /
PDF /
jpg
CEY1: TUB-test chart CEY1; YB and GM data for 8 Pxx illuminants
CIE 2 and 10 degree observer, CIEXYZ, LABJND, and CIELAB data
YABCabh data, wavelength lamda(1,2,d,c) of Ostwald colors

Figure CEY2L0N1.jpg: Output in format A6 of the file
CEY2L0NP.PDF, see
CEY2L0N1.
PS /
TXT /
PDF /
jpg
CEY2: TUB-test chart CEY2; YB and GM data for 8 Dxx illuminants
CIE 2 and 10 degree observer, CIEXYZ, LABJND1, and LABJND2 data
YABCabh(1&2) data, wavelength lamda(1,2,d,c) of Ostwald colors
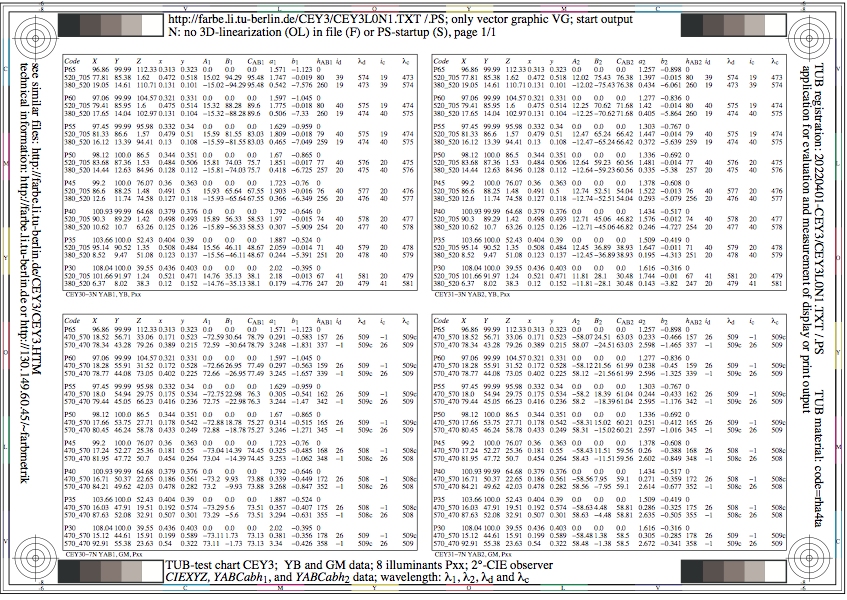
Figure CEY3L0N1.jpg: Output in format A6 of the file
CEY3L0NP.PDF, see
CEY3L0N1.
PS /
TXT /
PDF /
jpg
CEY3: TUB-test chart CEY3; YB and GM data for 8 Pxx illuminants
CIE 2 and 10 degree observer, CIEXYZ, LABJND1, and LABJND2 data
YABCabh(1&2) data, wavelength lamda(1,2,d,c) of Ostwald colors
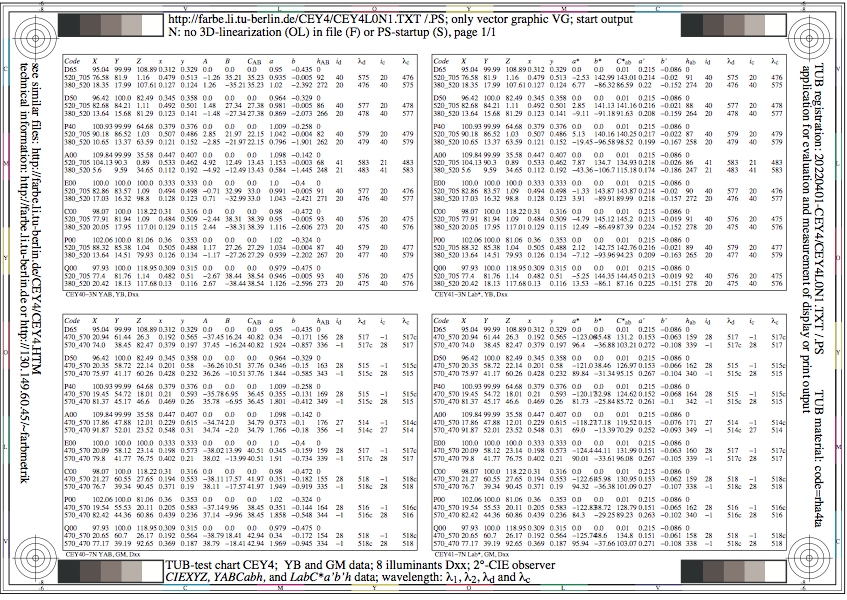
Figure CEY4L0N1.jpg: Output in format A6 of the file
CEY4L0NP.PDF, see
CEY4L0N1.
PS /
TXT /
PDF /
jpg
CEY4: TUB-test chart CEY4; YB and GM data for 8 Dxx illuminants
CIE 2 and 10 degree observer, CIEXYZ, LABJND, and CIELAB data
YABCabh data, wavelength lamda(1,2,d,c) of Ostwald colors
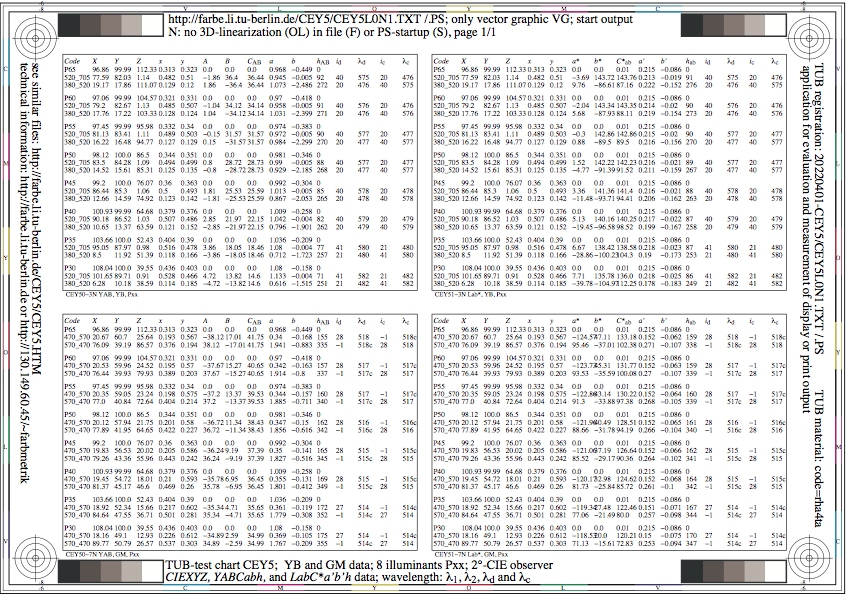
Figure CEY5L0N1.jpg: Output in format A6 of the file
CEY5L0NP.PDF, see
CEY5L0N1.
PS /
TXT /
PDF /
jpg
CEY5: TUB-test chart CEY5; YB and GM data for 8 Pxx illuminants
CIE 2 and 10 degree observer, CIEXYZ, LABJND, and CIELAB data
YABCabh data, wavelength lamda(1,2,d,c) of Ostwald colors
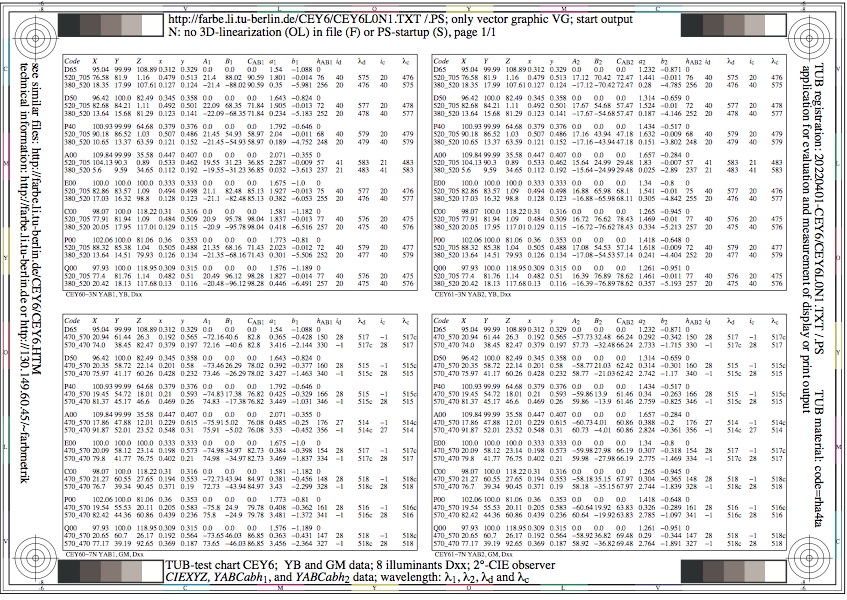
Figure CEY6L0N1.jpg: Output in format A6 of the file
CEY6L0NP.PDF, see
CEY6L0N1.
PS /
TXT /
PDF /
jpg
CEY6: TUB-test chart CEY6; YB and GM data for 8 Dxx illuminants
CIE 2 and 10 degree observer, CIEXYZ, LABJND1, and LABJND2 data
YABCabh(1&2) data, wavelength lamda(1,2,d,c) of Ostwald colors
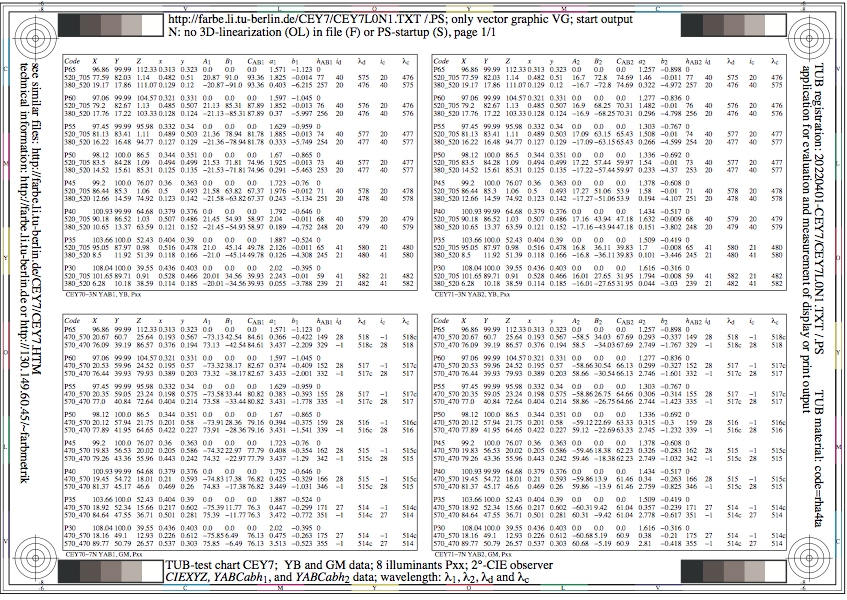
Figure CEY7L0N1.jpg: Output in format A6 of the file
CEY7L0NP.PDF, see
CEY7L0N1.
PS /
TXT /
PDF /
jpg
CEY7: TUB-test chart CEY7; YB and GM data for 8 Pxx illuminants
CIE 2 and 10 degree observer, CIEXYZ, LABJND1, and LABJND2 data
YABCabh(1&2) data, wavelength lamda(1,2,d,c) of Ostwald colors
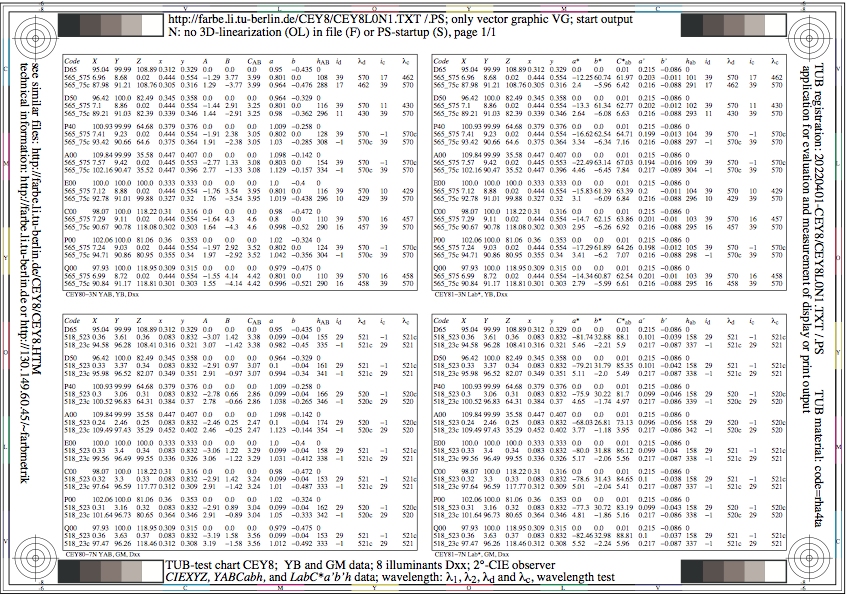
Figure CEY8L0N1.jpg: Output in format A6 of the file
CEY8L0NP.PDF, see
CEY8L0N1.
PS /
TXT /
PDF /
jpg
CEY8: TUB-test chart CEY8; YB and GM data for 8 Dxx illuminants
CIE 2 and 10 degree observer, CIEXYZ, LABJND, and CIELAB data
YABCabh data, wavelength lamda(1,2,d,c) of optimal colors
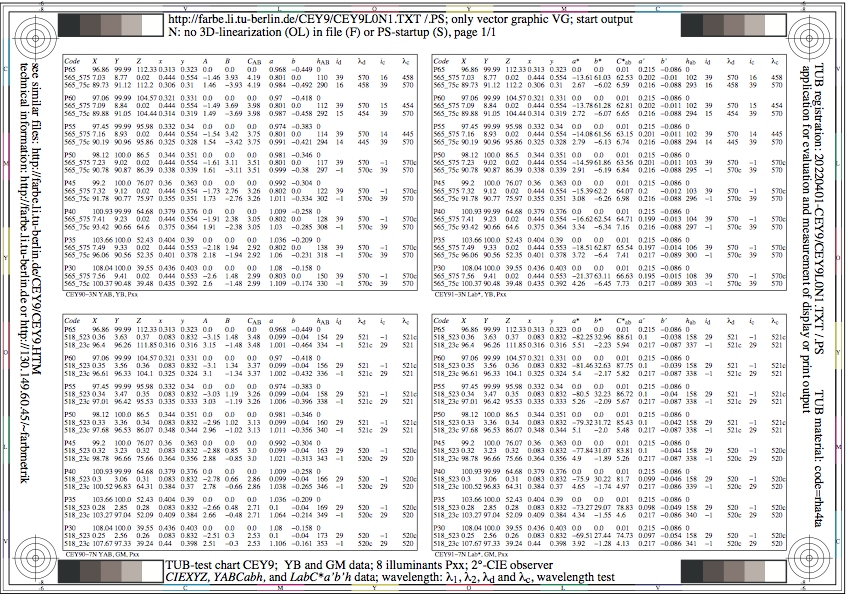
Figure CEY9L0N1.jpg: Output in format A6 of the file
CEY9L0NP.PDF, see
CEY9L0N1.
PS /
TXT /
PDF /
jpg
CEY9: TUB-test chart CEY9; YB and GM data for 8 Pxx illuminants
CIE 2 and 10 degree observer, CIEXYZ, LABJND, and CIELAB data
YABCabh data, wavelength lamda(1,2,d,c) of optimal colors
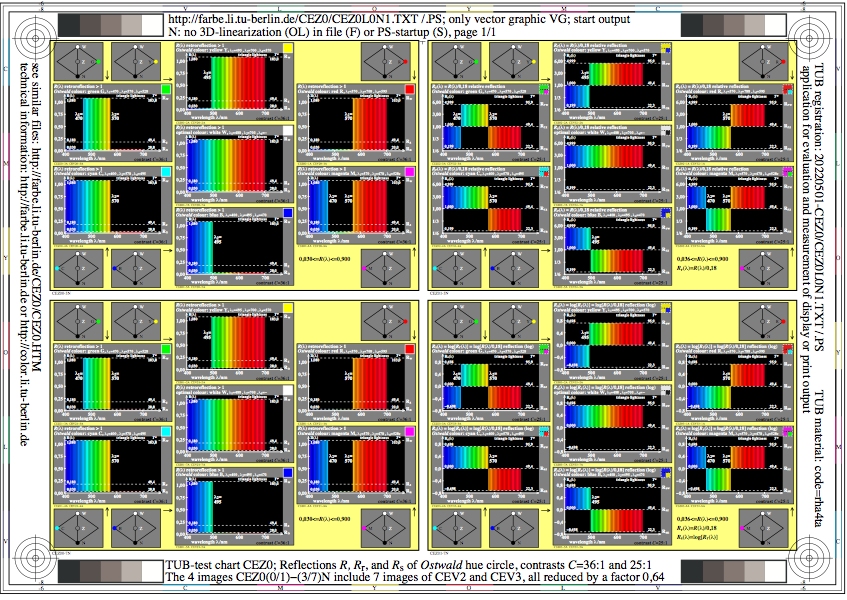
Figure CEZ0L0N1.jpg: Output in format A6 of the file
CEZ0L0NP.PDF, see
CEZ0L0N1.
PS /
TXT /
PDF /
jpg
CEZ0: TUB-test chart CEZ0; Reflections R, Rr, Rs of Ostwald-
hue circle, contrasts C=36:1 and C=25:1.
The 4 images include 7 images of CEV2 (left) and CEV3 (right)
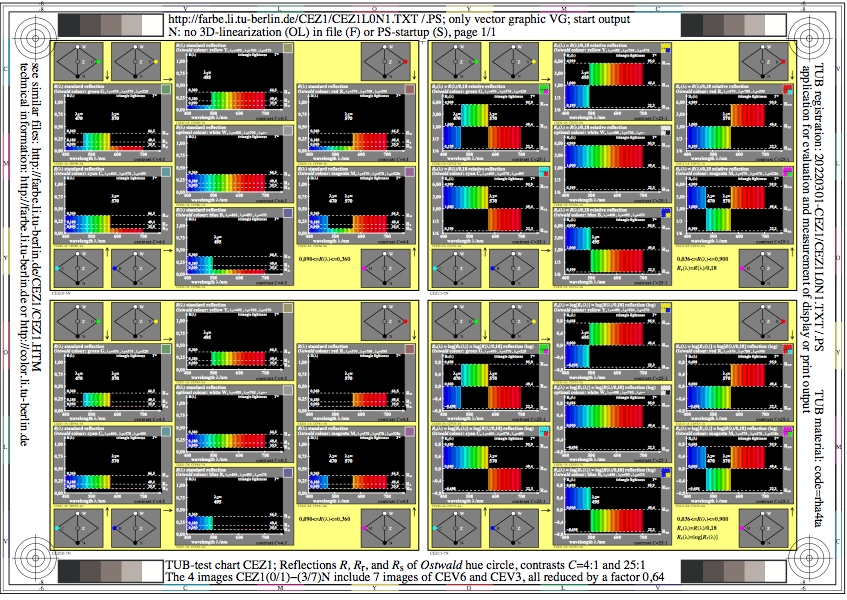
Figure CEZ1L0N1.jpg: Output in format A6 of the file
CEZ1L0NP.PDF, see
CEZ1L0N1.
PS /
TXT /
PDF /
jpg
CEZ1: TUB-test chart CEZ1; Reflections R, Rr, Rs of Ostwald-
hue circle, contrasts C=4:1 and C=25:1.
The 4 images include 7 images of CEV6 (left) and CEV3 (right)
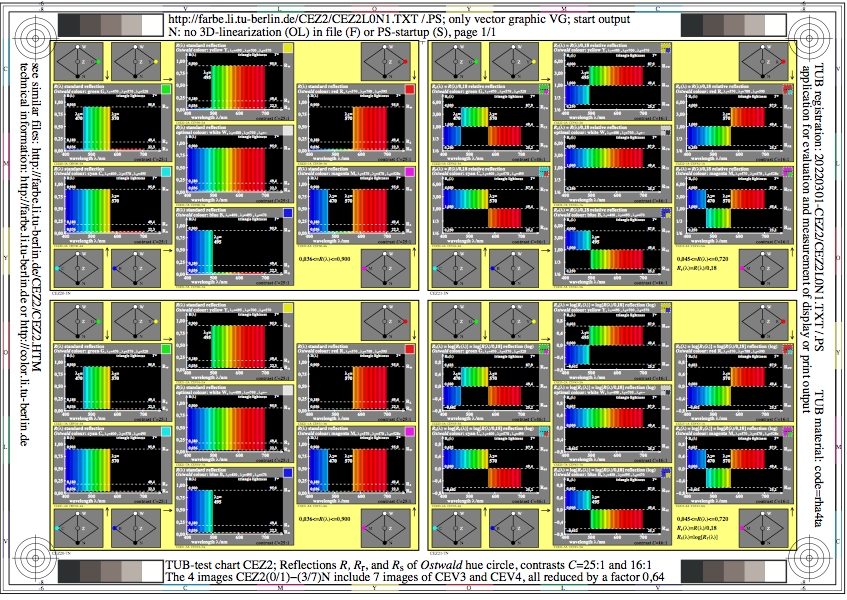
Figure CEZ2L0N1.jpg: Output in format A6 of the file
CEZ2L0NP.PDF, see
CEZ2L0N1.
PS /
TXT /
PDF /
jpg
CEZ2: TUB-test chart CEZ2; Reflection R, Rr, Rs of Ostwald-
hue circle, contrasts C=25:1 and 16:1.
The 4 images include 7 images of CEV3 (left) and CEV4 (right)
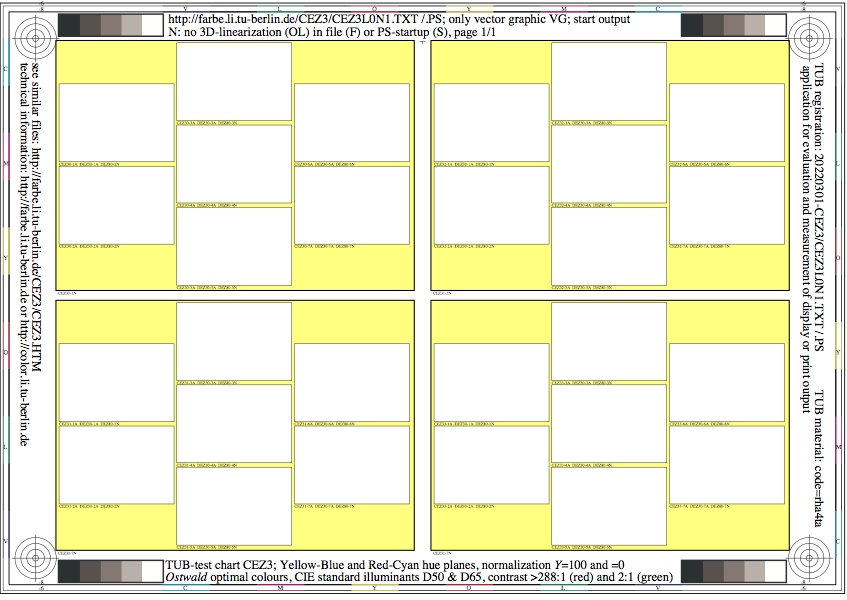
Figure CEZ3L0N1.jpg: Output in format A6 of the file
CEZ3L0NP.PDF, see
CEZ3L0N1.
PS /
TXT /
PDF /
jpg
CEZ3: TUB-test chart CEZ3; Tests for image creation based on images
combination of 4 x 7 images to 4 of circular layout
The 4 images have two sizes (120, 123)mm x 82mm
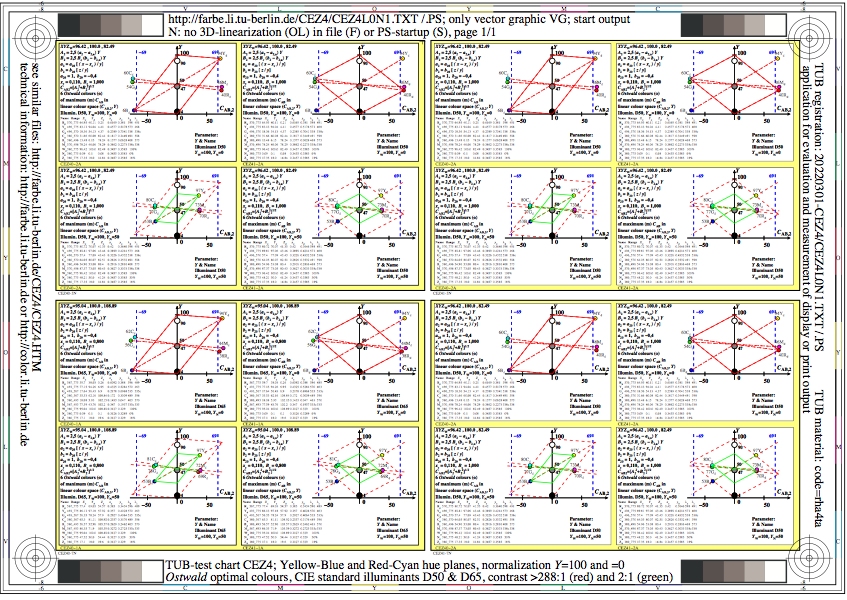
Figure CEZ4L0N1.jpg: Output in format A6 of the file
CEZ4L0NP.PDF, see
CEZ4L0N1.
PS /
TXT /
PDF /
jpg
CEZ4: TUB-test chart CEZ4; Y-B and R-C-hue planes
Ostwald-colours, standard illuminants D65 and D50,
contrasts C<288:1 (red) and 2:1 (green)

Figure CEZ5L0N1.jpg: Output in format A6 of the file
CEZ5L0NP.PDF, see
CEZ5L0N1.
PS /
TXT /
PDF /
jpg
CEZ5: TUB-test chart CEZ5; Ostwald colours
modifications blackish and whitish colours
spectrum and location in hue planes
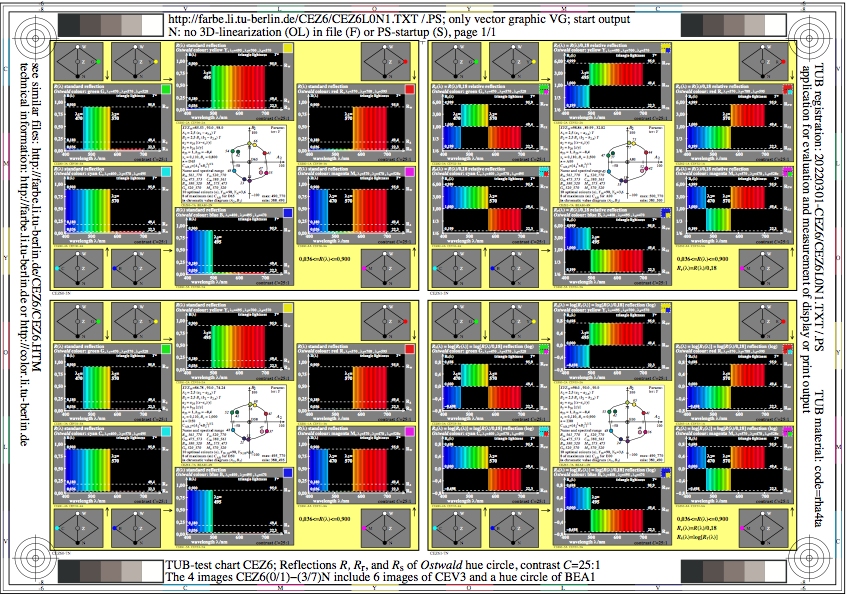
Figure CEZ6L0N1.jpg: Output in format A6 of the file
CEZ6L0NP.PDF, see
CEZ6L0N1.
PS /
TXT /
PDF /
jpg
CEZ6: TUB-test chart CEZ6; Reflections R, Rr, Rs of Ostwald-
hue circle, contrast C=25:1.
The 4 images include 7 images of CEV3 and BGA1
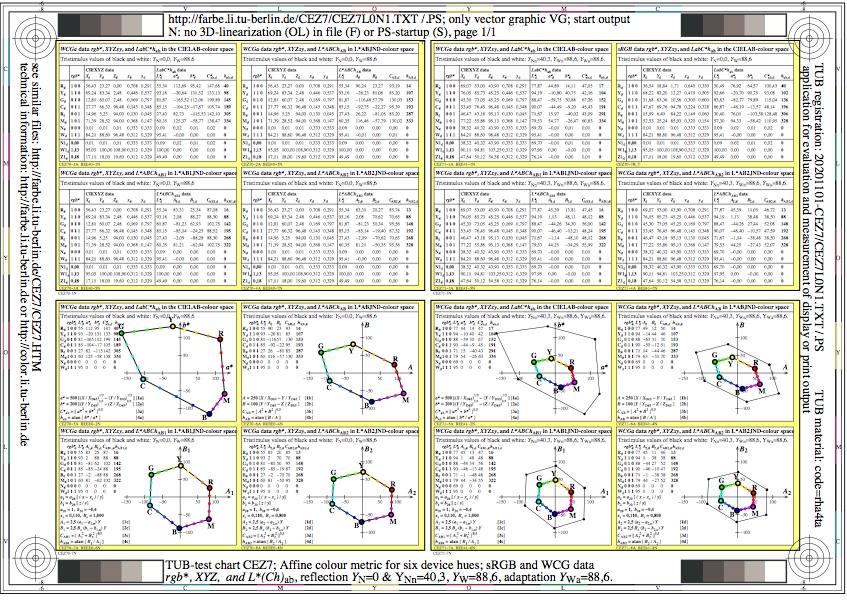
Figure CEZ7L0N1.jpg: Output in format A6 of the file
CEZ7L0NP.PDF, see
CEZ7L0N1.
PS /
TXT /
PDF /
jpg
CEZ7: TUB-test chart CEZ7; Affine colour metric: 6 device colours
sRGB data and Wide Colour Gamut WCG data, contrasts C=36:1 & 2:1
rgb*, XYZ, L*(Ch)ab, reflection YN=0 and YN=40,3, Yw=88,6
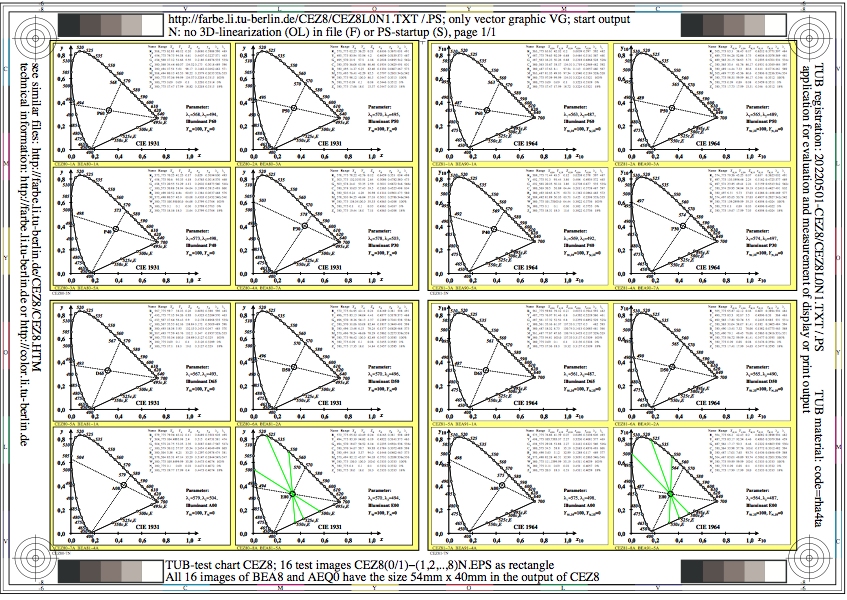
Figure CEZ8L0N1.jpg: Output in format A6 of the file
CEZ8L0NP.PDF, see
CEZ8L0N1.
PS /
TXT /
PDF /
jpg
CEZ8: TUB-test chart CEZ8; Lambda limits of Ostwald colours
for illuminants P60, P50, P40, P30, D65, D50, A, and E
Tristimulus values XYZ and XYZ10 for 8 optimal colours und grey
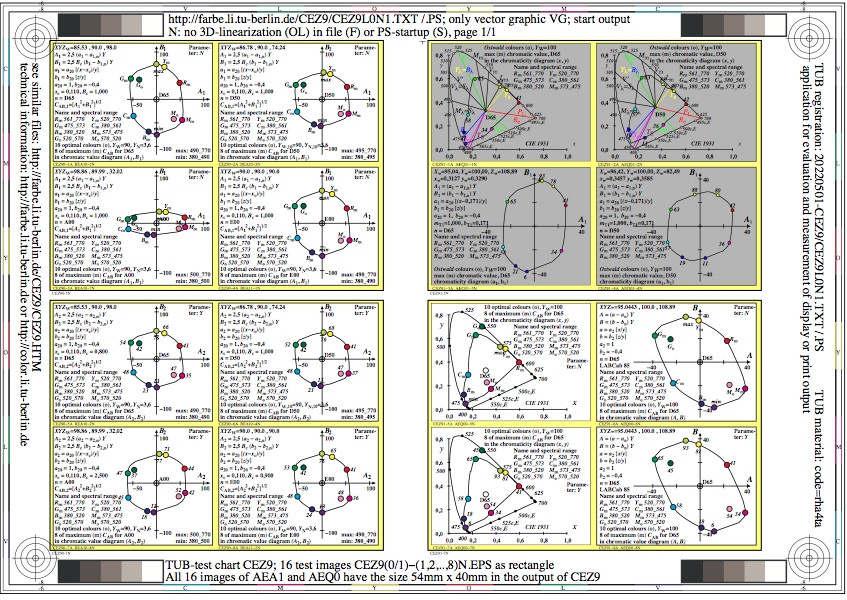
Figure CEZ9L0N1.jpg: Output in format A6 of the file
CEZ9L0NP.PDF, see
CEZ9L0N1.
PS /
TXT /
PDF /
jpg
CEZ9: TUB-test chart CEZ9; Chomatic values of Ostwald colours
for illuminants D65, D50, A, E with appropiate Bc adaptation
Chromatic values (A1, B1) and (A2, B2) of 10 optimal colours
Section 2, Chapter C:
Colour Spaces, Colour Differences, and Line Elements (2021)
This image page with 260 image series:
ce2s in English,
cg2s in German.
Previous image page:
be2s in English,
bg2s in German.
Next image page, see
de2s in English,
dg2s in German.
Introduction, content list and summary:
CEAI,
CEA_I,
CEA_S in English or
CGAI,
CGA_I,
CGA_S in German.
-------
For the archive information (2000-2009) of the BAM server "www.ps.bam.de"
(2000-2018)
about colour test charts, colorimetric calculations,
standards, and publications, see
indexAE.html in English,
indexAG.html in German.
Back to the main page of this TUB web site (NOT archive), see
index.html in English,
indexDE.html in German.