
Figure BEA0L0N1.jpg: Output in format A6 of the file BEA0L0NP.PDF, see
BEA0L0N1. PS / TXT / PDF / jpg
Section 2, Chapter B:
Colour Vision and Colorimetry (2020)
This image page with 260 image series:
be2s in English,
bg2s in German.
Previous image page:
ae2s in English,
ag2s in German.
Next image page, see
ce2s in English,
cg2s in German.
Introduction, content list and summary:
BEAI,
BEA_I,
BEA_S in English or
BGAI,
BGA_I,
BGA_S in German.
Section 2: Colourimetry, Colour Vision and Applications for Colour Image Technology (2019-2024), Image part be2s
Chapter B: Colour Vision and Colorimetry (2020)
The following 260 image series between bea0 and bez9
show the content with links to the single figures
in up to six formats.
Figure BEA0L0N1.jpg: Output in format A6 of the file
BEA0L0NP.PDF, see
BEA0L0N1.
PS /
TXT /
PDF /
jpg
BEA0: TUB-test chart BEA0; Elementary colours and chromatic adaptation
Spectrum for surface and optimal colours
Coordinates (A1, B1) and (A2,B2) for chromatic adaptation
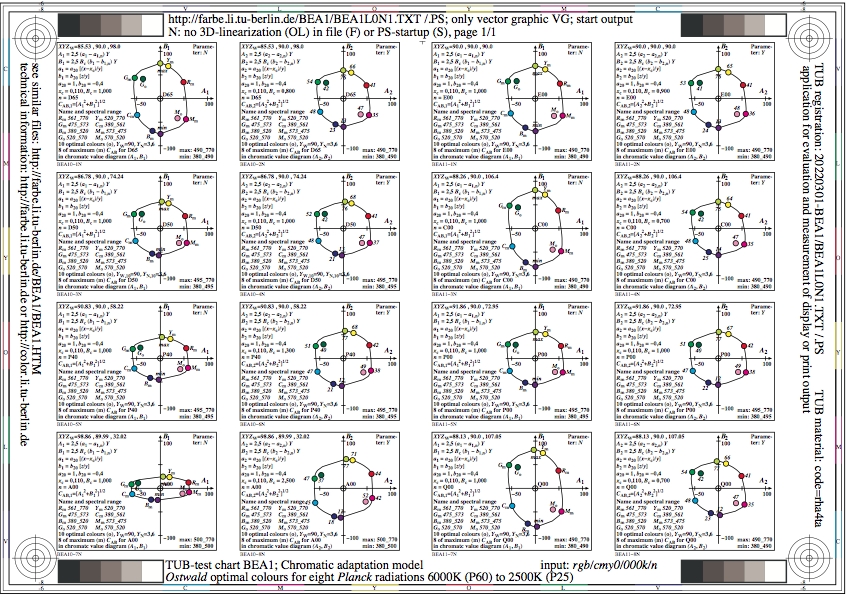
Figure BEA1L0N1.jpg: Output in format A6 of the file
BEA1L0NP.PDF, see
BEA1L0N1.
PS /
TXT /
PDF /
jpg
BEA1: TUB-test chart BEA1; Chromatic adaptation model
Ostwald-optimal colours for 8 Planck radiations
correlated colour temperatures 6000K (P60) to 2500K (P25)
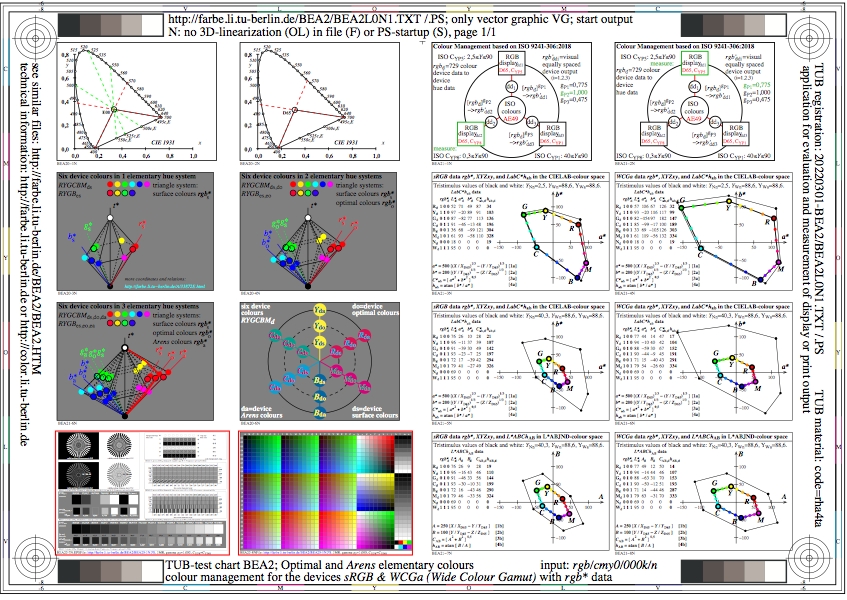
Figure BEA2L0N1.jpg: Output in format A6 of the file
BEA2L0NP.PDF, see
BEA2L0N1.
PS /
TXT /
PDF /
jpg
BEA2: TUB-test chart BEA2; Optimal and Arens-elementary colours
Colour management for the devices sRGB and WCGa
(Wide Colour Gamut) with rgb*-colour data
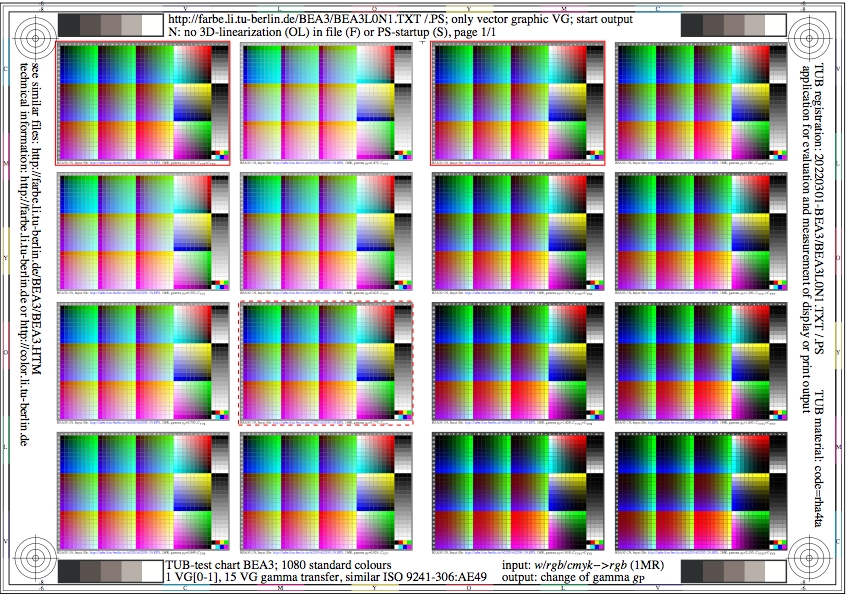
Figure BEA3L0N1.jpg: Output in format A6 of the file
BEA3L0NP.PDF, see
BEA3L0N1.
PS /
TXT /
PDF /
jpg
BEA3: TUB-test chart BEA3; 1080 standard colours, Code (row/column)
1 VG[0-1], transfer to 15 VG[0-2 to 0-8, 1-1 to 1-8]
15 VG with 0,475<=gp<=2,105, similar to ISO 9241-306:AG4
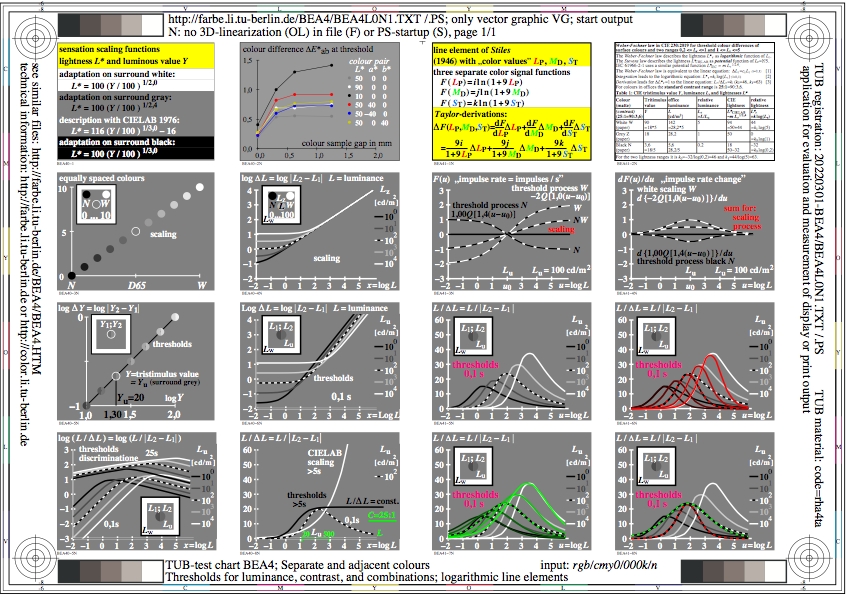
Figure BEA4L0N1.jpg: Output in format A6 of the file
BEA4L0NP.PDF, see
BEA4L0N1.
PS /
TXT /
PDF /
jpg
BEA4: TUB-test chart BEA4; Separate and adjacent colours
Thresholds for luminance, contrast, and combinations
Logarithmic line elements for colour and contrast

Figure BEA5L0N1.jpg: Output in format A6 of the file
BEA5L0NP.PDF, see
BEA5L0N1.
PS /
TXT /
PDF /
jpg
BEA5: TUB-test chart BEA5; Central and 5 surround-field luminances
Thresholds for luminance, and lightness;
experimental data of Lingelbach & Richter

Figure BEA6L0N1.jpg: Output in format A6 of the file
BEA6L0NP.PDF, see
BEA6L0N1.
PS /
TXT /
PDF /
jpg
BEA6: TUB-test chart BEA6; Criteria for elementary hues
Thresholds in NW, RG and YB direction as function of Y
Colour-difference formula LABJND and metric with (a, b) & Y
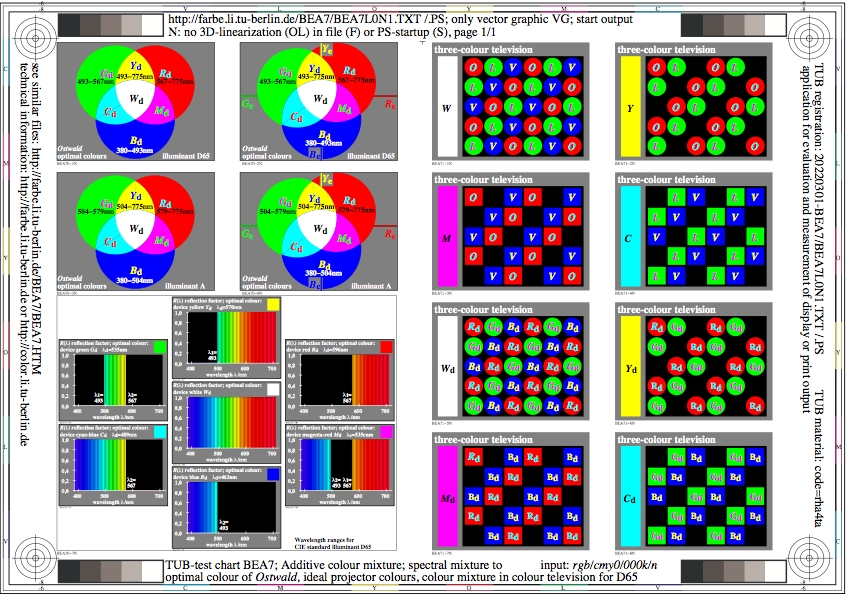
Figure BEA7L0N1.jpg: Output in format A6 of the file
BEA7L0NP.PDF, see
BEA7L0N1.
PS /
TXT /
PDF /
jpg
BEA7: TUB-test chart BEA7; Additive colour mixture, spectral
mixture to optimal colours of Ostwald, ideal
projector colours, colour mixture in colour television to D65
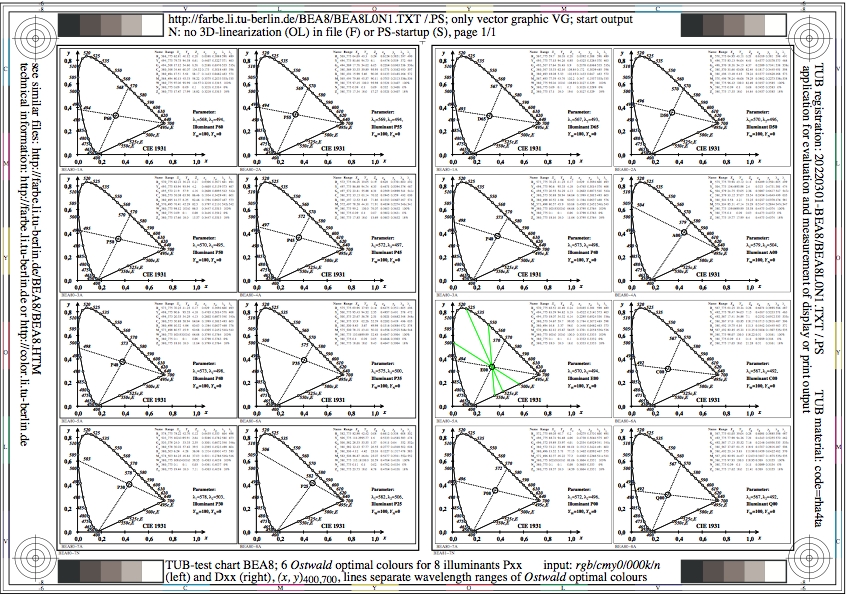
Figure BEA8L0N1.jpg: Output in format A6 of the file
BEA8L0NP.PDF, see
BEA8L0N1.
PS /
TXT /
PDF /
jpg
BEA8: TUB-test chart BEA8; Complementary spectral colours
for the calculation of Ostwald optimal colours for
8 illuminants Pxx and Dxx, and the CIE-02-degree observer
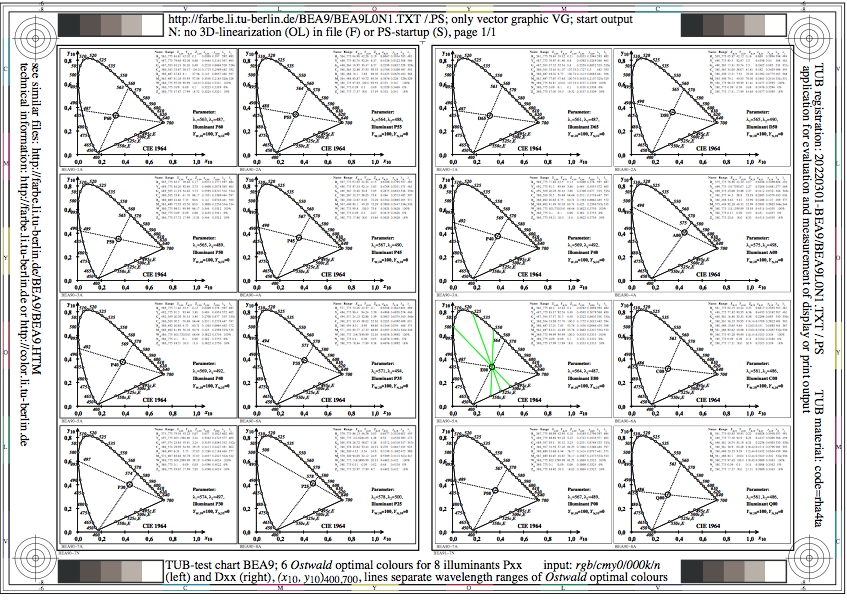
Figure BEA9L0N1.jpg: Output in format A6 of the file
BEA9L0NP.PDF, see
BEA9L0N1.
PS /
TXT /
PDF /
jpg
BEA9: TUB-test chart BEA9; Complementary spectral colours
for the calculation of Ostwald optimal colours for
8 illuminants Pxx and Dxx, and the CIE-10-degree observer
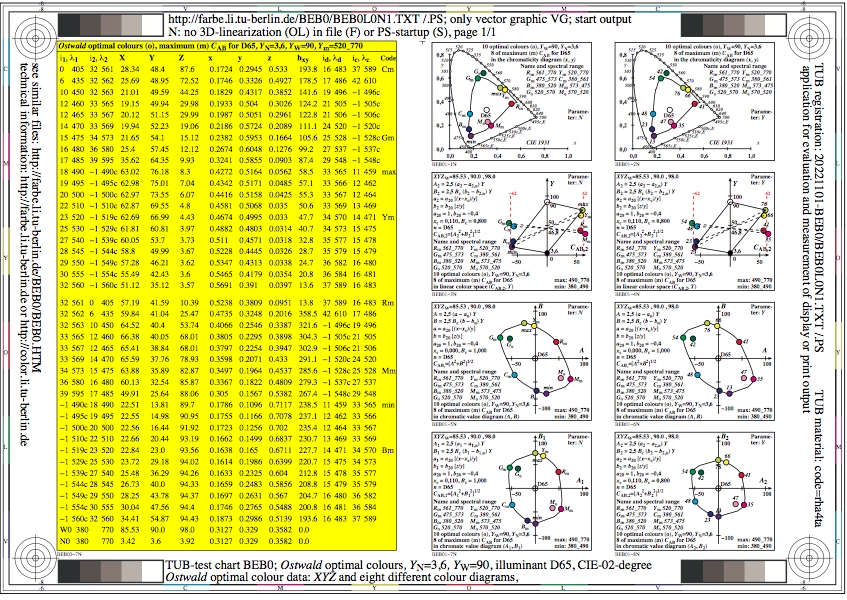
Figure BEB0L0N1.jpg: Output in format A6 of the file
BEB0L0NP.PDF, see
BEB0L0N1.
PS /
TXT /
PDF /
jpg
BEB0: TUB-test chart BEB0; Ostwald-optimal colours
YN=3,6, YW=90, CIE illuminant D65, CIE 02 degree
XYZ data, wavelength limits, and 8 colour diagrams
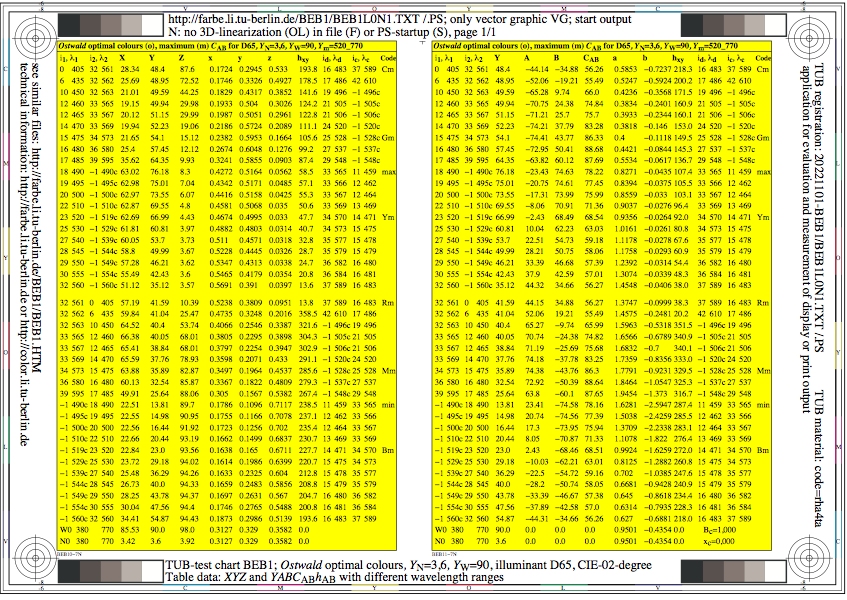
Figure BEB1L0N1.jpg: Output in format A6 of the file
BEB1L0NP.PDF, see
BEB1L0N1.
PS /
TXT /
PDF /
jpg
BEB1: TUB-test chart BEB1; Ostwald-optimal colours
YN=3,6, YW=90, CIE illuminant D65, CIE 02 degree
Table data XYZ and YABCh with wavelength limits
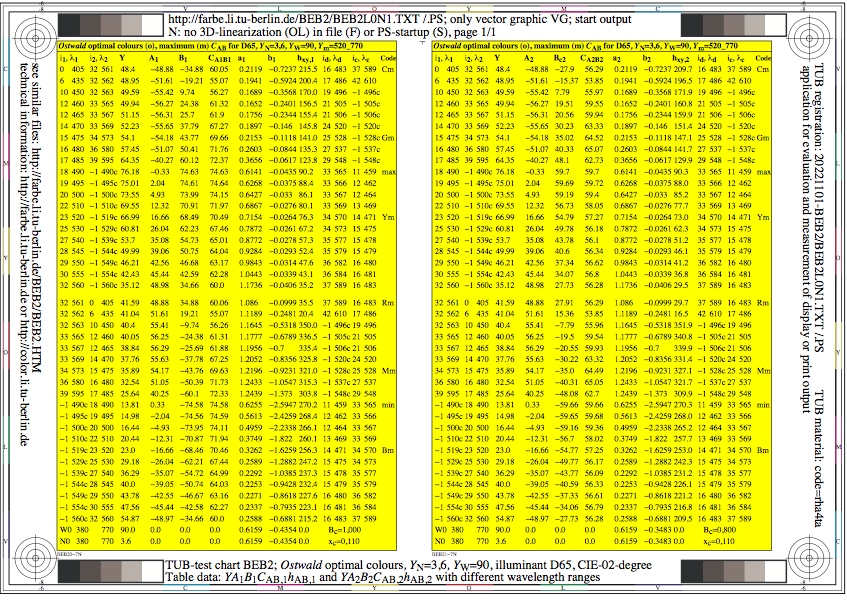
Figure BEB2L0N1.jpg: Output in format A6 of the file
BEB2L0NP.PDF, see
BEB2L0N1.
PS /
TXT /
PDF /
jpg
BEB2: TUB-test chart BEB2; Ostwald-optimal colours
YN=3,6, YW=90, CIE illuminant D65, CIE 02 degree
Table data YABCh1 and YABCh2 with wavelength limits

Figure BEB3L0N1.jpg: Output in format A6 of the file
BEB3L0NP.PDF, see
BEB3L0N1.
PS /
TXT /
PDF /
jpg
BEB3: TUB-test chart BEB3; Ostwald-optimal colours
YN=3,6, YW=90, CIE illuminant A, CIE 02 degree
XYZ data, wavelength limits, and 8 colour diagrams
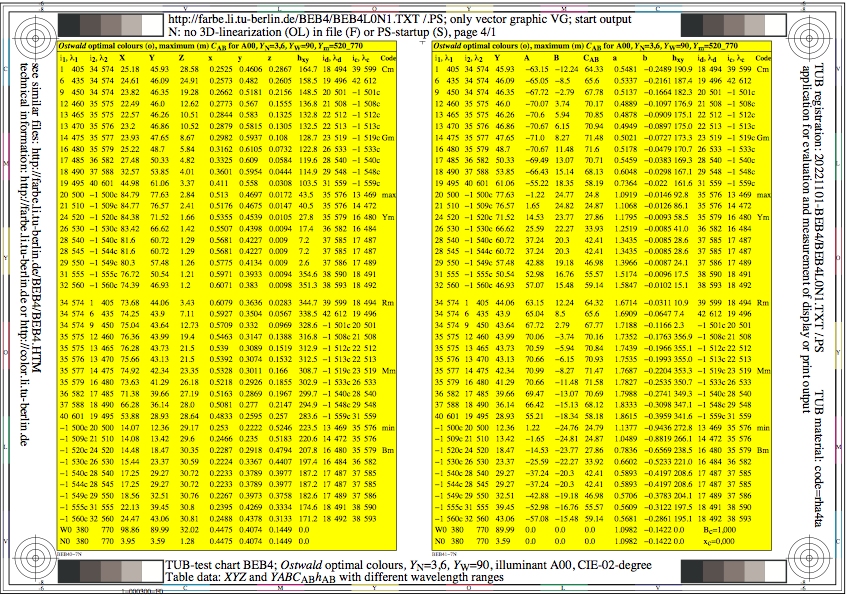
Figure BEB4L0N1.jpg: Output in format A6 of the file
BEB4L0NP.PDF, see
BEB4L0N1.
PS /
TXT /
PDF /
jpg
BEB4: TUB-test chart BEB4; Ostwald-optimal colours
YN=3,6, YW=90, CIE illuminant A, CIE 02 degree
Table data XYZ and YABCh with wavelength limits

Figure BEB5L0N1.jpg: Output in format A6 of the file
BEB5L0NP.PDF, see
BEB5L0N1.
PS /
TXT /
PDF /
jpg
BEB5: TUB-test chart BEB5; Ostwald-optimal colours
YN=3,6, YW=90, CIE illuminant A, CIE 02 degree
Table data YABCh1 and YABCh2 with wavelength limits

Figure BEB6L0N1.jpg: Output in format A6 of the file
BEB6L0NP.PDF, see
BEB6L0N1.
PS /
TXT /
PDF /
jpg
BEB6: TUB-test chart BEB6; 8 spectral radiations of illuminants Pxx
and Dxx for calculation of Ostwald optimal colours;
wavelength limits by (x,y)400,700; CIE-02-degree observer
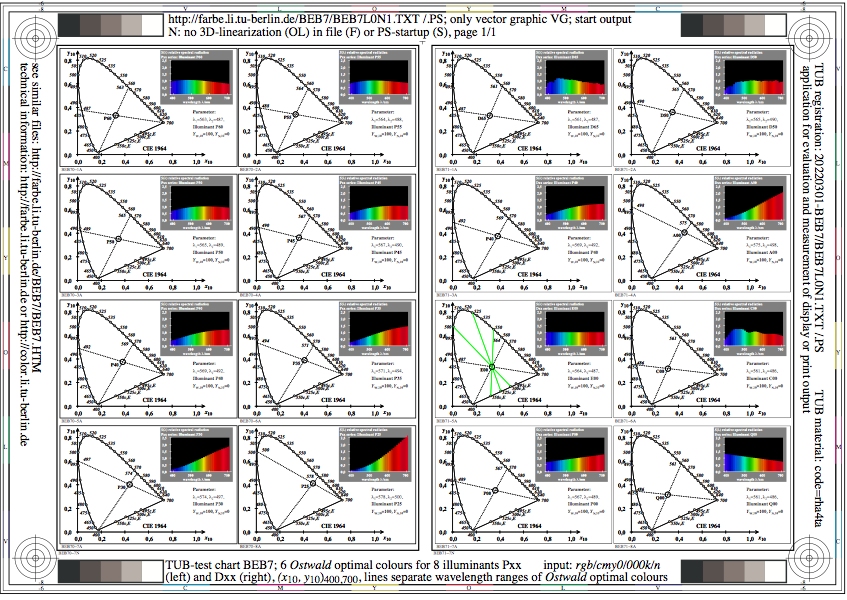
Figure BEB7L0N1.jpg: Output in format A6 of the file
BEB7L0NP.PDF, see
BEB7L0N1.
PS /
TXT /
PDF /
jpg
BEB7: TUB-test chart BEB7;8 spectral radiations of illuminants Pxx
and Dxx for calculation of Ostwald optimal colours;
wavelength limits by (x,y)400,700; CIE-10-degree observer
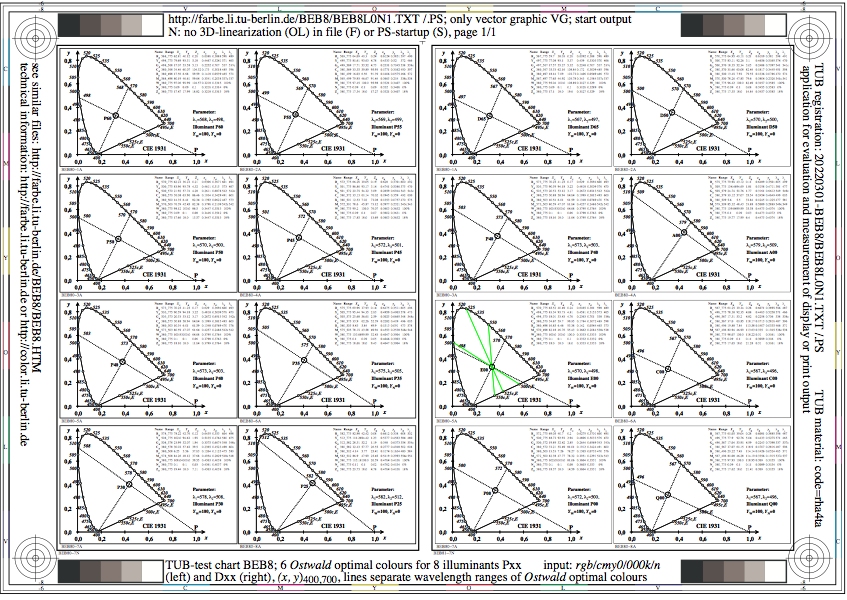
Figure BEB8L0N1.jpg: Output in format A6 of the file
BEB8L0NP.PDF, see
BEB8L0N1.
PS /
TXT /
PDF /
jpg
BEB8: TUB-test chart BEB8; Complementary spectral colours
for calculation of Ostwald optimal colours with Pxx/Dxx
wavelength limits by (x,y)400,P; CIE-02-degree observer

Figure BEB9L0N1.jpg: Output in format A6 of the file
BEB9L0NP.PDF, see
BEB9L0N1.
PS /
TXT /
PDF /
jpg
BEB9: TUB-test chart BEB9; Complementary spectral colours
for calculation of Ostwald optimal colours with Pxx/Dxx
wavelength limits by (x,y)400,P; CIE-10-degree observer
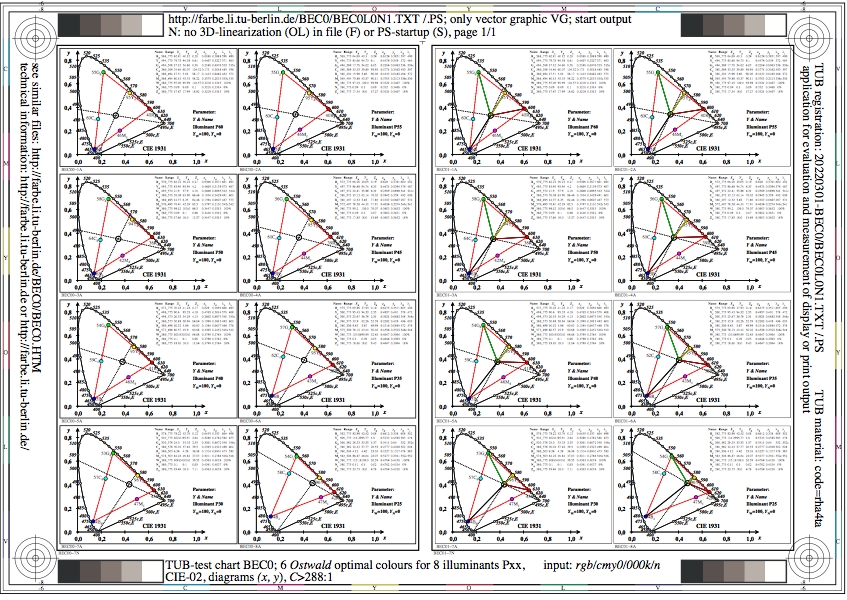
Figure BEC0L0N1.jpg: Output in format A6 of the file
BEC0L0NP.PDF, see
BEC0L0N1.
PS /
TXT /
PDF /
jpg
BEC0: TUB-test chart BEC0; 6 Ostwald optimal colours
for 8 illuminants Pxx, CIE-02-degree observer, chromaticity
diagram (x, y), C>=288:1
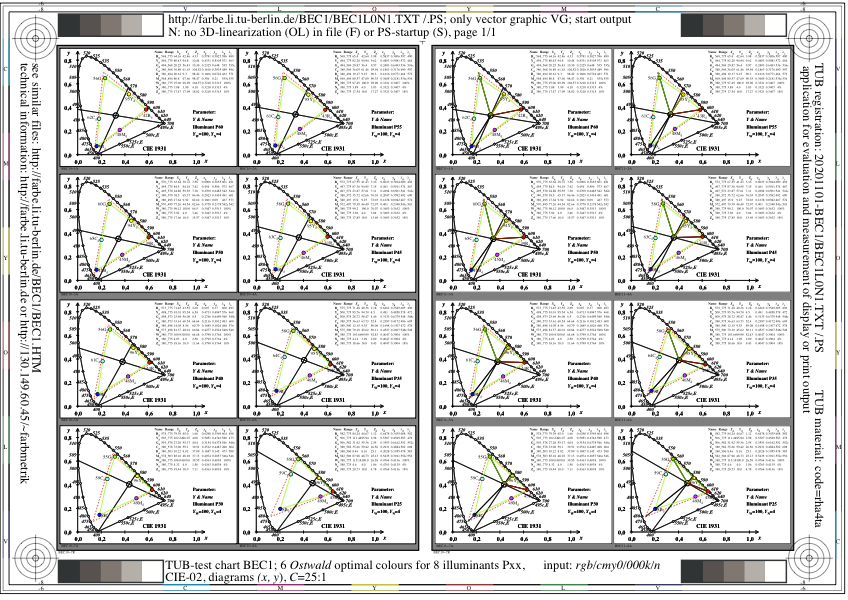
Figure BEC1L0N1.jpg: Output in format A6 of the file
BEC1L0NP.PDF, see
BEC1L0N1.
PS /
TXT /
PDF /
jpg
BEC1: TUB-test chart BEC1; 6 Ostwald optimal colours
for 8 illuminants Pxx, CIE-02-degree observer, chromaticity
diagram (x, y), C=25:1
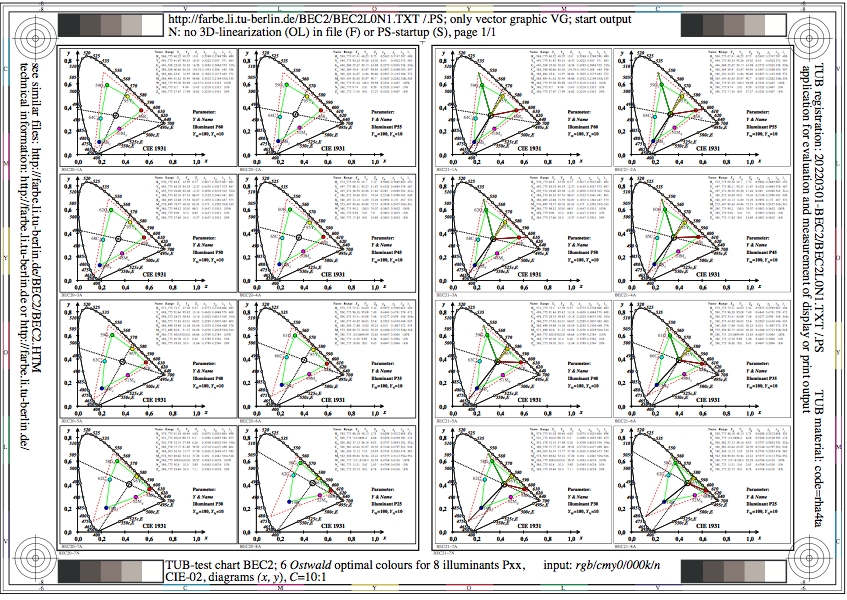
Figure BEC2L0N1.jpg: Output in format A6 of the file
BEC2L0NP.PDF, see
BEC2L0N1.
PS /
TXT /
PDF /
jpg
BEC2: TUB-test chart BEC2; 6 Ostwald optimal colours
for 8 illuminants Pxx, CIE-02-degree observer, chromaticity
diagram (x, y), contrast C=10:1

Figure BEC3L0N1.jpg: Output in format A6 of the file
BEC3L0NP.PDF, see
BEC3L0N1.
PS /
TXT /
PDF /
jpg
BEC3: TUB-test chart BEC3; 6 Ostwald optimal colours
for 8 illuminants Pxx, CIE-02-degree observer, chromaticity
diagram (x, y), contrast C=4:1

Figure BEC4L0N1.jpg: Output in format A6 of the file
BEC4L0NP.PDF, see
BEC4L0N1.
PS /
TXT /
PDF /
jpg
BEC4: TUB-test chart BEC4; 6 Ostwald optimal colours
for 8 illuminants Pxx, CIE-02-degree observer, chromaticity
diagram (x, y), contrast C=2:1
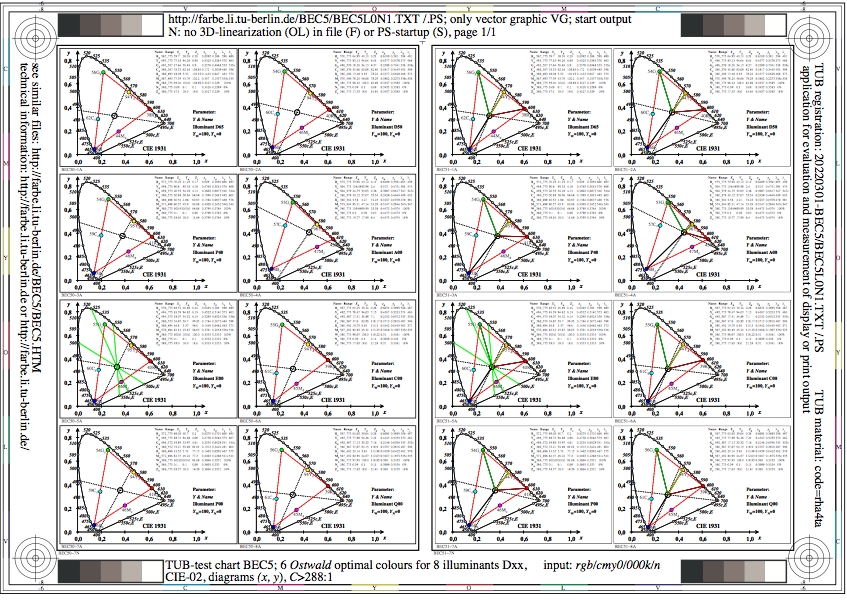
Figure BEC5L0N1.jpg: Output in format A6 of the file
BEC5L0NP.PDF, see
BEC5L0N1.
PS /
TXT /
PDF /
jpg
BEC5: TUB-test chart BEC5; 6 Ostwald optimal colours
for 8 illuminants Dxx, CIE-02-degree observer, chromaticity
diagram (x, y), contrast C>=288:1
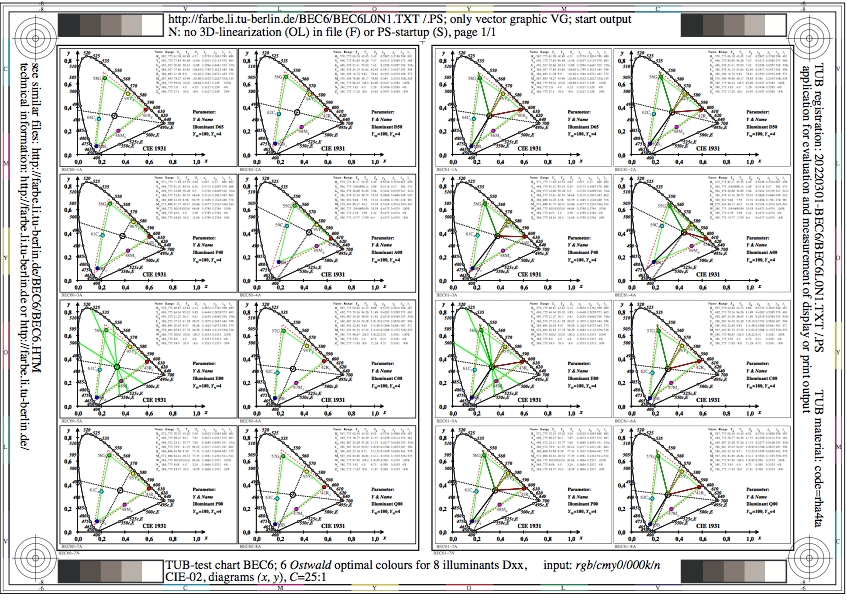
Figure BEC6L0N1.jpg: Output in format A6 of the file
BEC6L0NP.PDF, see
BEC6L0N1.
PS /
TXT /
PDF /
jpg
BEC6: TUB-test chart BEC6; 6 Ostwald optimal colours
for 8 illuminants Dxx, CIE-02-degree observer, chromaticity
diagram (x, y), contrast C=25:1

Figure BEC7L0N1.jpg: Output in format A6 of the file
BEC7L0NP.PDF, see
BEC7L0N1.
PS /
TXT /
PDF /
jpg
BEC7: TUB-test chart BEC7; 6 Ostwald optimal colours
for 8 illuminants Dxx, CIE-02-degree observer, chromaticity
diagram (x, y), contrast C=10:1
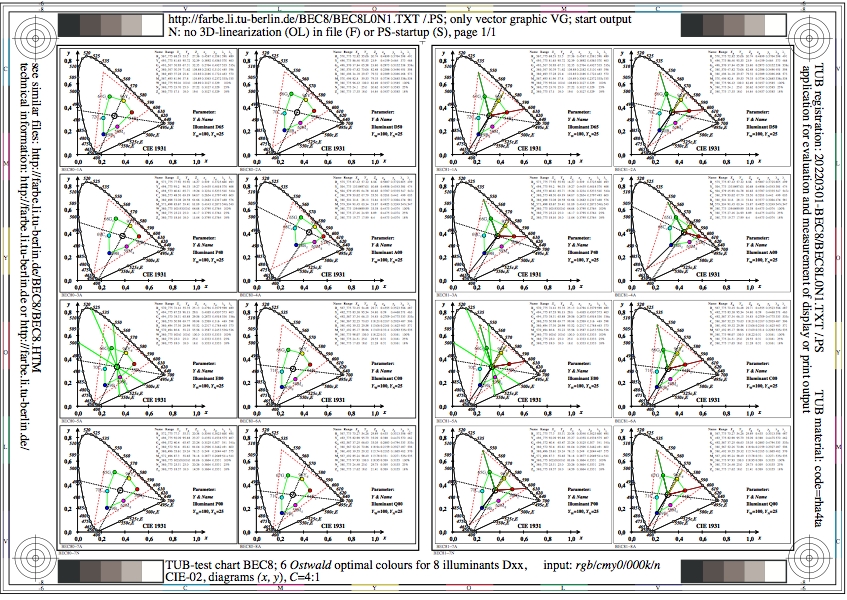
Figure BEC8L0N1.jpg: Output in format A6 of the file
BEC8L0NP.PDF, see
BEC8L0N1.
PS /
TXT /
PDF /
jpg
BEC8: TUB-test chart BEC8; 6 Ostwald optimal colours
for 8 illuminants Dxx, CIE-02-degree observer, chromaticity
diagram (x, y), contrast C=4:1
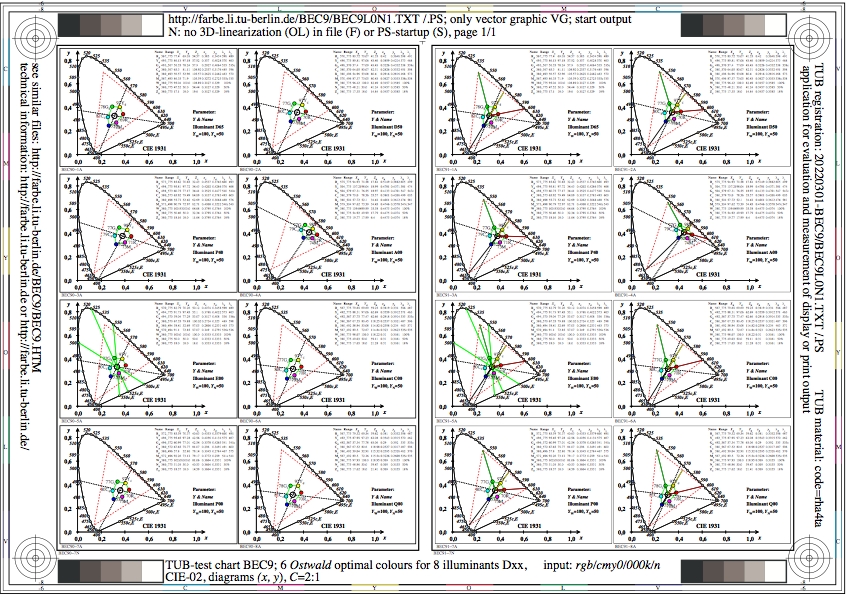
Figure BEC9L0N1.jpg: Output in format A6 of the file
BEC9L0NP.PDF, see
BEC9L0N1.
PS /
TXT /
PDF /
jpg
BEC9: TUB-test chart BEC9; 6 Ostwald optimal colours
for 8 illuminants Dxx, CIE-02-degree observer, chromaticity
diagram (x, y), contrast C=2:1
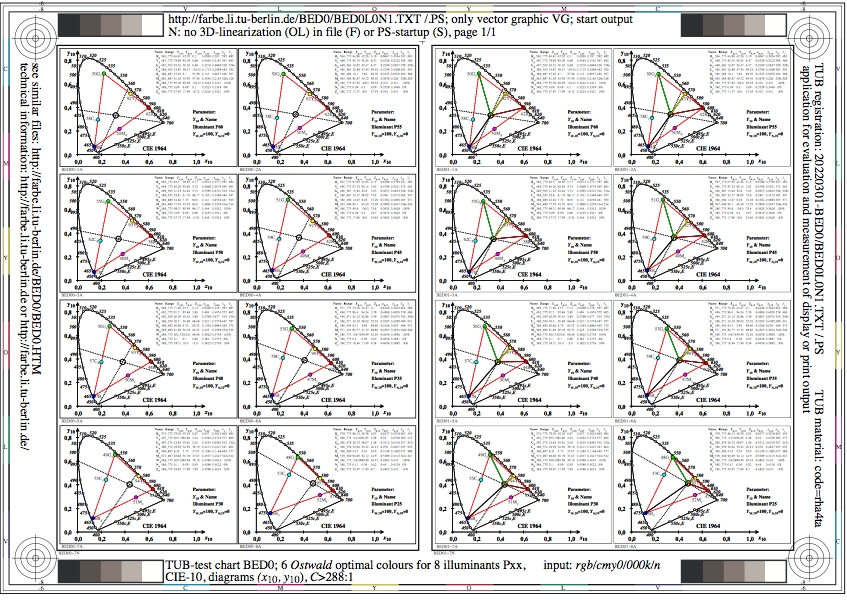
Figure BED0L0N1.jpg: Output in format A6 of the file
BED0L0NP.PDF, see
BED0L0N1.
PS /
TXT /
PDF /
jpg
BED0: TUB-test chart BED0; 6 Ostwald optimal colours
for 8 illuminants Pxx, CIE-10-degree observer, chromaticity
diagram (x10, y10), contrast C>=288:1
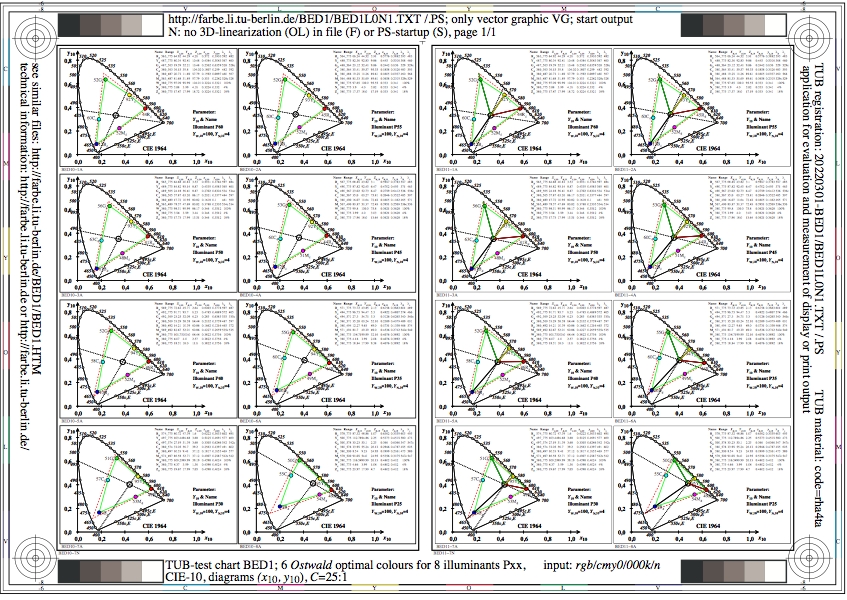
Figure BED1L0N1.jpg: Output in format A6 of the file
BED1L0NP.PDF, see
BED1L0N1.
PS /
TXT /
PDF /
jpg
BED1: TUB-test chart BED1; 6 Ostwald optimal colours
for 8 illuminants Pxx, CIE-10-degree observer, chromaticity
diagram (x10, y10), contrast C=25:1
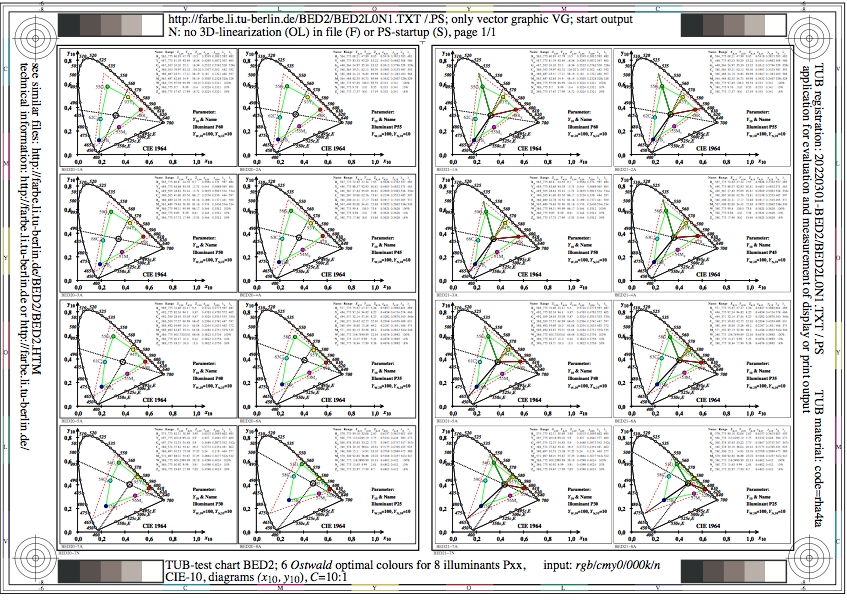
Figure BED2L0N1.jpg: Output in format A6 of the file
BED2L0NP.PDF, see
BED2L0N1.
PS /
TXT /
PDF /
jpg
BED2: TUB-test chart BED2; 6 Ostwald optimal colours
for 8 illuminants Pxx, CIE-10-degree observer, chromaticity
diagram (x10, y10), contrast C=10:1
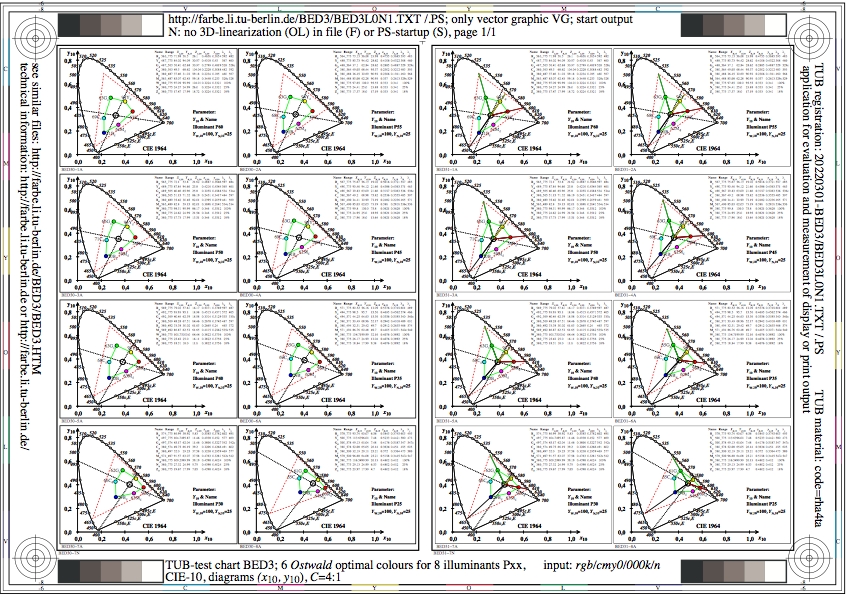
Figure BED3L0N1.jpg: Output in format A6 of the file
BED3L0NP.PDF, see
BED3L0N1.
PS /
TXT /
PDF /
jpg
BED3: TUB-test chart BED3; 6 Ostwald optimal colours
for 8 illuminants Pxx, CIE-10-degree observer, chromaticity
diagram (x10, y10), contrast C=4:1
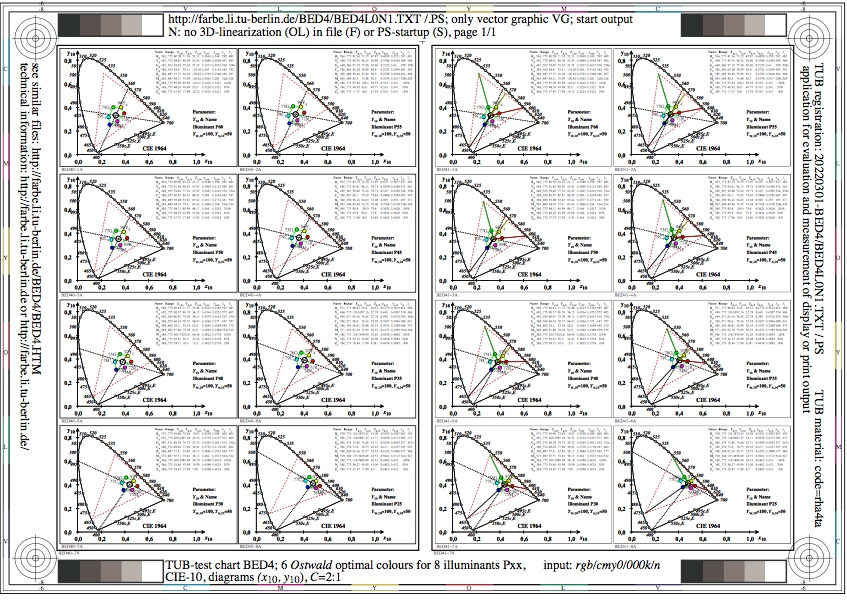
Figure BED4L0N1.jpg: Output in format A6 of the file
BED4L0NP.PDF, see
BED4L0N1.
PS /
TXT /
PDF /
jpg
BED4: TUB-test chart BED4; 6 Ostwald optimal colours
for 8 illuminants Pxx, CIE-10-degree observer, chromaticity
diagram (x10, y10), contrast C=2:1
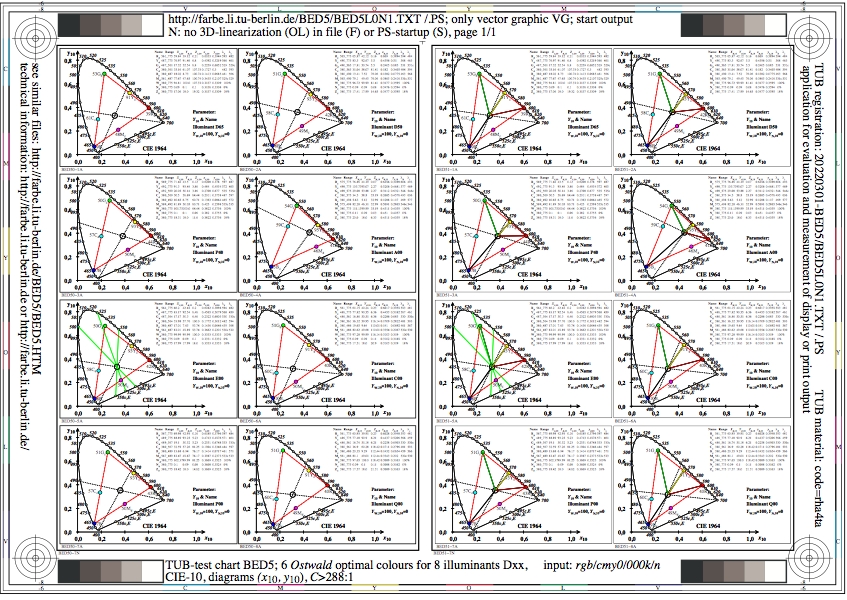
Figure BED5L0N1.jpg: Output in format A6 of the file
BED5L0NP.PDF, see
BED5L0N1.
PS /
TXT /
PDF /
jpg
BED5: TUB-test chart BED5; 6 Ostwald optimal colours
for 8 illuminants Dxx, CIE-10-degree observer, chromaticity
diagram (x10, y10), contrast C>=288:1

Figure BED6L0N1.jpg: Output in format A6 of the file
BED6L0NP.PDF, see
BED6L0N1.
PS /
TXT /
PDF /
jpg
BED6: TUB-test chart BED6; 6 Ostwald optimal colours
for 8 illuminants Dxx, CIE-10-degree observer, chromaticity
diagram (x10, y10), contrast C=25:1
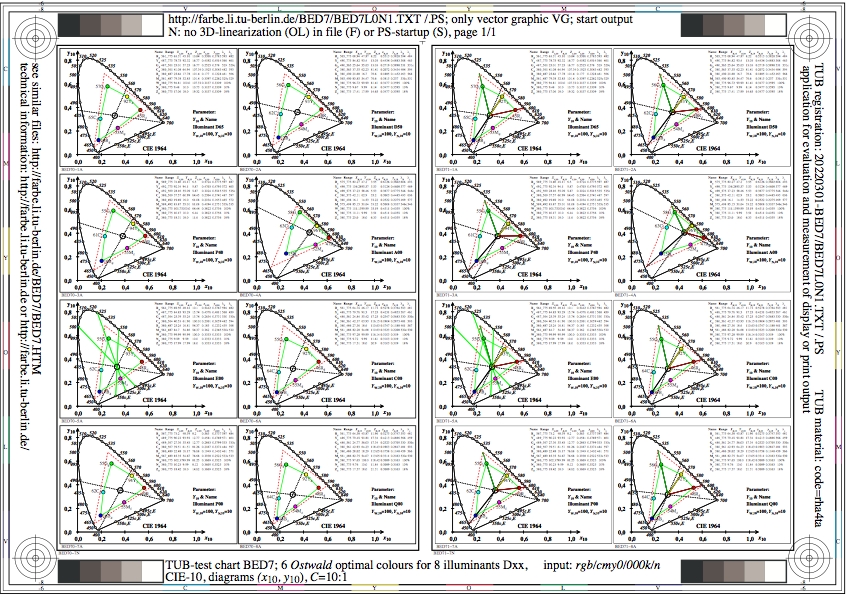
Figure BED7L0N1.jpg: Output in format A6 of the file
BED7L0NP.PDF, see
BED7L0N1.
PS /
TXT /
PDF /
jpg
BED7: TUB-test chart BED7; 6 Ostwald optimal colours
for 8 illuminants Dxx, CIE-10-degree observer, chromaticity
diagram (x10, y10), contrast C=10:1

Figure BED8L0N1.jpg: Output in format A6 of the file
BED8L0NP.PDF, see
BED8L0N1.
PS /
TXT /
PDF /
jpg
BED8: TUB-test chart BED8; 6 Ostwald optimal colours
for 8 illuminants Dxx, CIE-10-degree observer, chromaticity
diagram (x10, y10), contrast C=4:1
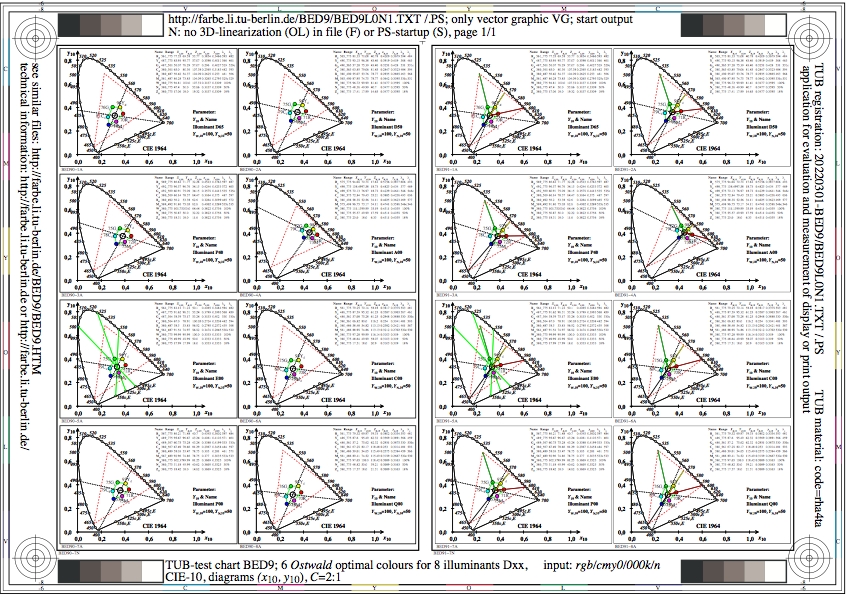
Figure BED9L0N1.jpg: Output in format A6 of the file
BED9L0NP.PDF, see
BED9L0N1.
PS /
TXT /
PDF /
jpg
BED9: TUB-test chart BED9; 6 Ostwald optimal colours
for 8 illuminants Dxx, CIE-10-degree observer, chromaticity
diagram (x10, y10), contrast C=2:1
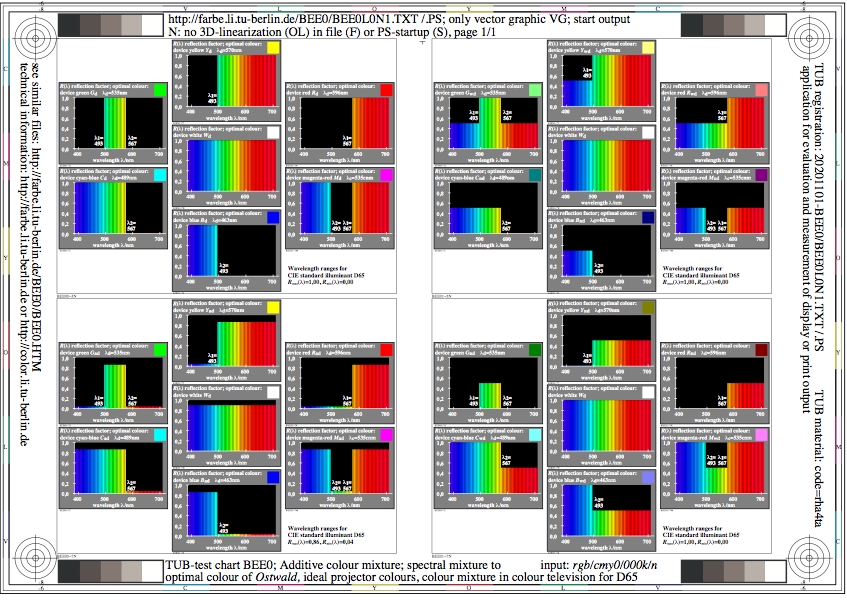
Figure BEE0L0N1.jpg: Output in format A6 of the file
BEE0L0NP.PDF, see
BEE0L0N1.
PS /
TXT /
PDF /
jpg
BEE0: TUB-test chart BEE0; Additive colour mixture, spectral
mixture to optimal colours of Ostwald, ideal
projector colours, mixture with colour integrator for D65
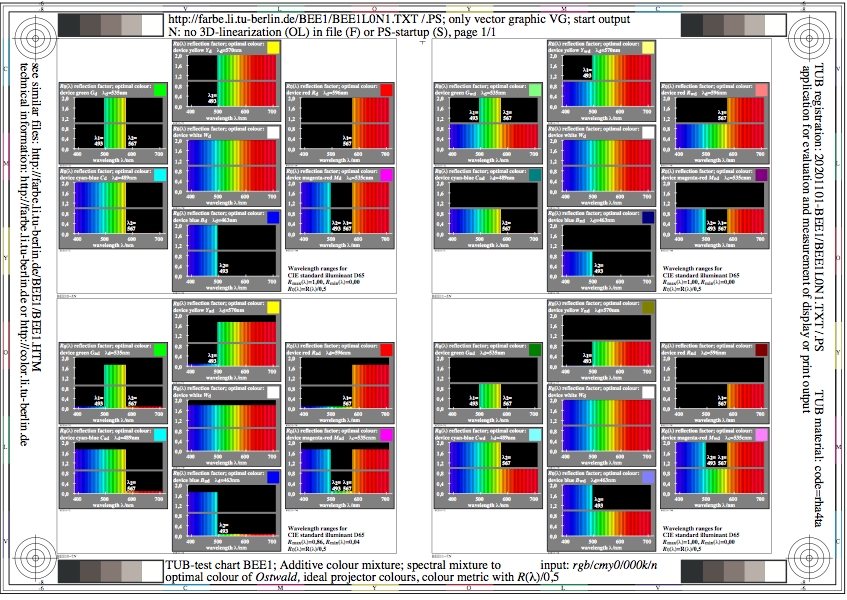
Figure BEE1L0N1.jpg: Output in format A6 of the file
BEE1L0NP.PDF, see
BEE1L0N1.
PS /
TXT /
PDF /
jpg
BEE1: TUB-test chart BEE1; Additive colour mixture, spectral
mixture to optimal colours of Ostwald, ideal
projector colours, mixture with colour integrator for D65
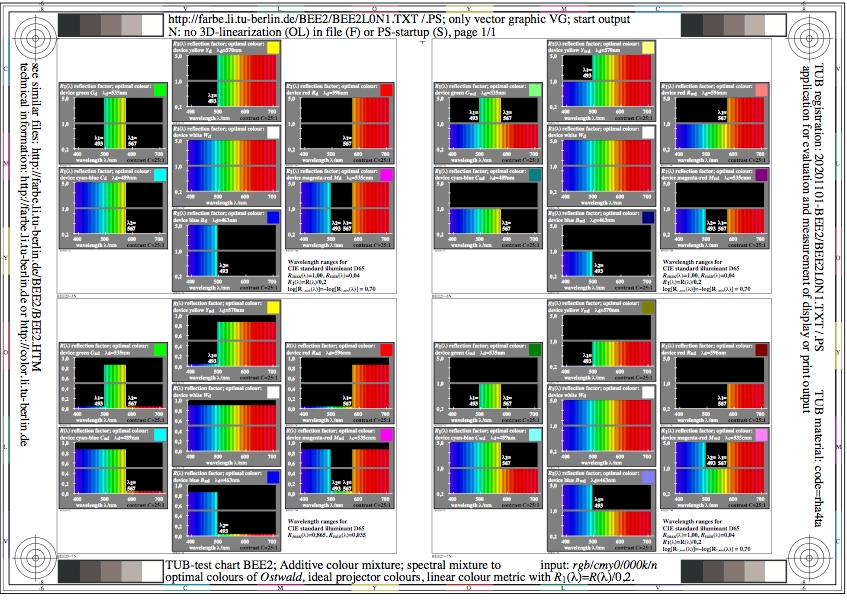
Figure BEE2L0N1.jpg: Output in format A6 of the file
BEE2L0NP.PDF, see
BEE2L0N1.
PS /
TXT /
PDF /
jpg
BEE2: TUB-test chart BEE2; Additive colour mixture, spectral
mixture to optimal colours of Ostwald, antagonistic
model of colour vision, mixture of grey for D65
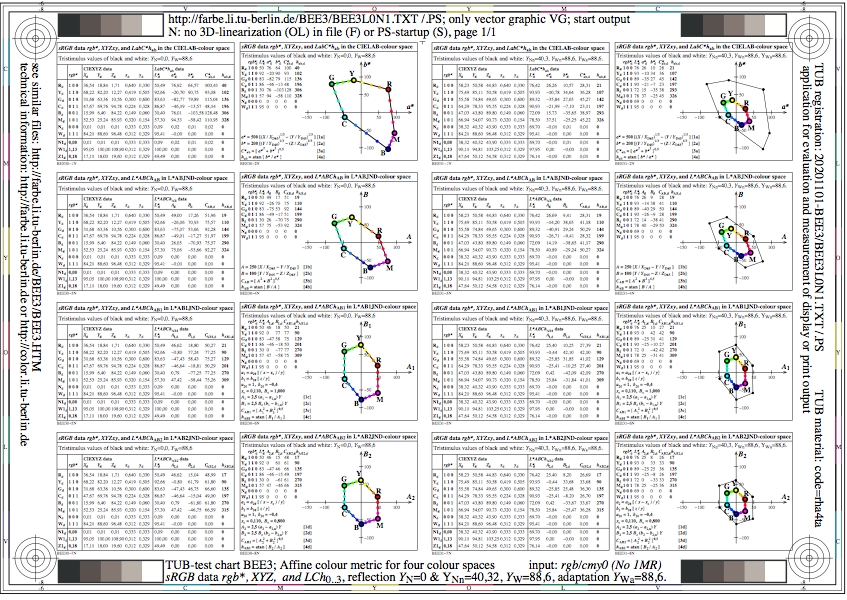
Figure BEE3L0N1.jpg: Output in format A6 of the file
BEE3L0NP.PDF, see
BEE3L0N1.
PS /
TXT /
PDF /
jpg
BEE3: TUB-test chart BEE3; Antagonistic metric in colour spaces
data rgb*, XYZ, and (Ai, Bi) of colour spaces LCHJND0 to 3
contrast steps C>=288:1 and 2:1 for sRGB display

Figure BEE4L0N1.jpg: Output in format A6 of the file
BEE4L0NP.PDF, see
BEE4L0N1.
PS /
TXT /
PDF /
jpg
BEE4: TUB-test chart BEE4; Antagonistic metric in colour spaces
data rgb*, XYZ, and (Ai, Bi) of colour spaces LCHJND0 to 3
contrast steps C>=288:1 and 2:1 for WCGa display
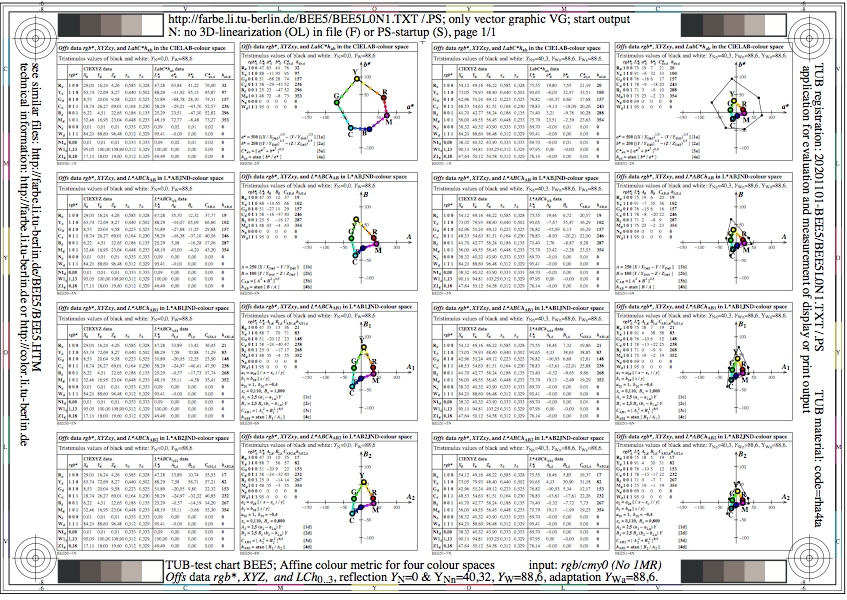
Figure BEE5L0N1.jpg: Output in format A6 of the file
BEE5L0NP.PDF, see
BEE5L0N1.
PS /
TXT /
PDF /
jpg
BEE5: TUB-test chart BEE5; Antagonistic metric in colour spaces
data rgb*, XYZ, and (Ai, Bi) of colour spaces LCHJND0 to 3
contrast steps C>=288:1 and 2:1 for Offs display
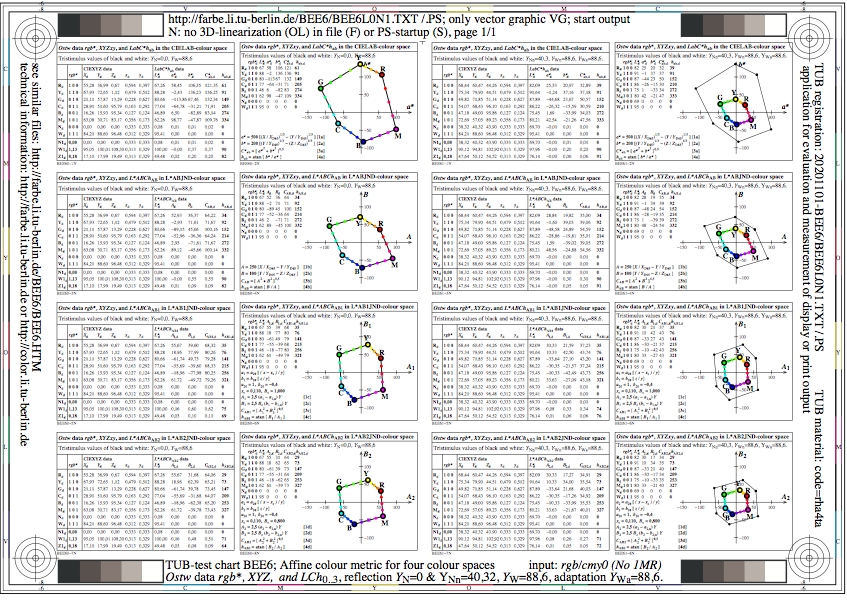
Figure BEE6L0N1.jpg: Output in format A6 of the file
BEE6L0NP.PDF, see
BEE6L0N1.
PS /
TXT /
PDF /
jpg
BEE6: TUB-test chart BEE6; Antagonistic metric in colour spaces
data rgb*, XYZ, and (Ai, Bi) of colour spaces LCHJND0 to 3
contrast steps C>=288:1 and 2:1 for Ostw display
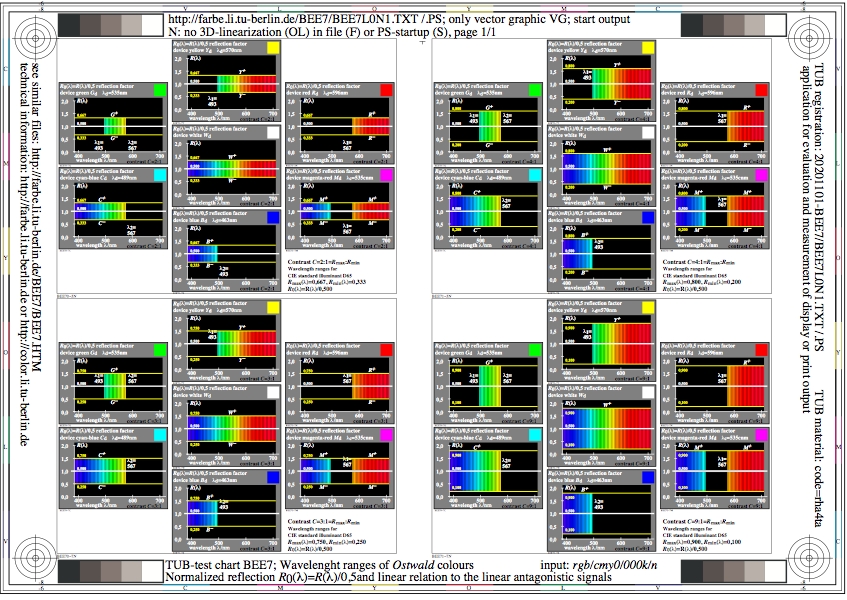
Figure BEE7L0N1.jpg: Output in format A6 of the file
BEE7L0NP.PDF, see
BEE7L0N1.
PS /
TXT /
PDF /
jpg
BEE7: TUB-test chart BEE7; Wavelength ranges of Ostwald colours
normalized reflection R/0,5 and linear model relation
to the antagonistic visual signals
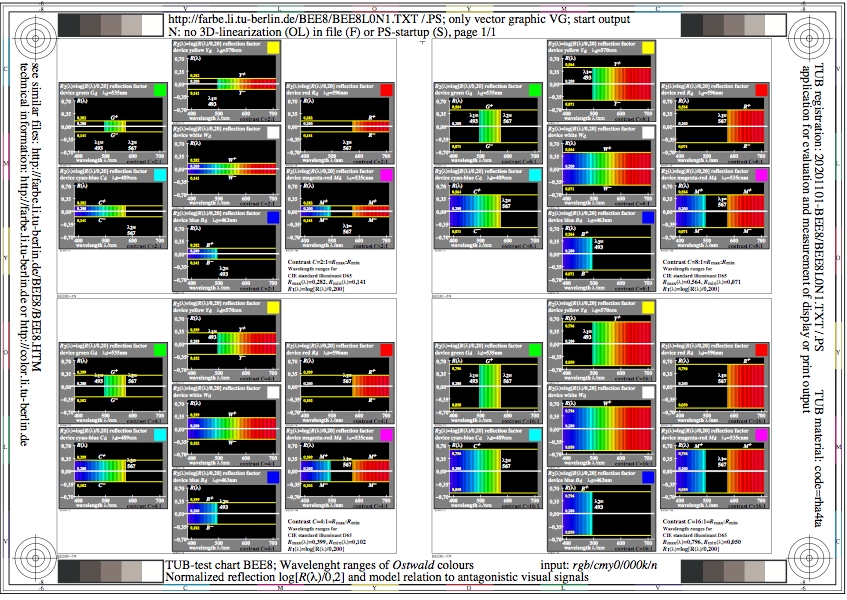
Figure BEE8L0N1.jpg: Output in format A6 of the file
BEE8L0NP.PDF, see
BEE8L0N1.
PS /
TXT /
PDF /
jpg
BEE8: TUB-test chart BEE8; Wavelength ranges of Ostwald colours
normalized reflection log[R/0,2] and model relation
to the different antagonistic visual signals
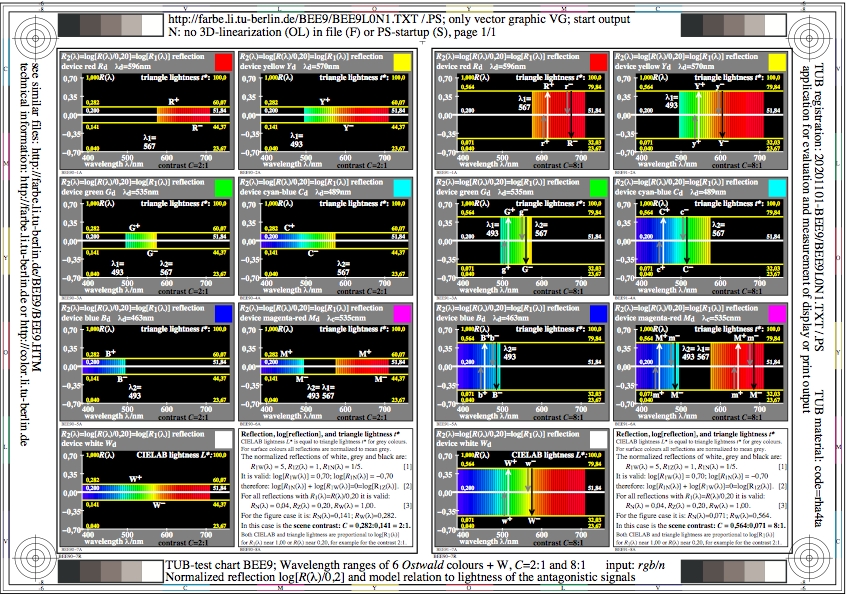
Figure BEE9L0N1.jpg: Output in format A6 of the file
BEE9L0NP.PDF, see
BEE9L0N1.
PS /
TXT /
PDF /
jpg
BEE9: TUB-test chart BEE9; Wavelength ranges of Ostwald colours
normalized reflection log[R/0,2] and model relation
to the lightness of antagonistic visual signals

Figure BEF0L0N1.jpg: Output in format A6 of the file
BEF0L0NP.PDF, see
BEF0L0N1.
PS /
TXT /
PDF /
jpg
BEF0: TUB-test chart BEF0; 6 Ostwald optimal colours
for 8 illuminants Pxx, CIE-02-degree observer, chromatic value
diagram (CAB2, Y), contrast C>=288:1

Figure BEF1L0N1.jpg: Output in format A6 of the file
BEF1L0NP.PDF, see
BEF1L0N1.
PS /
TXT /
PDF /
jpg
BEF1: TUB-test chart BEF1; 6 Ostwald optimal colours
for 8 illuminants Pxx, CIE-02-degree observer, chromatic value
diagram (CAB2, Y), contrast C=25:1
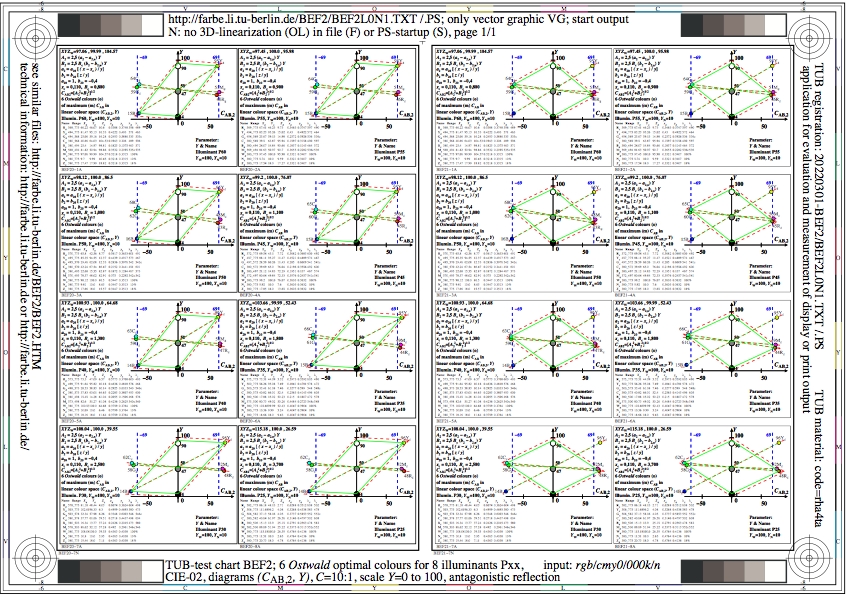
Figure BEF2L0N1.jpg: Output in format A6 of the file
BEF2L0NP.PDF, see
BEF2L0N1.
PS /
TXT /
PDF /
jpg
BEF2: TUB-test chart BEF2; 6 Ostwald optimal colours
for 8 illuminants Pxx, CIE-02-degree observer, chromatic value
diagram (CAB2, Y), contrast C=10:1
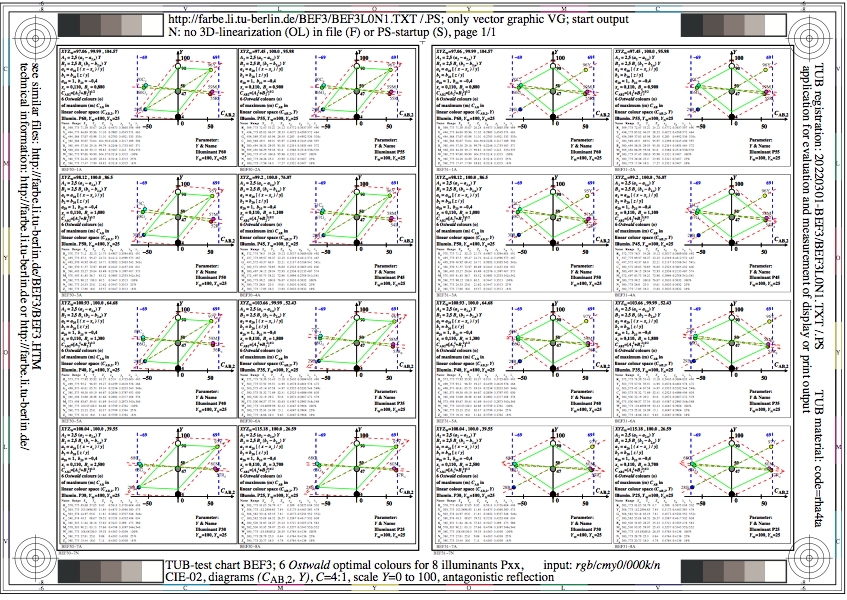
Figure BEF3L0N1.jpg: Output in format A6 of the file
BEF3L0NP.PDF, see
BEF3L0N1.
PS /
TXT /
PDF /
jpg
BEF3: TUB-test chart BEF3; 6 Ostwald optimal colours
for 8 illuminants Pxx, CIE-02-degree observer, chromatic value
diagram (CAB2, Y), contrast C=4:1

Figure BEF4L0N1.jpg: Output in format A6 of the file
BEF4L0NP.PDF, see
BEF4L0N1.
PS /
TXT /
PDF /
jpg
BEF4: TUB-test chart BEF4; 6 Ostwald optimal colours
for 8 illuminants Pxx, CIE-02-degree observer, chromatic value
diagram (CAB2, Y), contrast C=2:1

Figure BEF5L0N1.jpg: Output in format A6 of the file
BEF5L0NP.PDF, see
BEF5L0N1.
PS /
TXT /
PDF /
jpg
BEF5: TUB-test chart BEF5; 6 Ostwald optimal colours
for 8 illuminants Dxx, CIE-02-degree observer, chromatic value
diagram (CAB2, Y), contrast C>=288:1
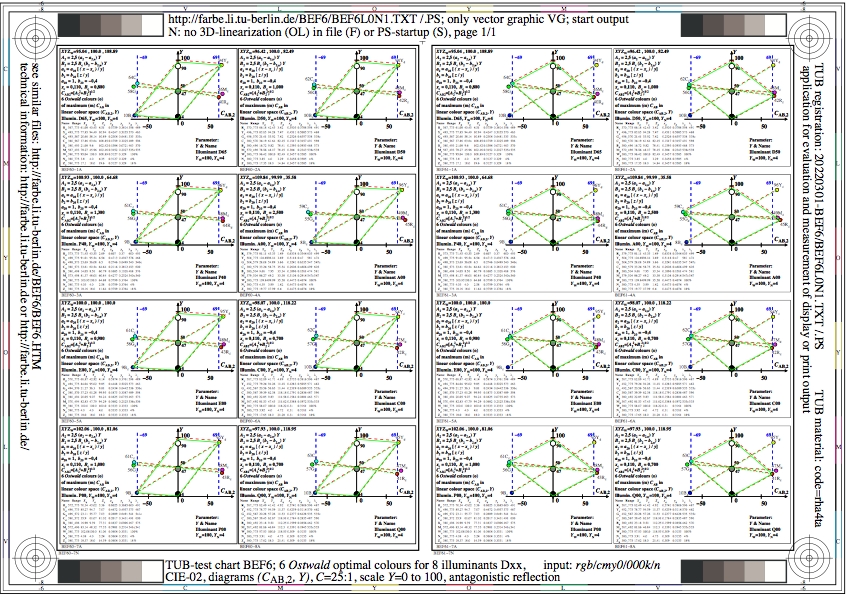
Figure BEF6L0N1.jpg: Output in format A6 of the file
BEF6L0NP.PDF, see
BEF6L0N1.
PS /
TXT /
PDF /
jpg
BEF6: TUB-test chart BEF6; 6 Ostwald optimal colours
for 8 illuminants Dxx, CIE-02-degree observer, chromatic value
diagram (CAB2, Y), contrast C=25:1, Y-tr
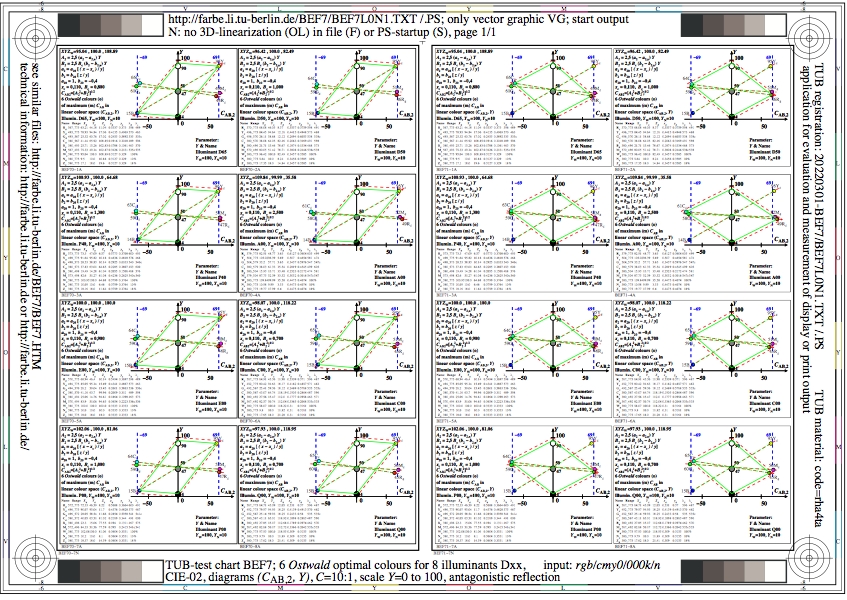
Figure BEF7L0N1.jpg: Output in format A6 of the file
BEF7L0NP.PDF, see
BEF7L0N1.
PS /
TXT /
PDF /
jpg
BEF7: TUB-test chart BEF7; 6 Ostwald optimal colours
for 8 illuminants Dxx, CIE-02-degree observer, chromatic value
diagram (CAB2, Y), contrast C=10:1, Y-tr
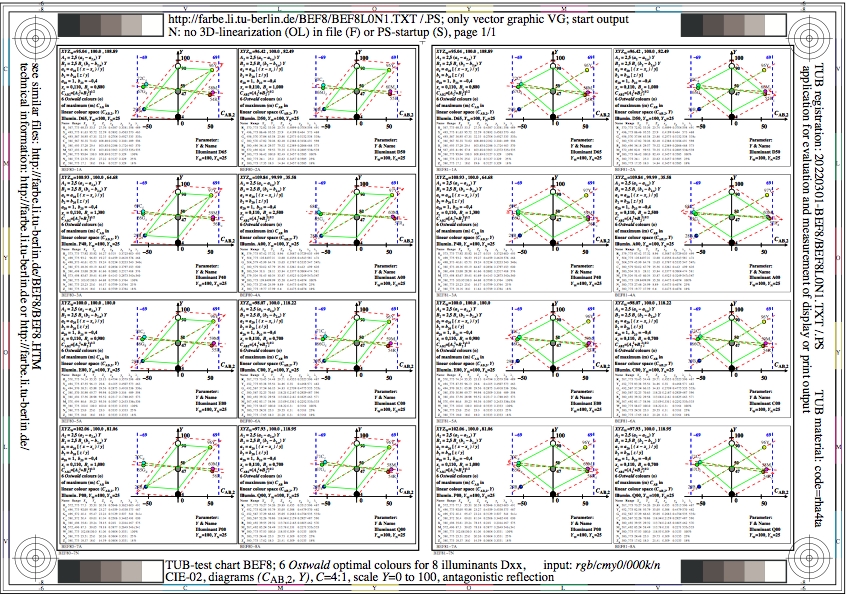
Figure BEF8L0N1.jpg: Output in format A6 of the file
BEF8L0NP.PDF, see
BEF8L0N1.
PS /
TXT /
PDF /
jpg
BEF8: TUB-test chart BEF8; 6 Ostwald optimal colours
for 8 illuminants Dxx, CIE-02-degree observer, chromatic value
diagram (CAB2, Y), contrast C=4:1, Y-tr
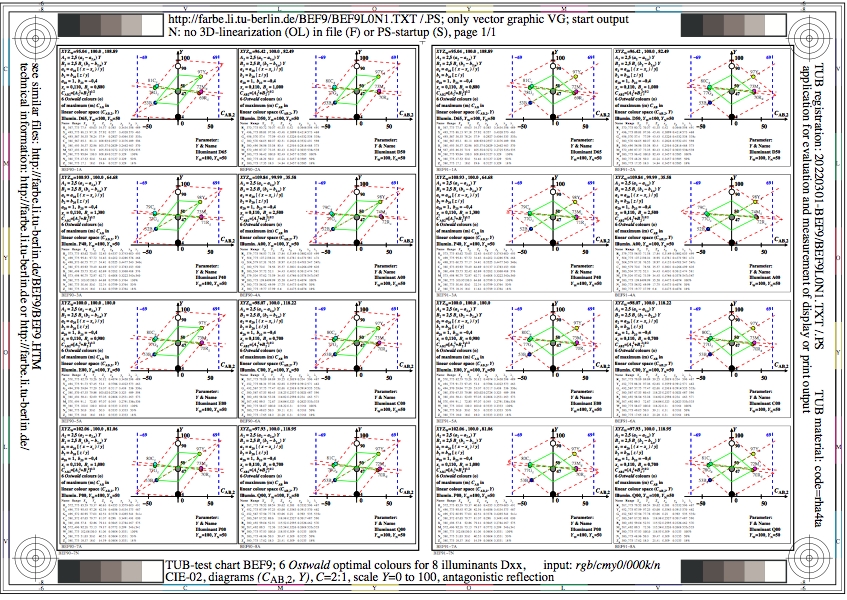
Figure BEF9L0N1.jpg: Output in format A6 of the file
BEF9L0NP.PDF, see
BEF9L0N1.
PS /
TXT /
PDF /
jpg
BEF9: TUB-test chart BEF9; 6 Ostwald optimal colours
for 8 illuminants Dxx, CIE-02-degree observer, chromatic value
diagram (CAB2, Y), contrast C=2:1, Y-tr

Figure BEG0L0N1.jpg: Output in format A6 of the file
BEG0L0NP.PDF, see
BEG0L0N1.
PS /
TXT /
PDF /
jpg
BEG0: TUB-test chart BEG0; 6 Ostwald optimal colours
for 8 illuminants Pxx, CIE-10-degree observer, chromatic value
diagram (CAB2, Y), contrast C>=288:1
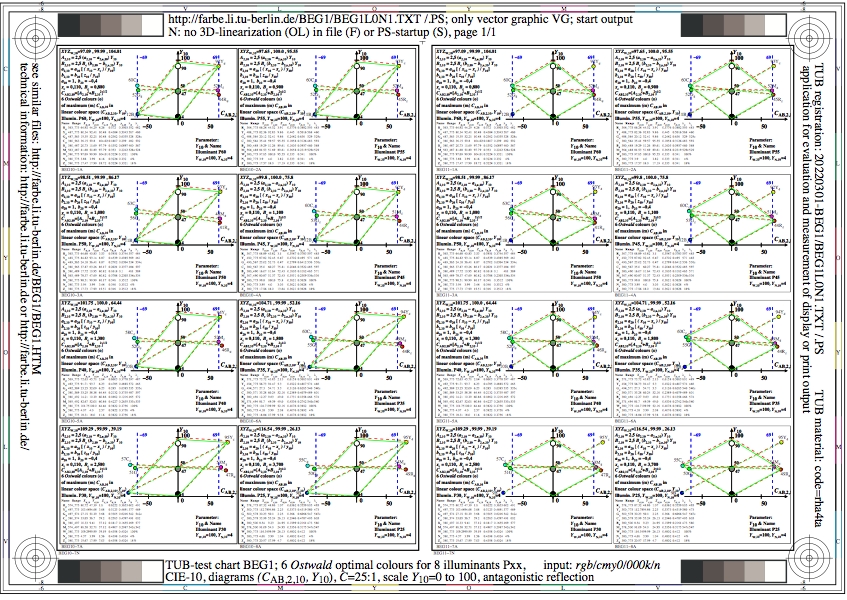
Figure BEG1L0N1.jpg: Output in format A6 of the file
BEG1L0NP.PDF, see
BEG1L0N1.
PS /
TXT /
PDF /
jpg
BEG1: TUB-test chart BEG1; 6 Ostwald optimal colours
for 8 illuminants Pxx, CIE-10-degree observer, chromatic value
diagram (CAB2, Y), contrast C=25:1

Figure BEG2L0N1.jpg: Output in format A6 of the file
BEG2L0NP.PDF, see
BEG2L0N1.
PS /
TXT /
PDF /
jpg
BEG2: TUB-test chart BEG2; 6 Ostwald optimal colours
for 8 illuminants Pxx, CIE-10-degree observer, chromatic value
diagram (CAB2, Y), contrast C=10:1
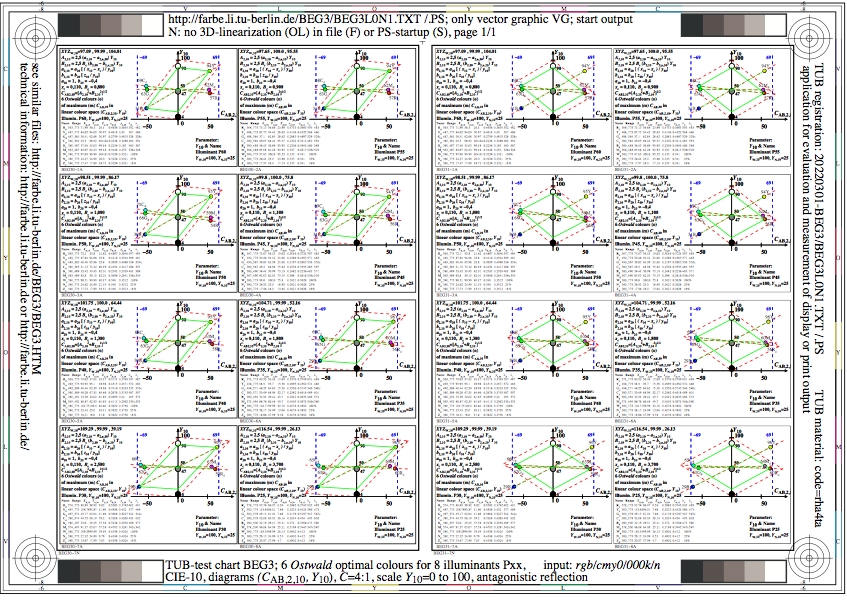
Figure BEG3L0N1.jpg: Output in format A6 of the file
BEG3L0NP.PDF, see
BEG3L0N1.
PS /
TXT /
PDF /
jpg
BEG3: TUB-test chart BEG3; 6 Ostwald optimal colours
for 8 illuminants Pxx, CIE-10-degree observer, chromatic value
diagram (CAB2, Y), contrast C=4:1

Figure BEG4L0N1.jpg: Output in format A6 of the file
BEG4L0NP.PDF, see
BEG4L0N1.
PS /
TXT /
PDF /
jpg
BEG4: TUB-test chart BEG4; 6 Ostwald optimal colours
for 8 illuminants Pxx, CIE-10-degree observer, chromatic value
diagram (CAB2, Y), contrast C=2:1

Figure BEG5L0N1.jpg: Output in format A6 of the file
BEG5L0NP.PDF, see
BEG5L0N1.
PS /
TXT /
PDF /
jpg
BEG5: TUB-test chart BEG5; 6 Ostwald optimal colours
for 8 illuminants Dxx, CIE-10-degree observer, chromatic value
diagram (CAB2, Y), contrast C>=288:1

Figure BEG6L0N1.jpg: Output in format A6 of the file
BEG6L0NP.PDF, see
BEG6L0N1.
PS /
TXT /
PDF /
jpg
BEG6: TUB-test chart BEG6; 6 Ostwald optimal colours
for 8 illuminants Dxx, CIE-10-degree observer, chromatic value
diagram (CAB2, Y), contrast C=25:1, Y-tr
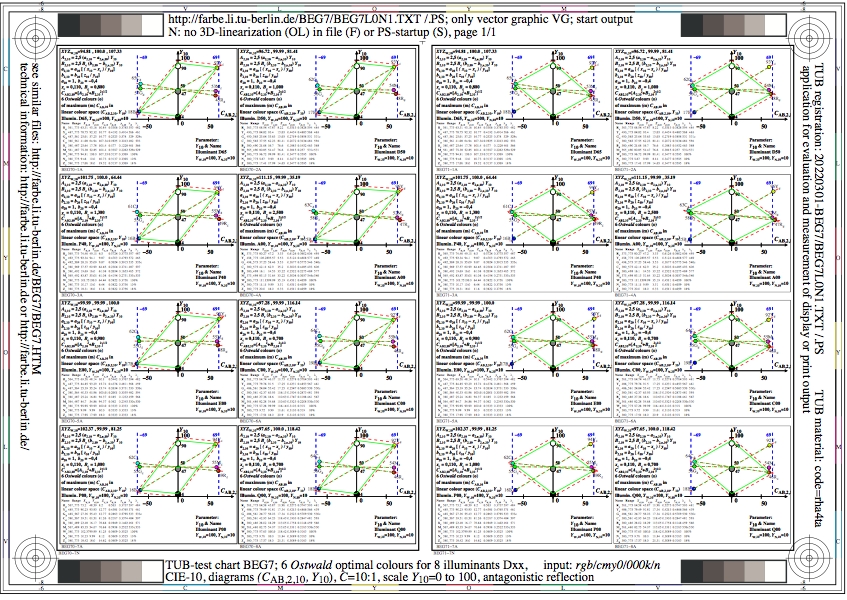
Figure BEG7L0N1.jpg: Output in format A6 of the file
BEG7L0NP.PDF, see
BEG7L0N1.
PS /
TXT /
PDF /
jpg
BEG7: TUB-test chart BEG7; 6 Ostwald optimal colours
for 8 illuminants Dxx, CIE-10-degree observer, chromatic value
diagram (CAB2, Y), contrast C=10:1, Y-tr
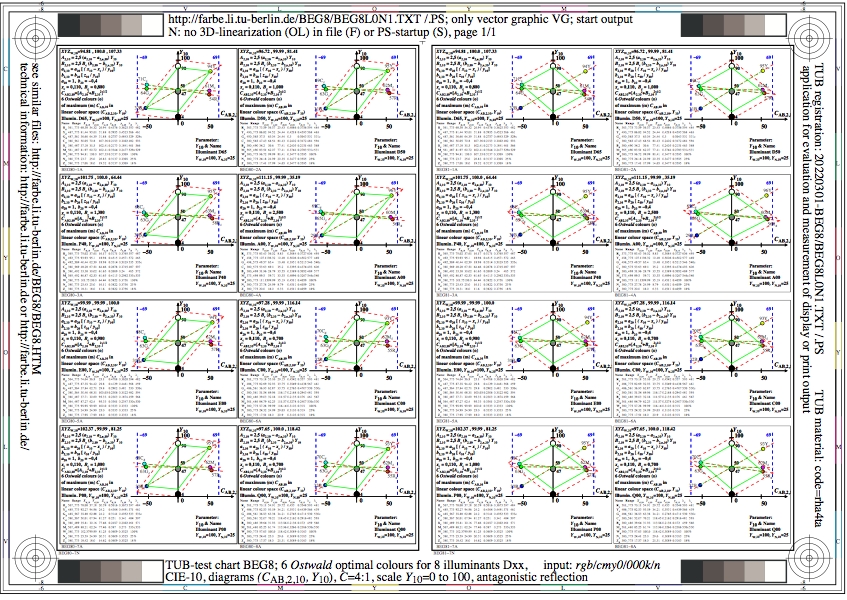
Figure BEG8L0N1.jpg: Output in format A6 of the file
BEG8L0NP.PDF, see
BEG8L0N1.
PS /
TXT /
PDF /
jpg
BEG8: TUB-test chart BEG8; 6 Ostwald optimal colours
for 8 illuminants Dxx, CIE-10-degree observer, chromatic value
diagram (CAB2, Y), contrast C=4:1, Y-tr

Figure BEG9L0N1.jpg: Output in format A6 of the file
BEG9L0NP.PDF, see
BEG9L0N1.
PS /
TXT /
PDF /
jpg
BEG9: TUB-test chart BEG9; 6 Ostwald optimal colours
for 8 illuminants Dxx, CIE-10-degree observer, chromatic value
diagram (CAB2, Y), contrast C=2:1, Y-tr
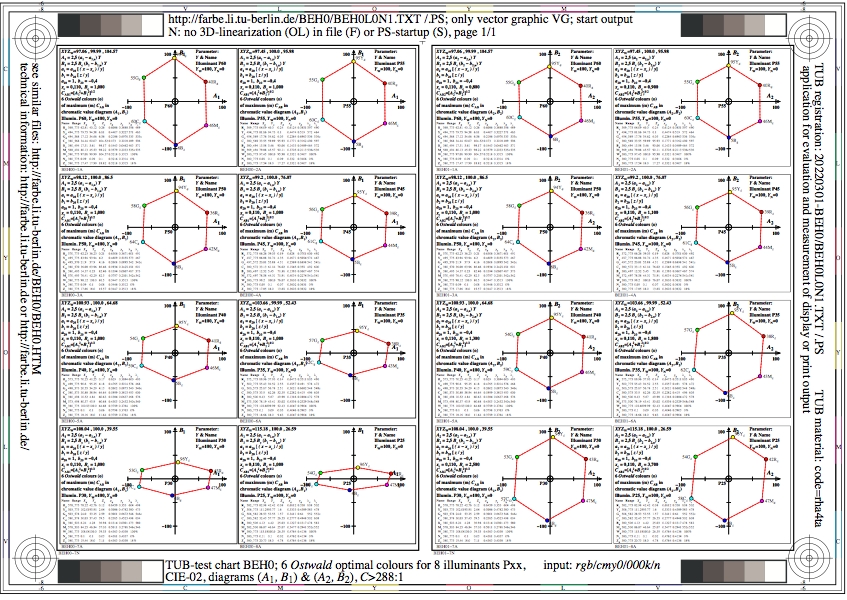
Figure BEH0L0N1.jpg: Output in format A6 of the file
BEH0L0NP.PDF, see
BEH0L0N1.
PS /
TXT /
PDF /
jpg
BEH0: TUB-test chart BEH0; 6 Ostwald optimal colours
for 8 illuminants Pxx, CIE-02-degree observer, chromatic value
diagrams (CAB1, CAB2), contrast C>=288:1
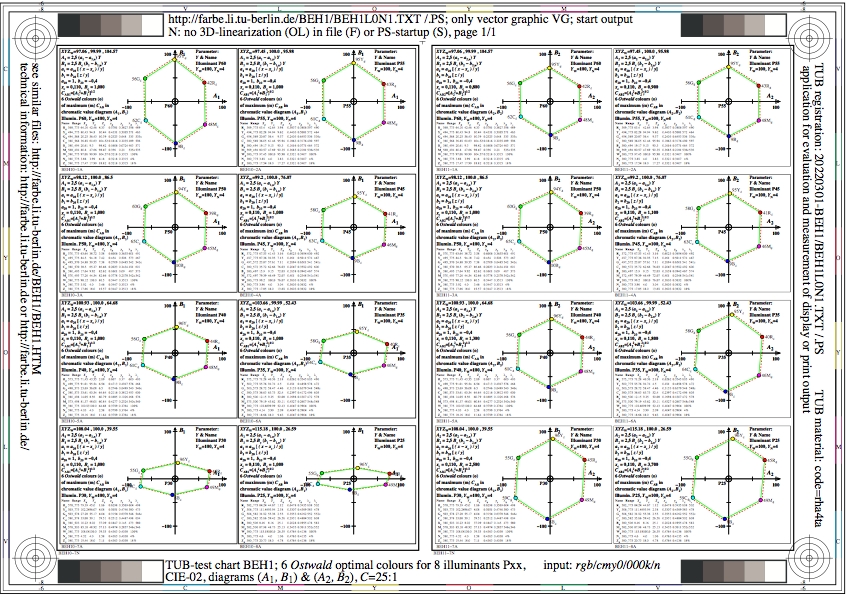
Figure BEH1L0N1.jpg: Output in format A6 of the file
BEH1L0NP.PDF, see
BEH1L0N1.
PS /
TXT /
PDF /
jpg
BEH1: TUB-test chart BEH1; 6 Ostwald optimal colours
for 8 illuminants Pxx, CIE-02-degree observer, chromatic value
diagrams (CAB1, CAB2), contrast C=25:1
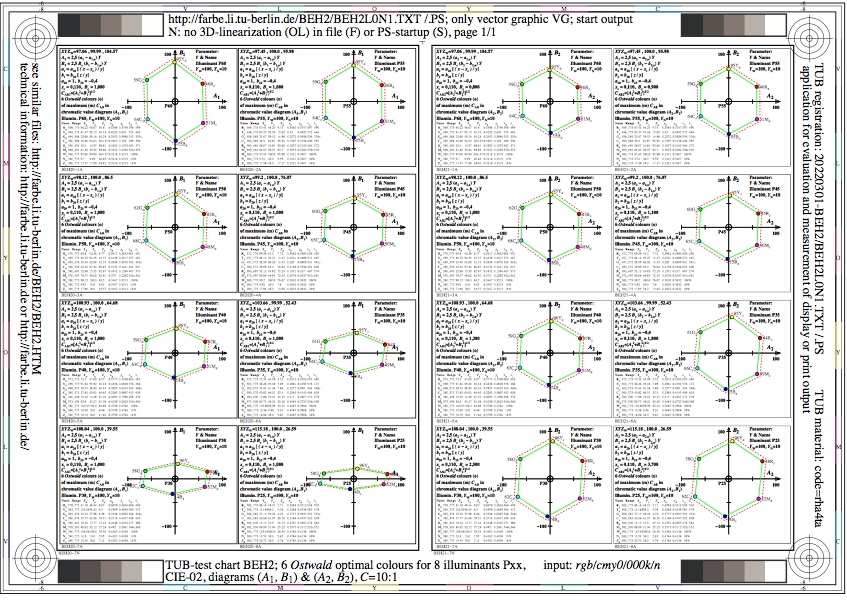
Figure BEH2L0N1.jpg: Output in format A6 of the file
BEH2L0NP.PDF, see
BEH2L0N1.
PS /
TXT /
PDF /
jpg
BEH2: TUB-test chart BEH2; 6 Ostwald optimal colours
for 8 illuminants Pxx, CIE-02-degree observer, chromatic value
diagrams (CAB1, CAB2), contrast C=10:1

Figure BEH3L0N1.jpg: Output in format A6 of the file
BEH3L0NP.PDF, see
BEH3L0N1.
PS /
TXT /
PDF /
jpg
BEH3: TUB-test chart BEH3; 6 Ostwald optimal colours
for 8 illuminants Pxx, CIE-02-degree observer, chromatic value
diagrams (CAB1, CAB2), contrast C=4:1
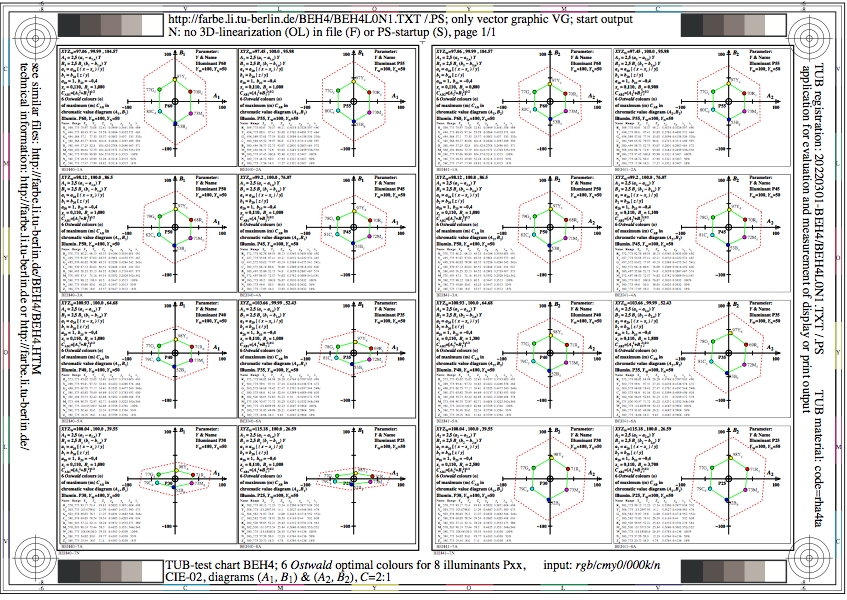
Figure BEH4L0N1.jpg: Output in format A6 of the file
BEH4L0NP.PDF, see
BEH4L0N1.
PS /
TXT /
PDF /
jpg
BEH4: TUB-test chart BEH4; 6 Ostwald optimal colours
for 8 illuminants Pxx, CIE-02-degree observer, chromatic value
diagrams (CAB1, CAB2), contrast C=2:1
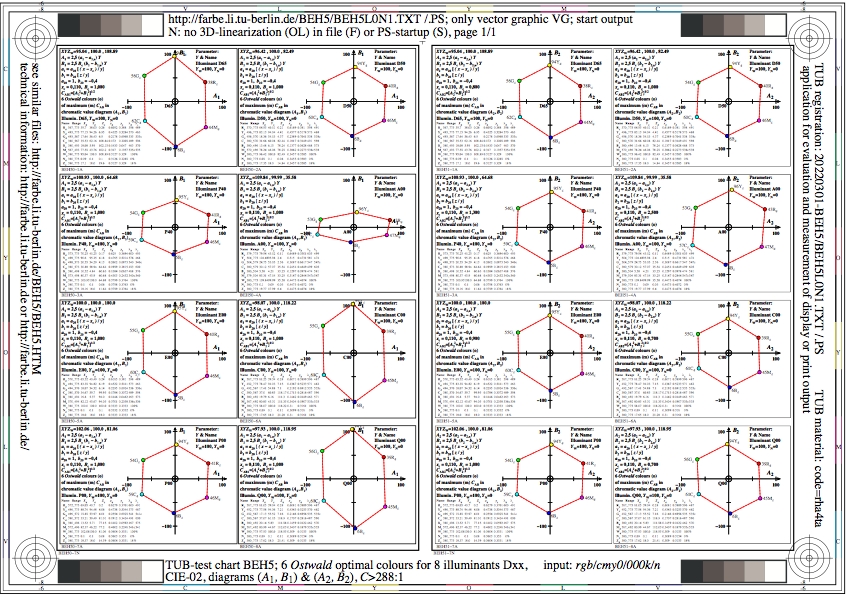
Figure BEH5L0N1.jpg: Output in format A6 of the file
BEH5L0NP.PDF, see
BEH5L0N1.
PS /
TXT /
PDF /
jpg
BEH5: TUB-test chart BEH5; 6 Ostwald optimal colours
for 8 illuminants Dxx, CIE-02-degree observer, chromatic value
diagrams (CAB1, CAB2), contrast C>=288:1
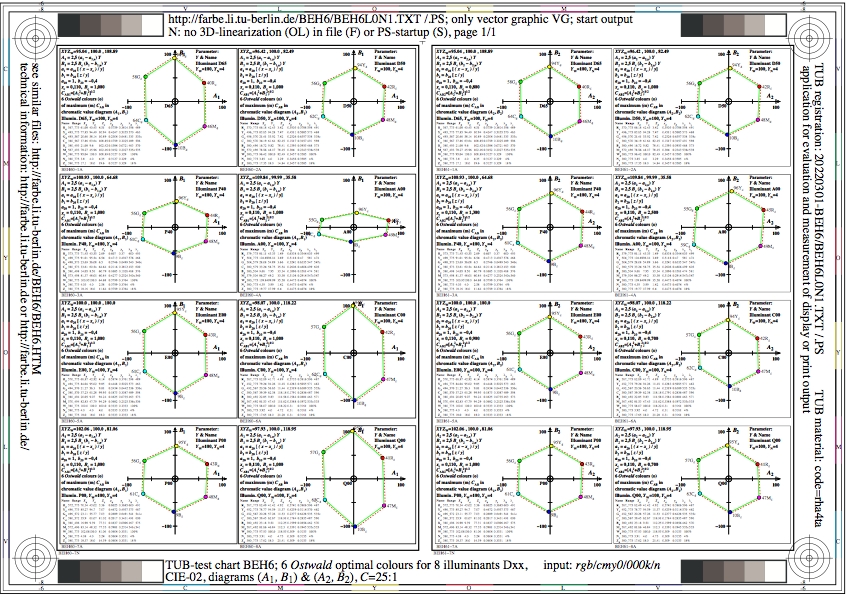
Figure BEH6L0N1.jpg: Output in format A6 of the file
BEH6L0NP.PDF, see
BEH6L0N1.
PS /
TXT /
PDF /
jpg
BEH6: TUB-test chart BEH6; 6 Ostwald optimal colours
for 8 illuminants Dxx, CIE-02-degree observer, chromatic value
diagrams (CAB1, CAB2), contrast C=25:1
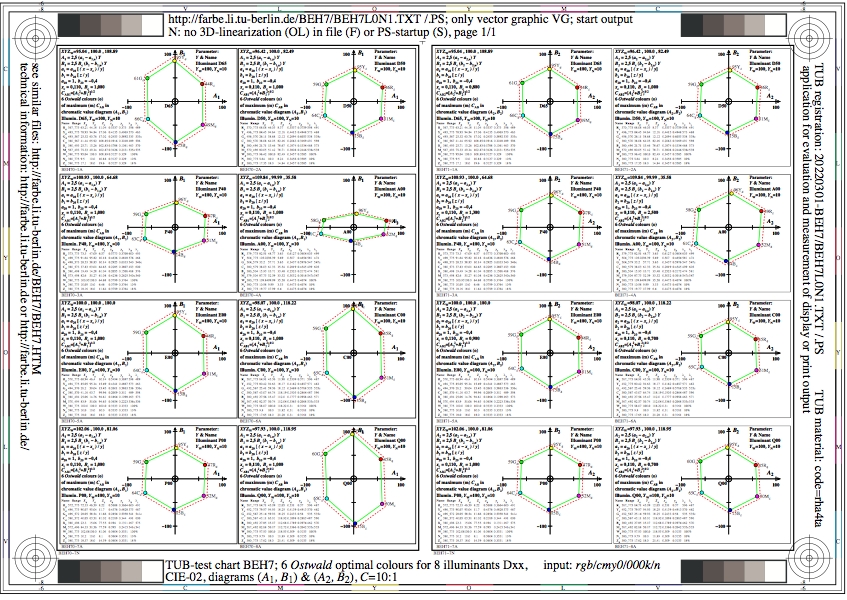
Figure BEH7L0N1.jpg: Output in format A6 of the file
BEH7L0NP.PDF, see
BEH7L0N1.
PS /
TXT /
PDF /
jpg
BEH7: TUB-test chart BEH7; 6 Ostwald optimal colours
for 8 illuminants Dxx, CIE-02-degree observer, chromatic value
diagrams (CAB1, CAB2), contrast C=10:1

Figure BEH8L0N1.jpg: Output in format A6 of the file
BEH8L0NP.PDF, see
BEH8L0N1.
PS /
TXT /
PDF /
jpg
BEH8: TUB-test chart BEH8; 6 Ostwald optimal colours
for 8 illuminants Dxx, CIE-02-degree observer, chromatic value
diagrams (CAB1, CAB2), contrast C=4:1
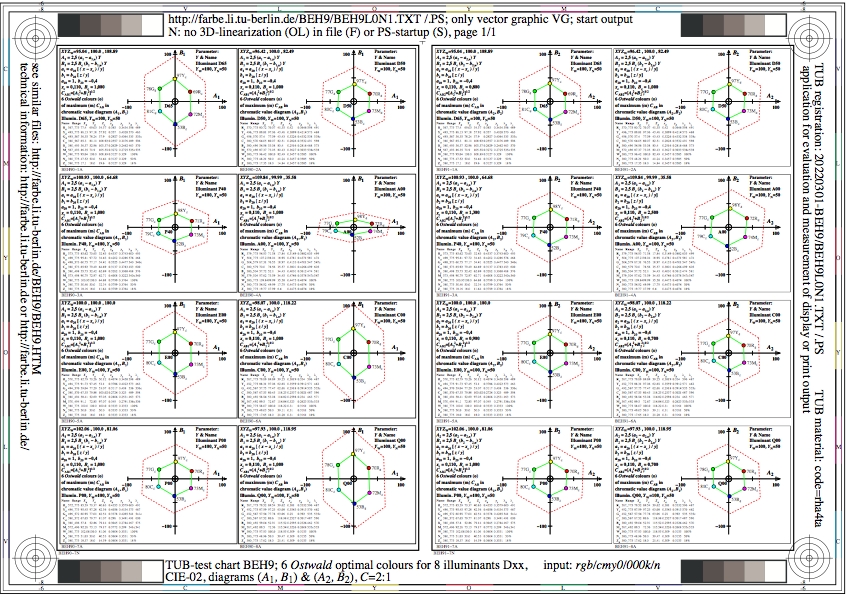
Figure BEH9L0N1.jpg: Output in format A6 of the file
BEH9L0NP.PDF, see
BEH9L0N1.
PS /
TXT /
PDF /
jpg
BEH9: TUB-test chart BEH9; 6 Ostwald optimal colours
for 8 illuminants Dxx, CIE-02-degree observer, chromatic value
diagrams (CAB1, CAB2), contrast C=2:1
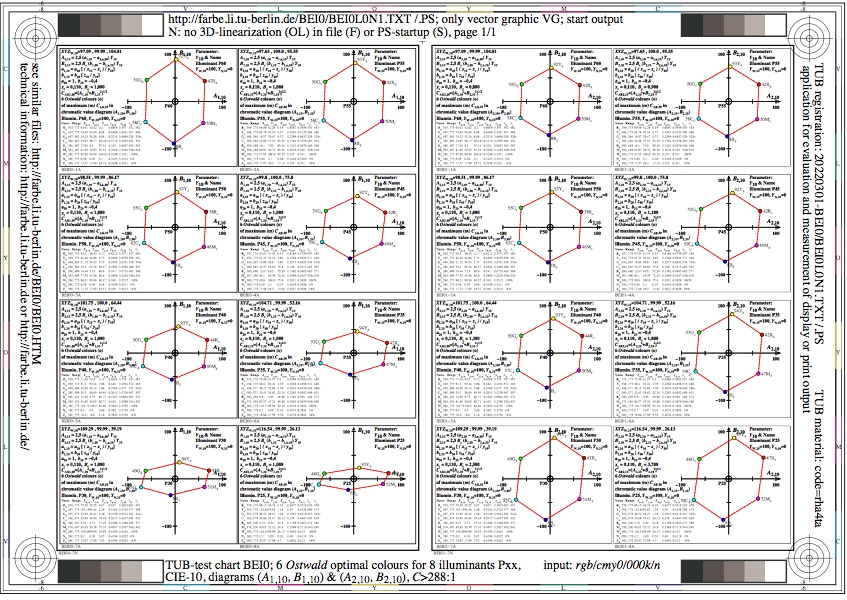
Figure BEI0L0N1.jpg: Output in format A6 of the file
BEI0L0NP.PDF, see
BEI0L0N1.
PS /
TXT /
PDF /
jpg
BEI0: TUB-test chart BEI0; 6 Ostwald optimal colours
for 8 illuminants Pxx, CIE-10-degree observer, chromatic value
diagrams (CAB1, CAB2), contrast C>=288:1

Figure BEI1L0N1.jpg: Output in format A6 of the file
BEI1L0NP.PDF, see
BEI1L0N1.
PS /
TXT /
PDF /
jpg
BEI1: TUB-test chart BEI1; 6 Ostwald optimal colours
for 8 illuminants Pxx, CIE-10-degree observer, chromatic value
diagrams (CAB1, CAB2), contrast C=25:1

Figure BEI2L0N1.jpg: Output in format A6 of the file
BEI2L0NP.PDF, see
BEI2L0N1.
PS /
TXT /
PDF /
jpg
BEI2: TUB-test chart BEI2; 6 Ostwald optimal colours
for 8 illuminants Pxx, CIE-10-degree observer, chromatic value
diagrams (CAB1, CAB2), contrast C=10:1
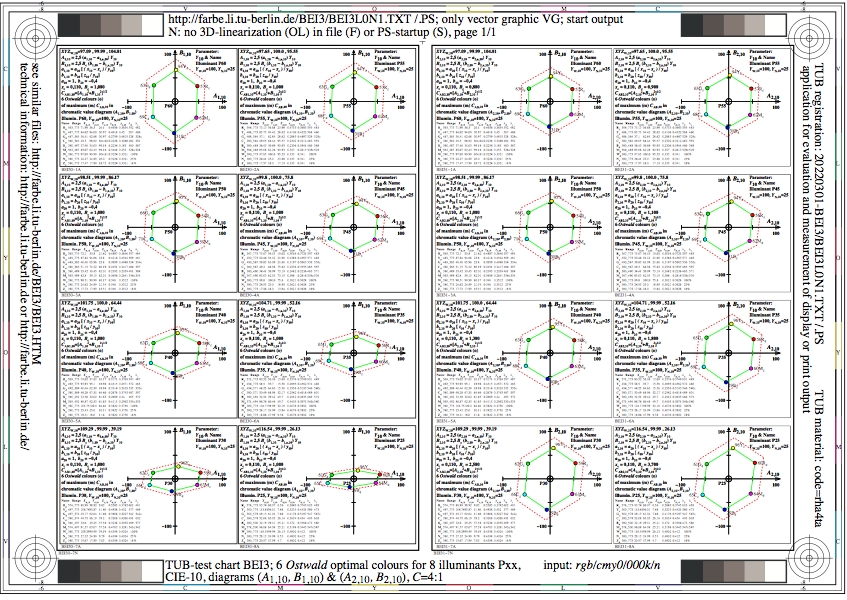
Figure BEI3L0N1.jpg: Output in format A6 of the file
BEI3L0NP.PDF, see
BEI3L0N1.
PS /
TXT /
PDF /
jpg
BEI3: TUB-test chart BEI3; 6 Ostwald optimal colours
for 8 illuminants Pxx, CIE-10-degree observer, chromatic value
diagrams (CAB1, CAB2), contrast C=4:1
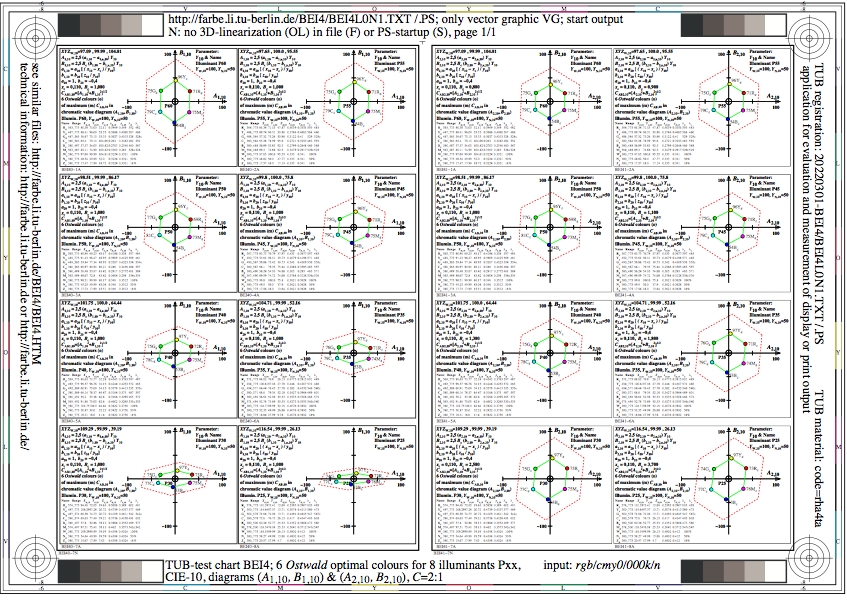
Figure BEI4L0N1.jpg: Output in format A6 of the file
BEI4L0NP.PDF, see
BEI4L0N1.
PS /
TXT /
PDF /
jpg
BEI4: TUB-test chart BEI4; 6 Ostwald optimal colours
for 8 illuminants Pxx, CIE-10-degree observer, chromatic value
diagrams (CAB1, CAB2), contrast C=2:1
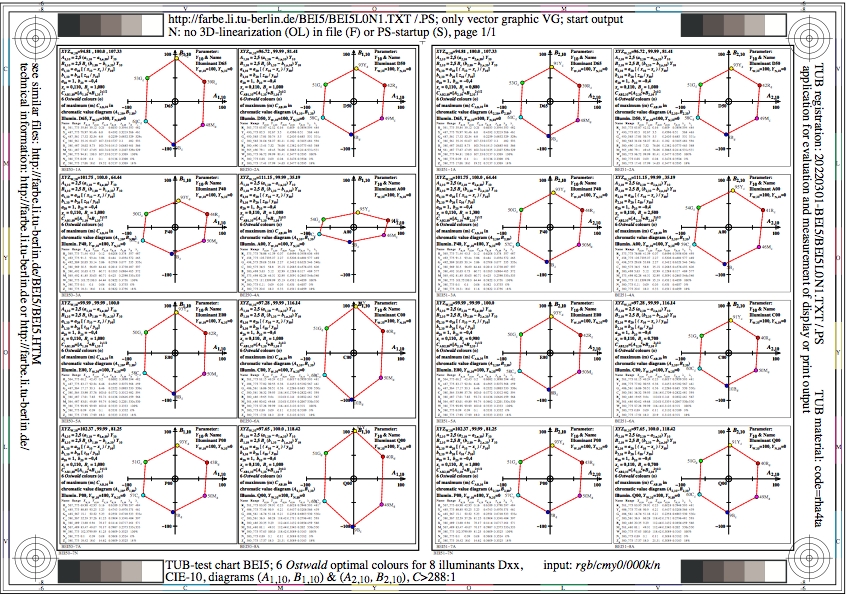
Figure BEI5L0N1.jpg: Output in format A6 of the file
BEI5L0NP.PDF, see
BEI5L0N1.
PS /
TXT /
PDF /
jpg
BEI5: TUB-test chart BEI5; 6 Ostwald optimal colours
for 8 illuminants Dxx, CIE-10-degree observer, chromatic value
diagrams (CAB1, CAB2), contrast C>=288:1
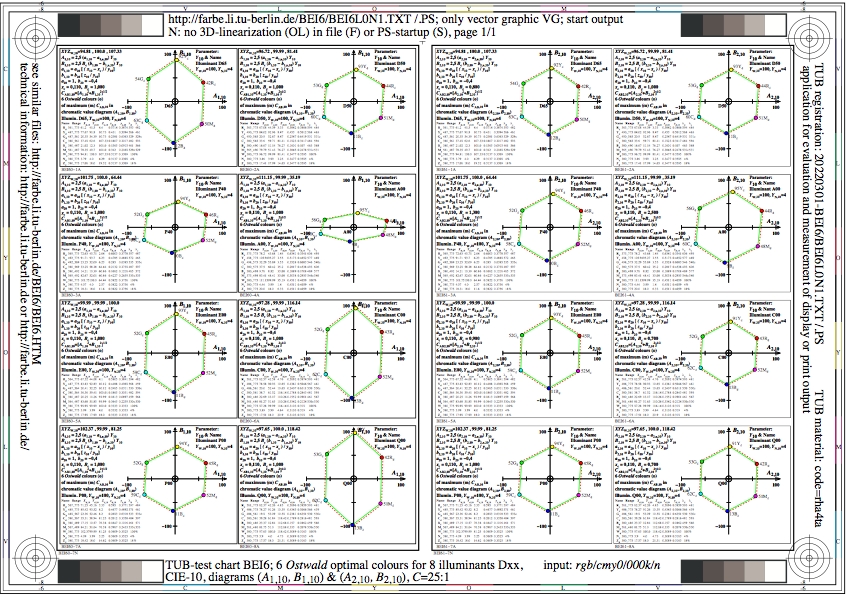
Figure BEI6L0N1.jpg: Output in format A6 of the file
BEI6L0NP.PDF, see
BEI6L0N1.
PS /
TXT /
PDF /
jpg
BEI6: TUB-test chart BEI6; 6 Ostwald optimal colours
for 8 illuminants Dxx, CIE-10-degree observer, chromatic value
diagrams (CAB1, CAB2), contrast C=25:1
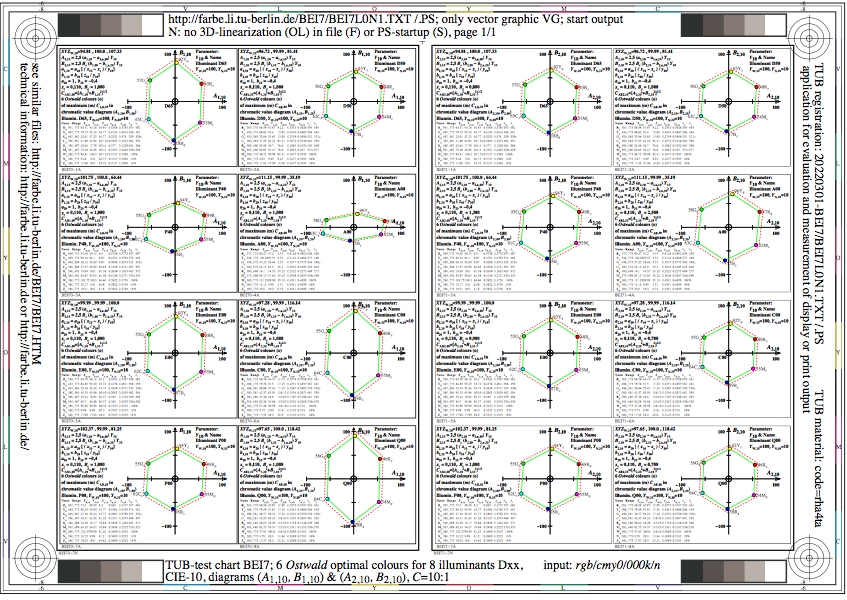
Figure BEI7L0N1.jpg: Output in format A6 of the file
BEI7L0NP.PDF, see
BEI7L0N1.
PS /
TXT /
PDF /
jpg
BEI7: TUB-test chart BEI7; 6 Ostwald optimal colours
for 8 illuminants Dxx, CIE-10-degree observer, chromatic value
diagrams (CAB1, CAB2), contrast C=10:1

Figure BEI8L0N1.jpg: Output in format A6 of the file
BEI8L0NP.PDF, see
BEI8L0N1.
PS /
TXT /
PDF /
jpg
BEI8: TUB-test chart BEI8; 6 Ostwald optimal colours
for 8 illuminants Dxx, CIE-10-degree observer, chromatic value
diagrams (CAB1, CAB2), contrast C=4:1
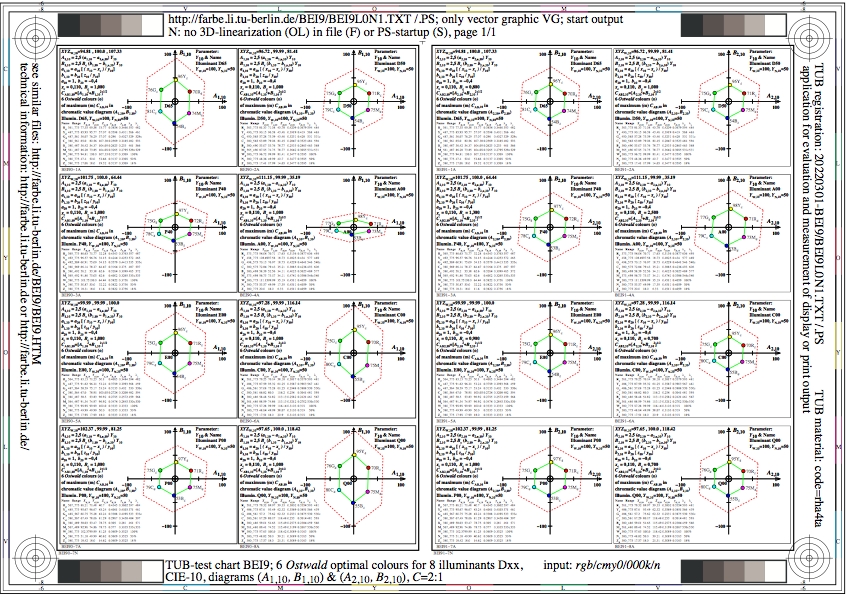
Figure BEI9L0N1.jpg: Output in format A6 of the file
BEI9L0NP.PDF, see
BEI9L0N1.
PS /
TXT /
PDF /
jpg
BEI9: TUB-test chart BEI9; 6 Ostwald optimal colours
for 8 illuminants Dxx, CIE-10-degree observer, chromatic value
diagrams (CAB1, CAB2), contrast C=2:1
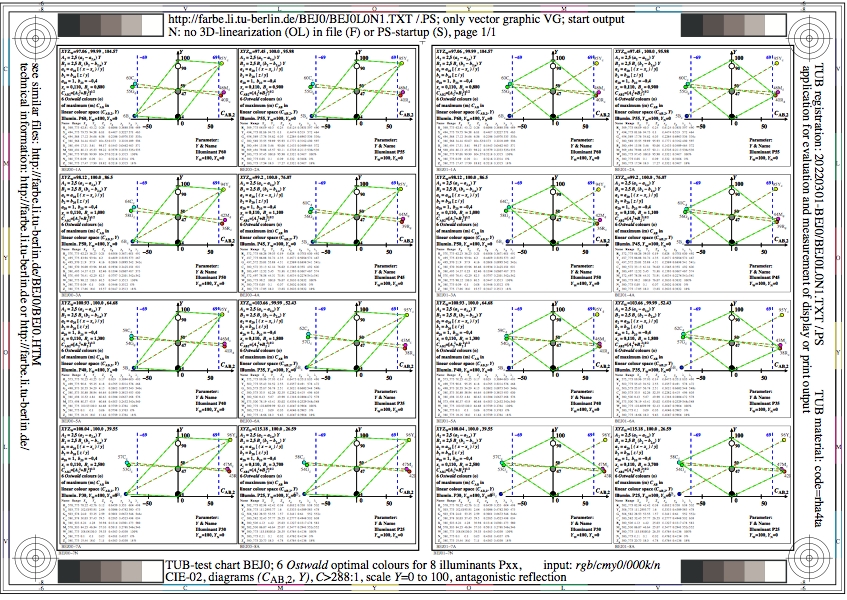
Figure BEJ0L0N1.jpg: Output in format A6 of the file
BEJ0L0NP.PDF, see
BEJ0L0N1.
PS /
TXT /
PDF /
jpg
BEJ0: TUB-test chart BEJ0; 6 Ostwald optimal colours
for 8 illuminants Pxx, CIE-02-degree observer, chromatic value
diagram (CAB2, Y), contrast C>=288:1
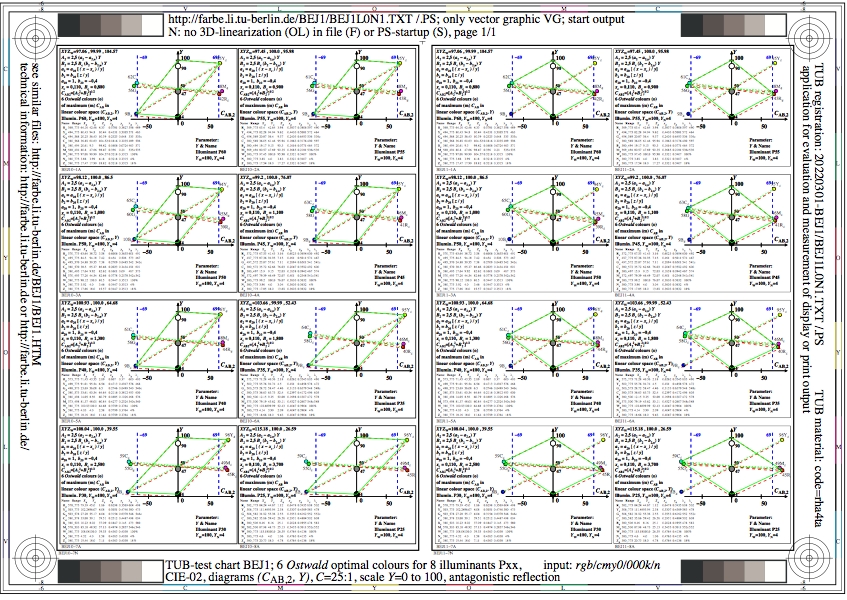
Figure BEJ1L0N1.jpg: Output in format A6 of the file
BEJ1L0NP.PDF, see
BEJ1L0N1.
PS /
TXT /
PDF /
jpg
BEJ1: TUB-test chart BEJ1; 6 Ostwald optimal colours
for 8 illuminants Pxx, CIE-02-degree observer, chromatic value
diagram (CAB2, Y), contrast C=25:1
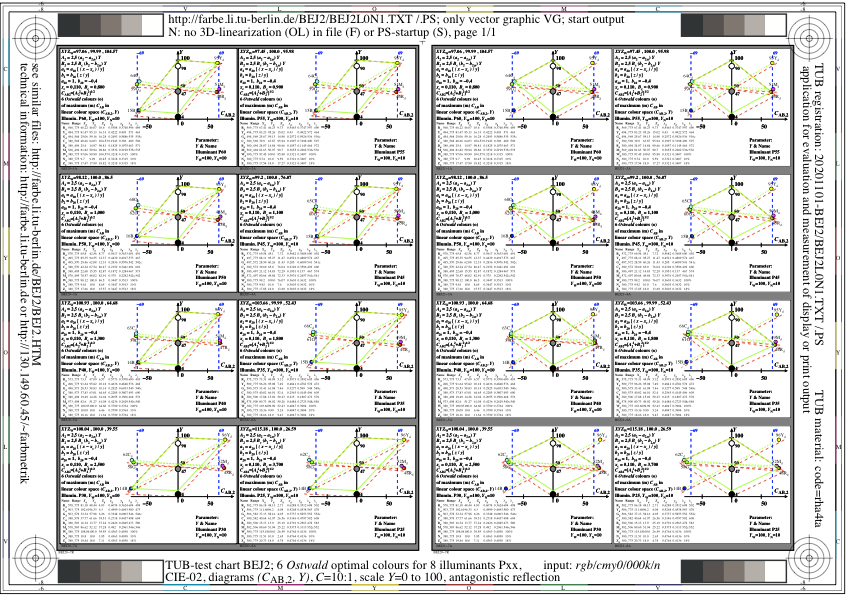
Figure BEJ2L0N1.jpg: Output in format A6 of the file
BEJ2L0NP.PDF, see
BEJ2L0N1.
PS /
TXT /
PDF /
jpg
BEJ2: TUB-test chart BEJ2; 6 Ostwald optimal colours
for 8 illuminants Pxx, CIE-02-degree observer, chromatic value
diagram (CAB2, Y), contrast C=10:1
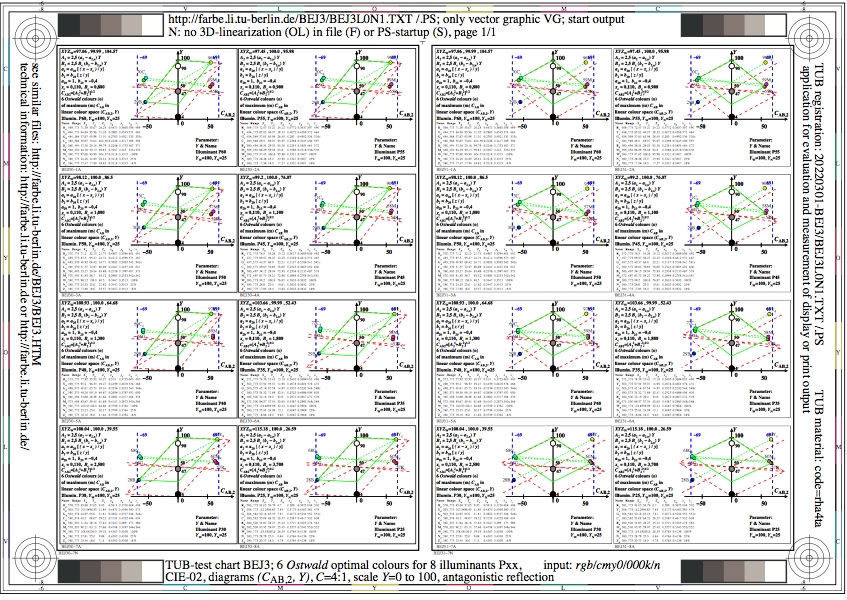
Figure BEJ3L0N1.jpg: Output in format A6 of the file
BEJ3L0NP.PDF, see
BEJ3L0N1.
PS /
TXT /
PDF /
jpg
BEJ3: TUB-test chart BEJ3; 6 Ostwald optimal colours
for 8 illuminants Pxx, CIE-02-degree observer, chromatic value
diagram (CAB2, Y), contrast C=4:1

Figure BEJ4L0N1.jpg: Output in format A6 of the file
BEJ4L0NP.PDF, see
BEJ4L0N1.
PS /
TXT /
PDF /
jpg
BEJ4: TUB-test chart BEJ4; 6 Ostwald optimal colours
for 8 illuminants Pxx, CIE-02-degree observer, chromatic value
diagram (CAB2, Y), contrast C=2:1
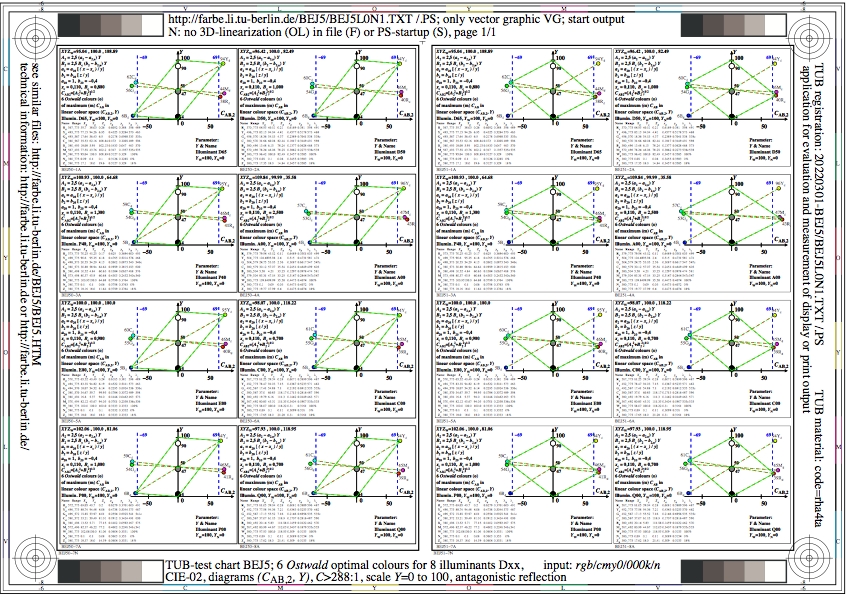
Figure BEJ5L0N1.jpg: Output in format A6 of the file
BEJ5L0NP.PDF, see
BEJ5L0N1.
PS /
TXT /
PDF /
jpg
BEJ5: TUB-test chart BEJ5; 6 Ostwald optimal colours
for 8 illuminants Dxx, CIE-02-degree observer, chromatic value
diagram (CAB2, Y), contrast C>=288:1
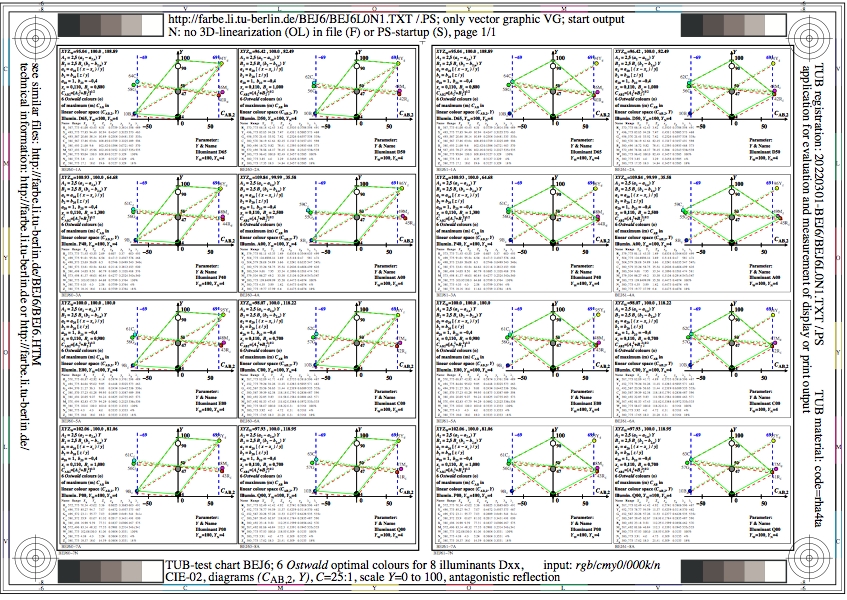
Figure BEJ6L0N1.jpg: Output in format A6 of the file
BEJ6L0NP.PDF, see
BEJ6L0N1.
PS /
TXT /
PDF /
jpg
BEJ6: TUB-test chart BEJ6; 6 Ostwald optimal colours
for 8 illuminants Dxx, CIE-02-degree observer, chromatic value
diagram (CAB2, Y), contrast C=25:1

Figure BEJ7L0N1.jpg: Output in format A6 of the file
BEJ7L0NP.PDF, see
BEJ7L0N1.
PS /
TXT /
PDF /
jpg
BEJ7: TUB-test chart BEJ7; 6 Ostwald optimal colours
for 8 illuminants Dxx, CIE-02-degree observer, chromatic value
diagram (CAB2, Y), contrast C=10:1

Figure BEJ8L0N1.jpg: Output in format A6 of the file
BEJ8L0NP.PDF, see
BEJ8L0N1.
PS /
TXT /
PDF /
jpg
BEJ8: TUB-test chart BEJ8; 6 Ostwald optimal colours
for 8 illuminants Dxx, CIE-02-degree observer, chromatic value
diagram (CAB2, Y), contrast C=4:1
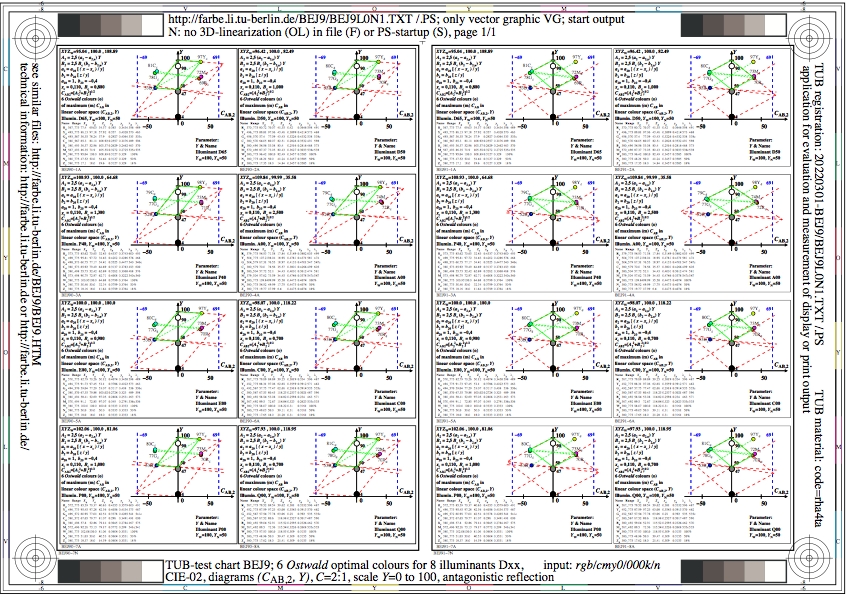
Figure BEJ9L0N1.jpg: Output in format A6 of the file
BEJ9L0NP.PDF, see
BEJ9L0N1.
PS /
TXT /
PDF /
jpg
BEJ9: TUB-test chart BEJ9; 6 Ostwald optimal colours
for 8 illuminants Dxx, CIE-02-degree observer, chromatic value
diagram (CAB2, Y), contrast C=2:1

Figure BEK0L0N1.jpg: Output in format A6 of the file
BEK0L0NP.PDF, see
BEK0L0N1.
PS /
TXT /
PDF /
jpg
BEK0: TUB-test chart BEK0; 6 Ostwald optimal colours
for 8 illuminants Pxx, CIE-10-degree observer, chromatic value
diagram (CAB2, Y), contrast C>=288:1

Figure BEK1L0N1.jpg: Output in format A6 of the file
BEK1L0NP.PDF, see
BEK1L0N1.
PS /
TXT /
PDF /
jpg
BEK1: TUB-test chart BEK1; 6 Ostwald optimal colours
for 8 illuminants Pxx, CIE-10-degree observer, chromatic value
diagram (CAB2, Y), contrast C=25:1
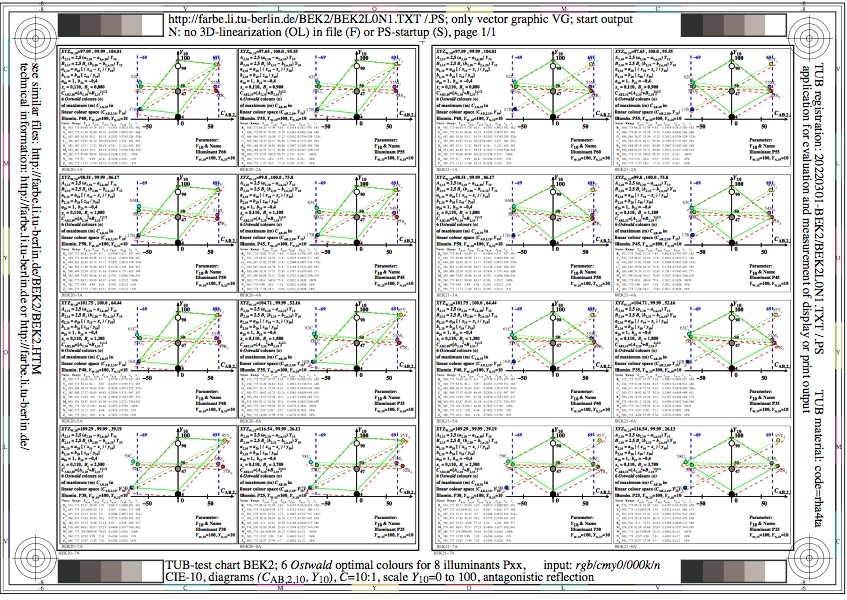
Figure BEK2L0N1.jpg: Output in format A6 of the file
BEK2L0NP.PDF, see
BEK2L0N1.
PS /
TXT /
PDF /
jpg
BEK2: TUB-test chart BEK2; 6 Ostwald optimal colours
for 8 illuminants Pxx, CIE-10-degree observer, chromatic value
diagram (CAB2, Y), contrast C=10:1

Figure BEK3L0N1.jpg: Output in format A6 of the file
BEK3L0NP.PDF, see
BEK3L0N1.
PS /
TXT /
PDF /
jpg
BEK3: TUB-test chart BEK3; 6 Ostwald optimal colours
for 8 illuminants Pxx, CIE-10-degree observer, chromatic value
diagram (CAB2, Y), contrast C=4:1
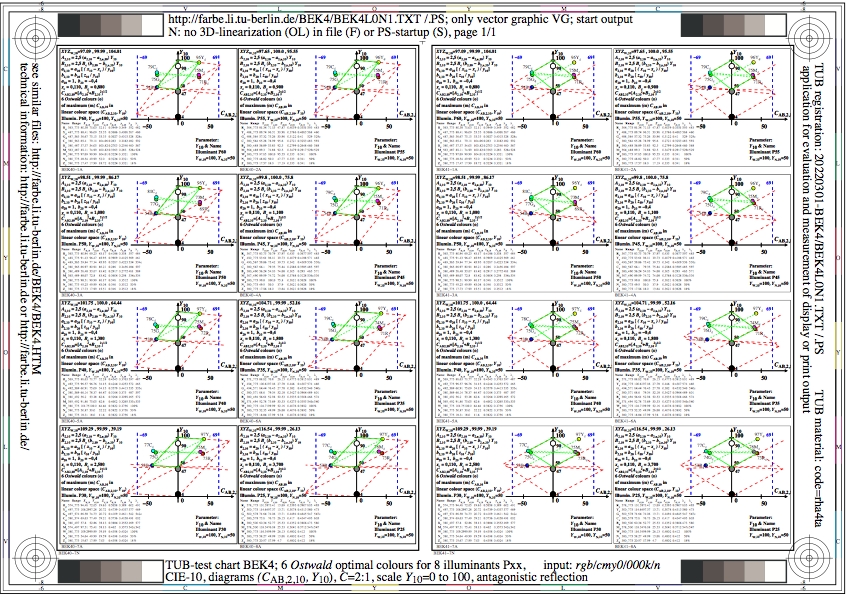
Figure BEK4L0N1.jpg: Output in format A6 of the file
BEK4L0NP.PDF, see
BEK4L0N1.
PS /
TXT /
PDF /
jpg
BEK4: TUB-test chart BEK4; 6 Ostwald optimal colours
for 8 illuminants Pxx, CIE-10-degree observer, chromatic value
diagram (CAB2, Y), contrast C=2:1

Figure BEK5L0N1.jpg: Output in format A6 of the file
BEK5L0NP.PDF, see
BEK5L0N1.
PS /
TXT /
PDF /
jpg
BEK5: TUB-test chart BEK5; 6 Ostwald optimal colours
for 8 illuminants Dxx, CIE-10-degree observer, chromatic value
diagram (CAB2, Y), contrast C>=288:1

Figure BEK6L0N1.jpg: Output in format A6 of the file
BEK6L0NP.PDF, see
BEK6L0N1.
PS /
TXT /
PDF /
jpg
BEK6: TUB-test chart BEK6; 6 Ostwald optimal colours
for 8 illuminants Dxx, CIE-10-degree observer, chromatic value
diagram (CAB2, Y), contrast C=25:1

Figure BEK7L0N1.jpg: Output in format A6 of the file
BEK7L0NP.PDF, see
BEK7L0N1.
PS /
TXT /
PDF /
jpg
BEK7: TUB-test chart BEK7; 6 Ostwald optimal colours
for 8 illuminants Dxx, CIE-10-degree observer, chromatic value
diagram (CAB2, Y), contrast C=10:1

Figure BEK8L0N1.jpg: Output in format A6 of the file
BEK8L0NP.PDF, see
BEK8L0N1.
PS /
TXT /
PDF /
jpg
BEK8: TUB-test chart BEK8; 6 Ostwald optimal colours
for 8 illuminants Dxx, CIE-10-degree observer, chromatic value
diagram (CAB2, Y), contrast C=4:1
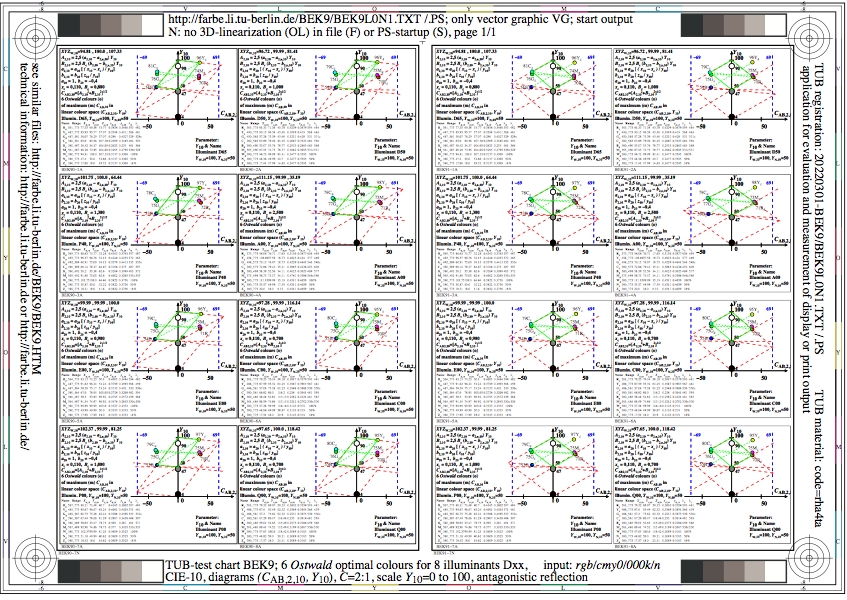
Figure BEK9L0N1.jpg: Output in format A6 of the file
BEK9L0NP.PDF, see
BEK9L0N1.
PS /
TXT /
PDF /
jpg
BEK9: TUB-test chart BEK9; 6 Ostwald optimal colours
for 8 illuminants Dxx, CIE-10-degree observer, chromatic value
diagram (CAB2, Y), contrast C=2:1
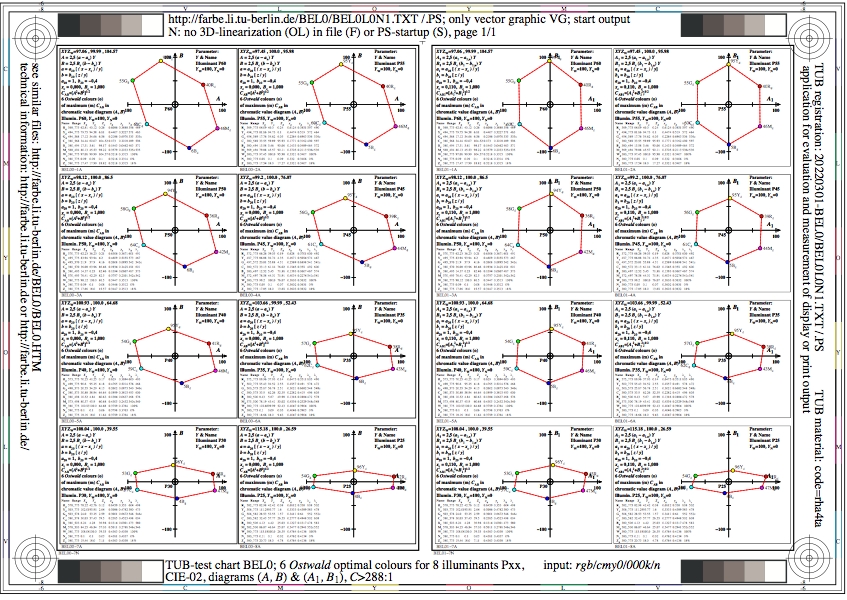
Figure BEL0L0N1.jpg: Output in format A6 of the file
BEL0L0NP.PDF, see
BEL0L0N1.
PS /
TXT /
PDF /
jpg
BEL0: TUB-test chart BEL0; 6 Ostwald optimal colours
for 8 illuminants Pxx, CIE-02-degree observer, chromatic value
diagrams CAB CAB1, contrast C>=288:1
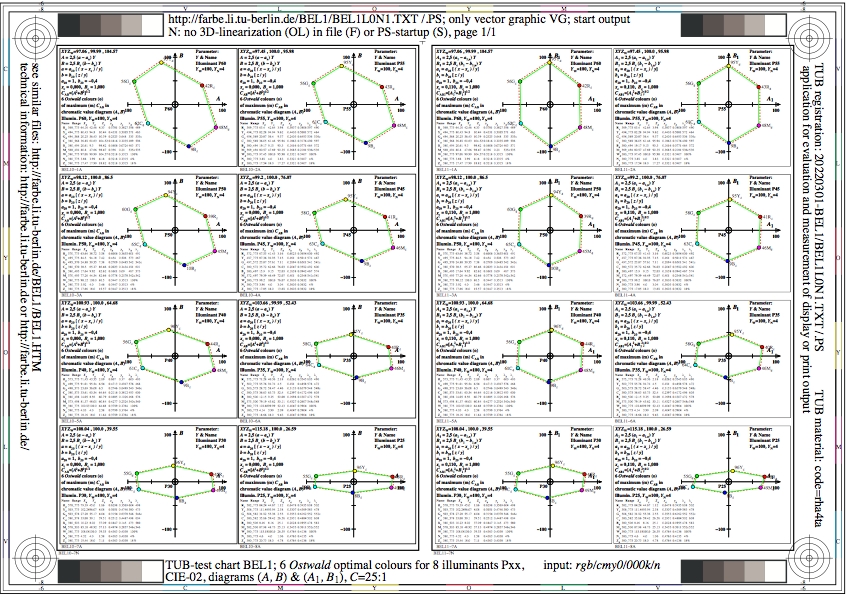
Figure BEL1L0N1.jpg: Output in format A6 of the file
BEL1L0NP.PDF, see
BEL1L0N1.
PS /
TXT /
PDF /
jpg
BEL1: TUB-test chart BEL1; 6 Ostwald optimal colours
for 8 illuminants Pxx, CIE-02-degree observer, chromatic value
diagrams CAB CAB1, contrast C=25:1

Figure BEL2L0N1.jpg: Output in format A6 of the file
BEL2L0NP.PDF, see
BEL2L0N1.
PS /
TXT /
PDF /
jpg
BEL2: TUB-test chart BEL2; 6 Ostwald optimal colours
for 8 illuminants Pxx, CIE-02-degree observer, chromatic value
diagrams CAB CAB1, contrast C=10:1
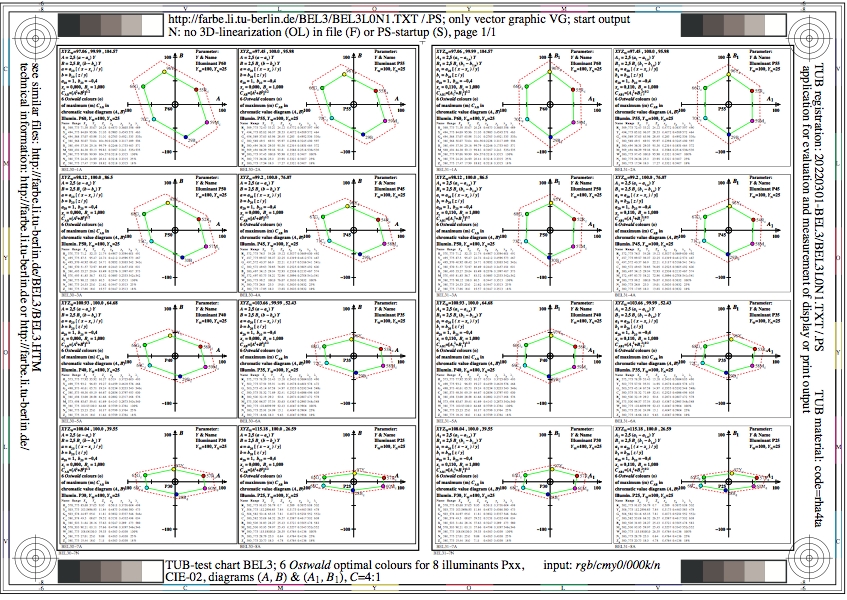
Figure BEL3L0N1.jpg: Output in format A6 of the file
BEL3L0NP.PDF, see
BEL3L0N1.
PS /
TXT /
PDF /
jpg
BEL3: TUB-test chart BEL3; 6 Ostwald optimal colours
for 8 illuminants Pxx, CIE-02-degree observer, chromatic value
diagrams CAB CAB1, contrast C=4:1
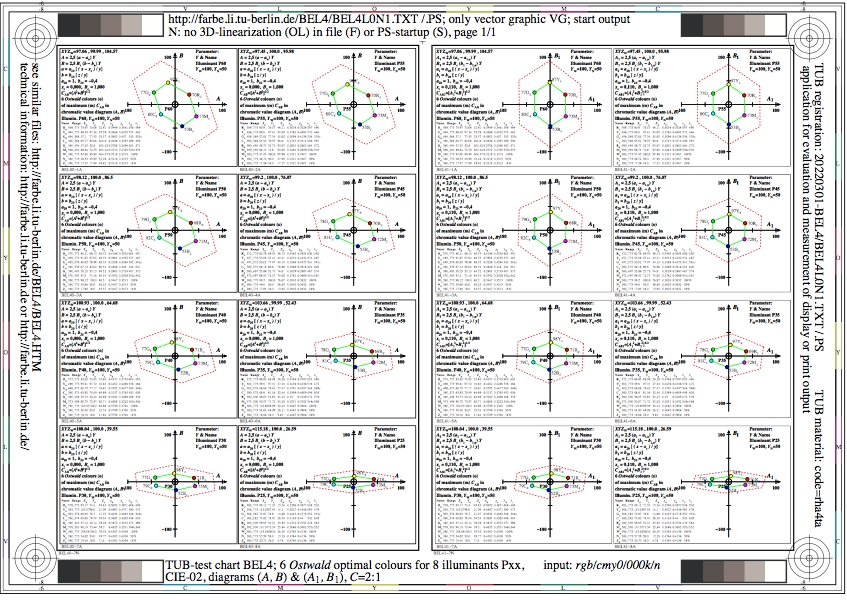
Figure BEL4L0N1.jpg: Output in format A6 of the file
BEL4L0NP.PDF, see
BEL4L0N1.
PS /
TXT /
PDF /
jpg
BEL4: TUB-test chart BEL4; 6 Ostwald optimal colours
for 8 illuminants Pxx, CIE-02-degree observer, chromatic value
diagrams CAB CAB1, contrast C=2:1

Figure BEL5L0N1.jpg: Output in format A6 of the file
BEL5L0NP.PDF, see
BEL5L0N1.
PS /
TXT /
PDF /
jpg
BEL5: TUB-test chart BEL5; 6 Ostwald optimal colours
for 8 illuminants Dxx, CIE-02-degree observer, chromatic value
diagrams CAB CAB1, contrast C>=288:1
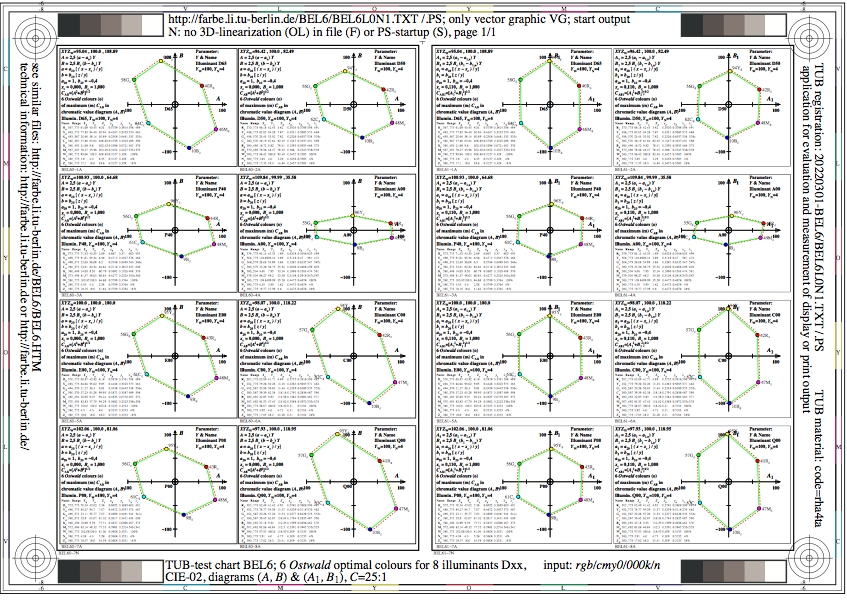
Figure BEL6L0N1.jpg: Output in format A6 of the file
BEL6L0NP.PDF, see
BEL6L0N1.
PS /
TXT /
PDF /
jpg
BEL6: TUB-test chart BEL6; 6 Ostwald optimal colours
for 8 illuminants Dxx, CIE-02-degree observer, chromatic value
diagrams CAB CAB1, contrast C=25:1
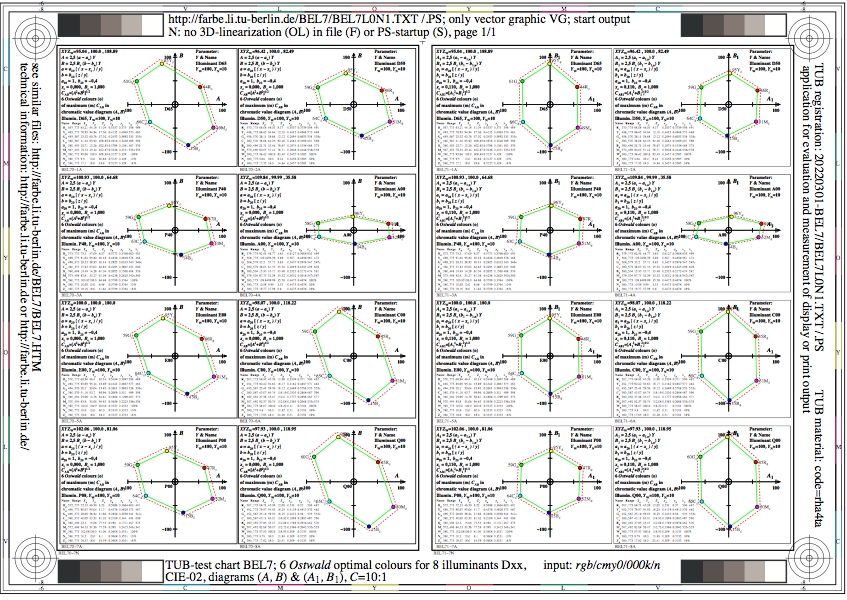
Figure BEL7L0N1.jpg: Output in format A6 of the file
BEL7L0NP.PDF, see
BEL7L0N1.
PS /
TXT /
PDF /
jpg
BEL7: TUB-test chart BEL7; 6 Ostwald optimal colours
for 8 illuminants Dxx, CIE-02-degree observer, chromatic value
diagrams CAB CAB1, contrast C=10:1
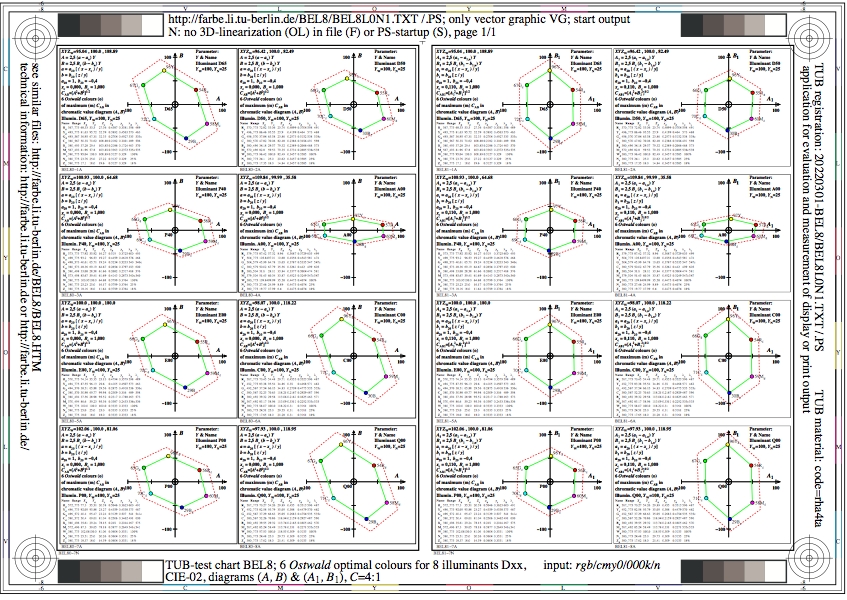
Figure BEL8L0N1.jpg: Output in format A6 of the file
BEL8L0NP.PDF, see
BEL8L0N1.
PS /
TXT /
PDF /
jpg
BEL8: TUB-test chart BEL8; 6 Ostwald optimal colours
for 8 illuminants Dxx, CIE-02-degree observer, chromatic value
diagrams CAB CAB1, contrast C=4:1
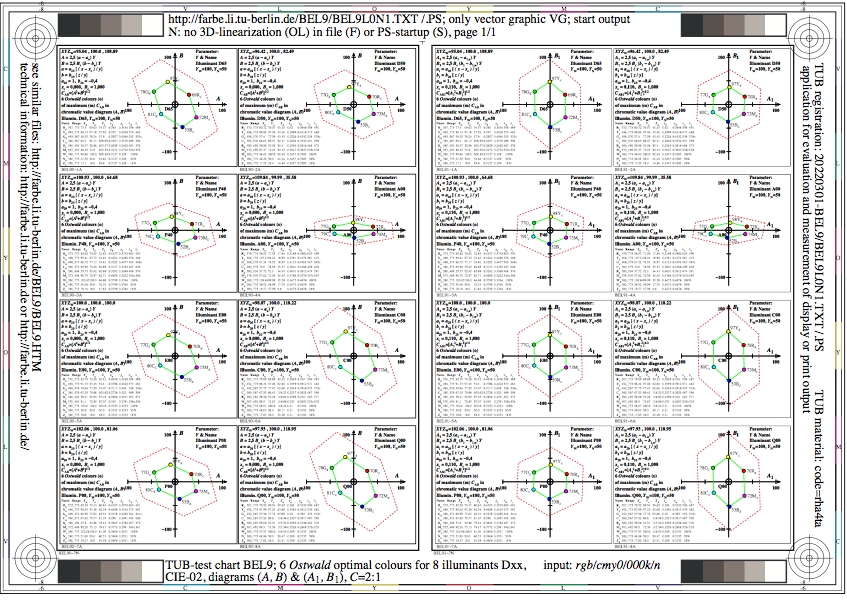
Figure BEL9L0N1.jpg: Output in format A6 of the file
BEL9L0NP.PDF, see
BEL9L0N1.
PS /
TXT /
PDF /
jpg
BEL9: TUB-test chart BEL9; 6 Ostwald optimal colours
for 8 illuminants Dxx, CIE-02-degree observer, chromatic value
diagrams CAB CAB1, contrast C=2:1

Figure BEM0L0N1.jpg: Output in format A6 of the file
BEM0L0NP.PDF, see
BEM0L0N1.
PS /
TXT /
PDF /
jpg
BEM0: TUB-test chart BEM0; 6 Ostwald optimal colours
for 8 illuminants Pxx, CIE-10-degree observer, chromatic value
diagrams CAB CAB1, contrast C>=288:1

Figure BEM1L0N1.jpg: Output in format A6 of the file
BEM1L0NP.PDF, see
BEM1L0N1.
PS /
TXT /
PDF /
jpg
BEM1: TUB-test chart BEM1; 6 Ostwald optimal colours
for 8 illuminants Pxx, CIE-10-degree observer, chromatic value
diagrams CAB CAB1, contrast C=25:1

Figure BEM2L0N1.jpg: Output in format A6 of the file
BEM2L0NP.PDF, see
BEM2L0N1.
PS /
TXT /
PDF /
jpg
BEM2: TUB-test chart BEM2; 6 Ostwald optimal colours
for 8 illuminants Pxx, CIE-10-degree observer, chromatic value
diagrams CAB CAB1, contrast C=10:1
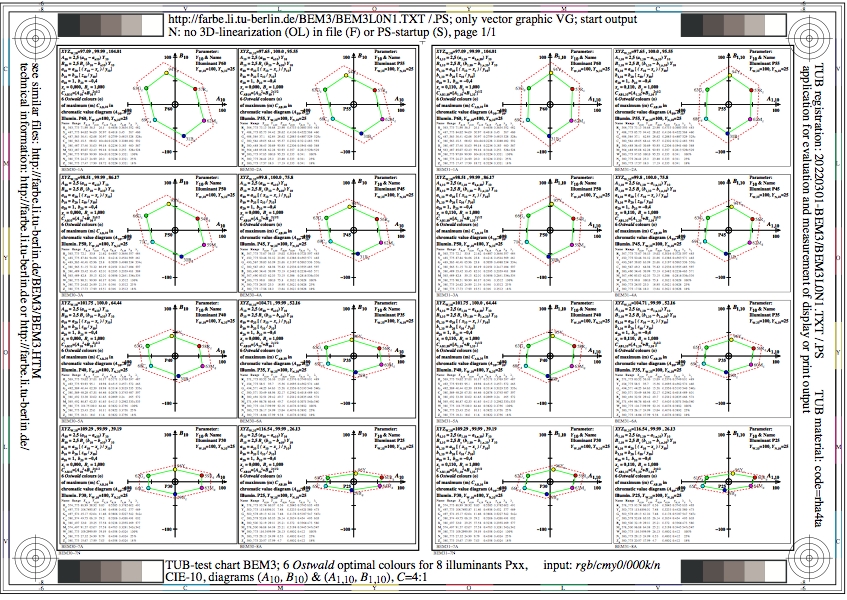
Figure BEM3L0N1.jpg: Output in format A6 of the file
BEM3L0NP.PDF, see
BEM3L0N1.
PS /
TXT /
PDF /
jpg
BEM3: TUB-test chart BEM3; 6 Ostwald optimal colours
for 8 illuminants Pxx, CIE-10-degree observer, chromatic value
diagrams CAB CAB1, contrast C=4:1
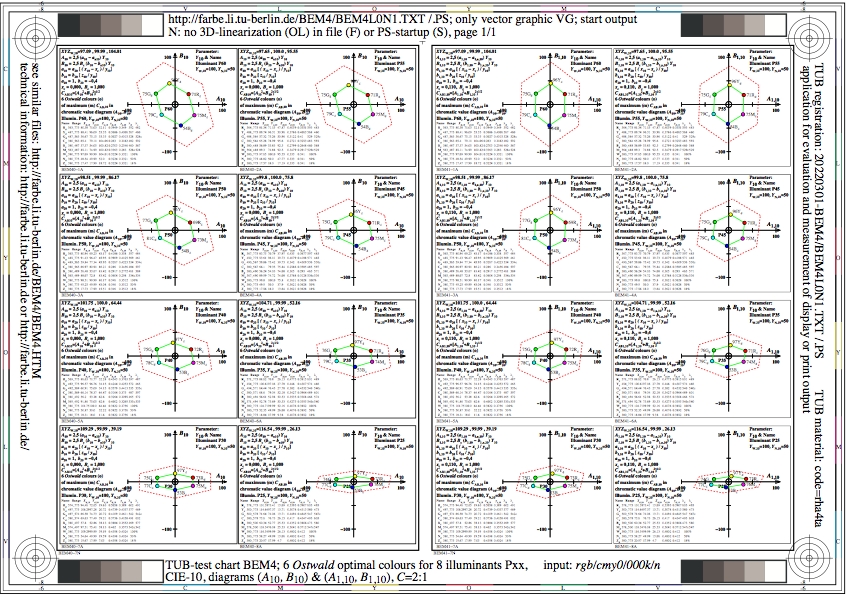
Figure BEM4L0N1.jpg: Output in format A6 of the file
BEM4L0NP.PDF, see
BEM4L0N1.
PS /
TXT /
PDF /
jpg
BEM4: TUB-test chart BEM4; 6 Ostwald optimal colours
for 8 illuminants Pxx, CIE-10-degree observer, chromatic value
diagrams CAB CAB1, contrast C=2:1
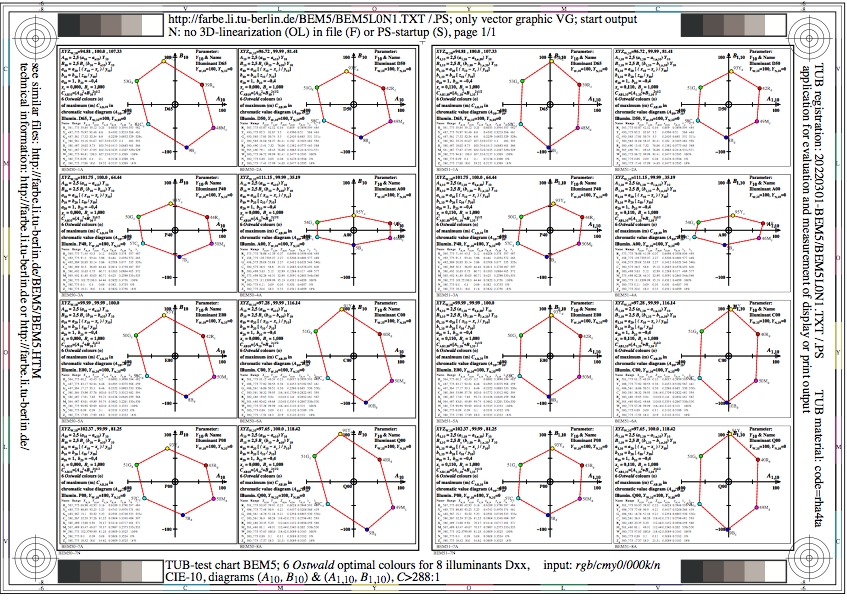
Figure BEM5L0N1.jpg: Output in format A6 of the file
BEM5L0NP.PDF, see
BEM5L0N1.
PS /
TXT /
PDF /
jpg
BEM5: TUB-test chart BEM5; 6 Ostwald optimal colours
for 8 illuminants Dxx, CIE-10-degree observer, chromatic value
diagrams CAB CAB1, contrast C>=288:1
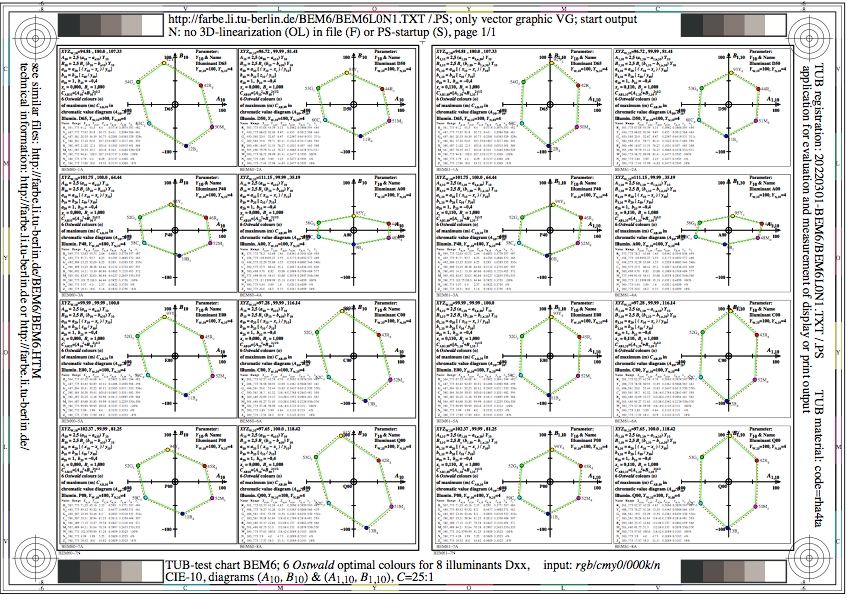
Figure BEM6L0N1.jpg: Output in format A6 of the file
BEM6L0NP.PDF, see
BEM6L0N1.
PS /
TXT /
PDF /
jpg
BEM6: TUB-test chart BEM6; 6 Ostwald optimal colours
for 8 illuminants Dxx, CIE-10-degree observer, chromatic value
diagrams CAB CAB1, contrast C=25:1
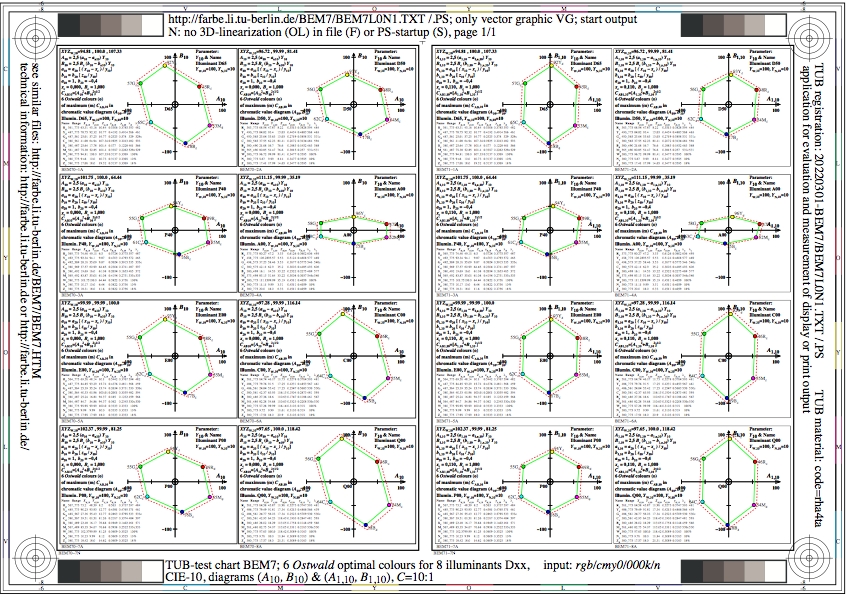
Figure BEM7L0N1.jpg: Output in format A6 of the file
BEM7L0NP.PDF, see
BEM7L0N1.
PS /
TXT /
PDF /
jpg
BEM7: TUB-test chart BEM7; 6 Ostwald optimal colours
for 8 illuminants Dxx, CIE-10-degree observer, chromatic value
diagrams CAB CAB1, contrast C=10:1

Figure BEM8L0N1.jpg: Output in format A6 of the file
BEM8L0NP.PDF, see
BEM8L0N1.
PS /
TXT /
PDF /
jpg
BEM8: TUB-test chart BEM8; 6 Ostwald optimal colours
for 8 illuminants Dxx, CIE-10-degree observer, chromatic value
diagrams CAB CAB1, contrast C=4:1
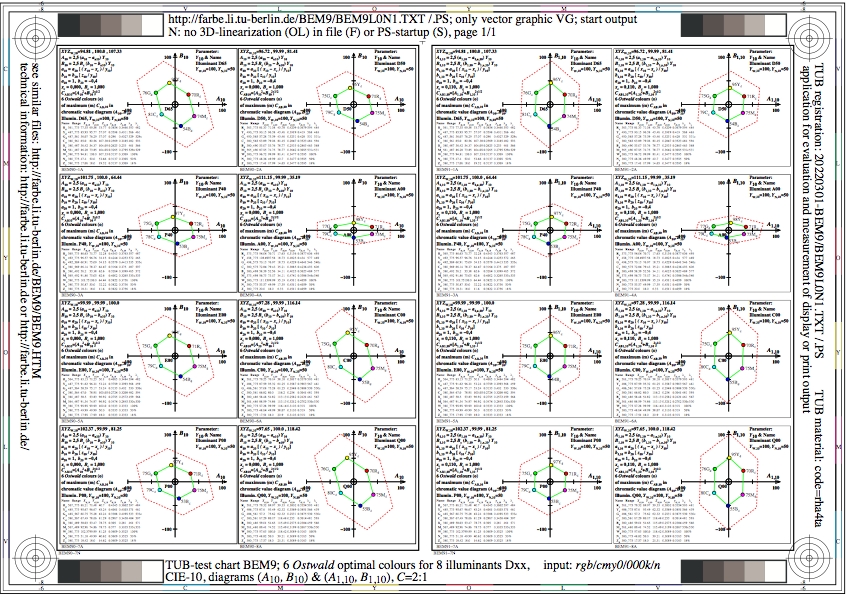
Figure BEM9L0N1.jpg: Output in format A6 of the file
BEM9L0NP.PDF, see
BEM9L0N1.
PS /
TXT /
PDF /
jpg
BEM9: TUB-test chart BEM9; 6 Ostwald optimal colours
for 8 illuminants Dxx, CIE-10-degree observer, chromatic value
diagrams CAB CAB1, contrast C=2:1

Figure BEN0L0N1.jpg: Output in format A6 of the file
BEN0L0NP.PDF, see
BEN0L0N1.
PS /
TXT /
PDF /
jpg
BEN0: TUB-test chart BEN0; 6 Ostwald optimal colours
for 8 illuminants Pxx, CIE-02-degree observer, chromatic value
diagram (CAB2, Y), C>=288:1, -50<=Ya<=50
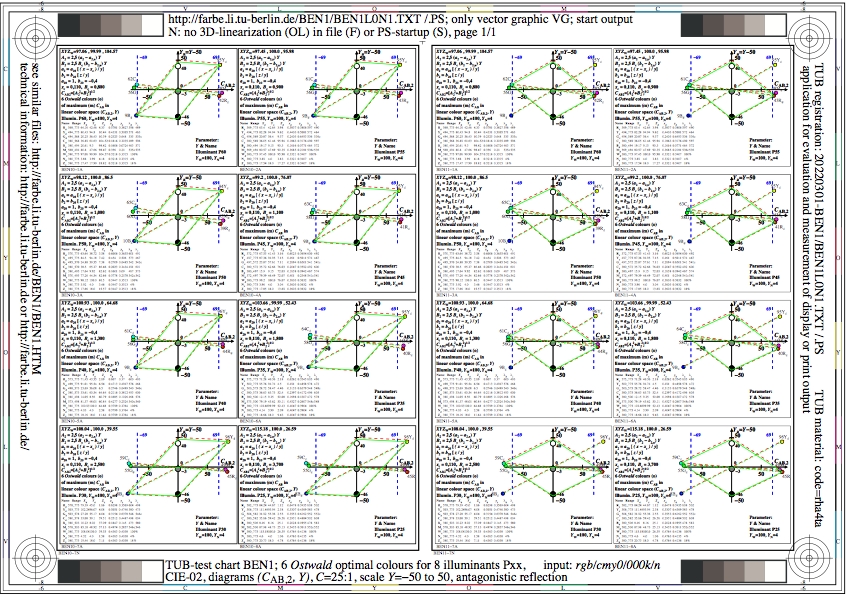
Figure BEN1L0N1.jpg: Output in format A6 of the file
BEN1L0NP.PDF, see
BEN1L0N1.
PS /
TXT /
PDF /
jpg
BEN1: TUB-test chart BEN1; 6 Ostwald optimal colours
for 8 illuminants Pxx, CIE-02-degree observer, chromatic value
diagram (CAB2, Y), C=25:1, -50<=Ya<=50
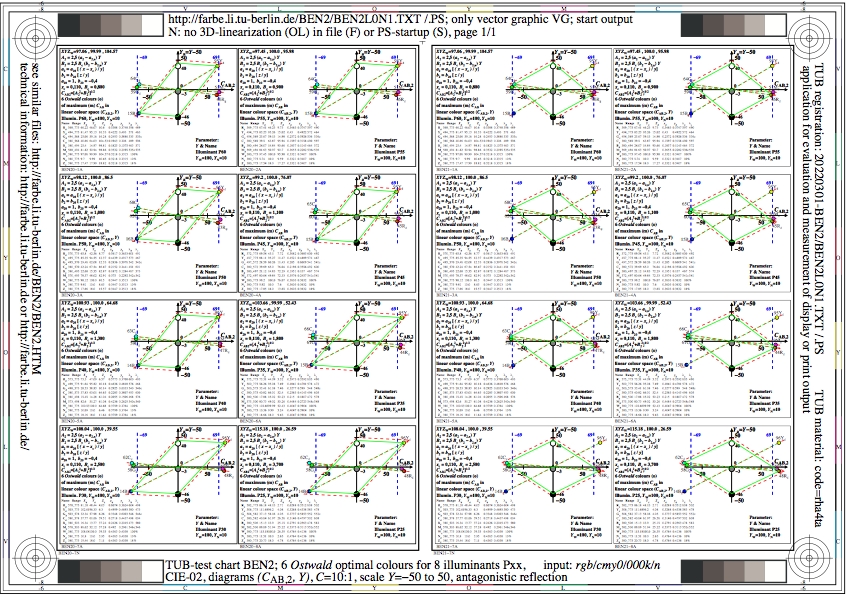
Figure BEN2L0N1.jpg: Output in format A6 of the file
BEN2L0NP.PDF, see
BEN2L0N1.
PS /
TXT /
PDF /
jpg
BEN2: TUB-test chart BEN2; 6 Ostwald optimal colours
for 8 illuminants Pxx, CIE-02-degree observer, chromatic value
diagram (CAB2, Y), C=10:1, -50<=Ya<=50
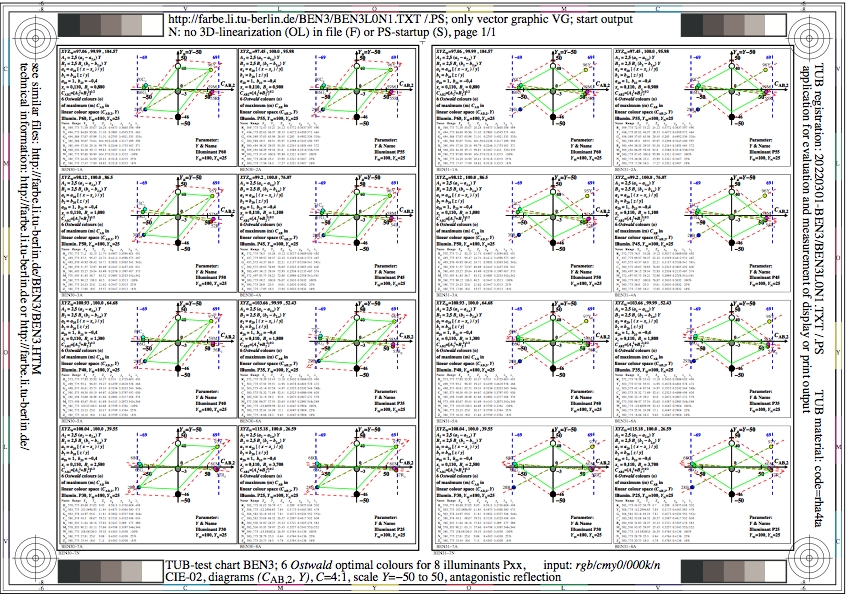
Figure BEN3L0N1.jpg: Output in format A6 of the file
BEN3L0NP.PDF, see
BEN3L0N1.
PS /
TXT /
PDF /
jpg
BEN3: TUB-test chart BEN3; 6 Ostwald optimal colours
for 8 illuminants Pxx, CIE-02-degree observer, chromatic value
diagram (CAB2, Y), C=4:1, -50<=Ya<=50
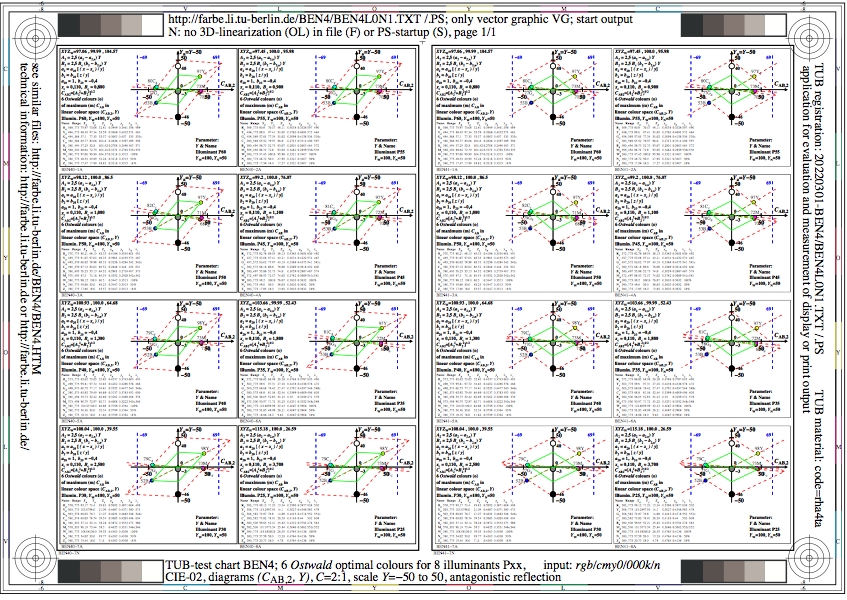
Figure BEN4L0N1.jpg: Output in format A6 of the file
BEN4L0NP.PDF, see
BEN4L0N1.
PS /
TXT /
PDF /
jpg
BEN4: TUB-test chart BEN4; 6 Ostwald optimal colours
for 8 illuminants Pxx, CIE-02-degree observer, chromatic value
diagram (CAB2, Y), C=2:1, -50<=Ya<=50
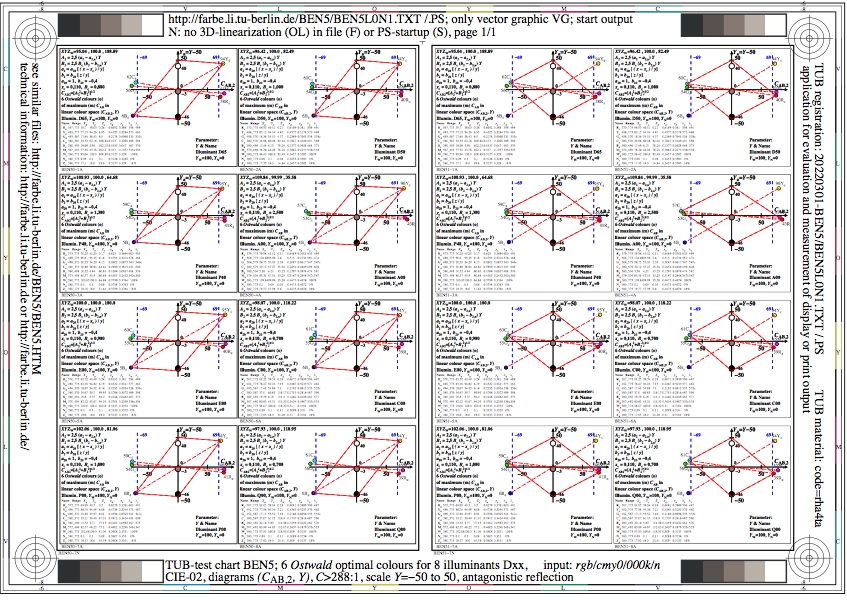
Figure BEN5L0N1.jpg: Output in format A6 of the file
BEN5L0NP.PDF, see
BEN5L0N1.
PS /
TXT /
PDF /
jpg
BEN5: TUB-test chart BEN5; 6 Ostwald optimal colours
for 8 illuminants Dxx, CIE-02-degree observer, chromatic value
diagram (CAB2, Y), C>=288:1, -50<=Ya<=50
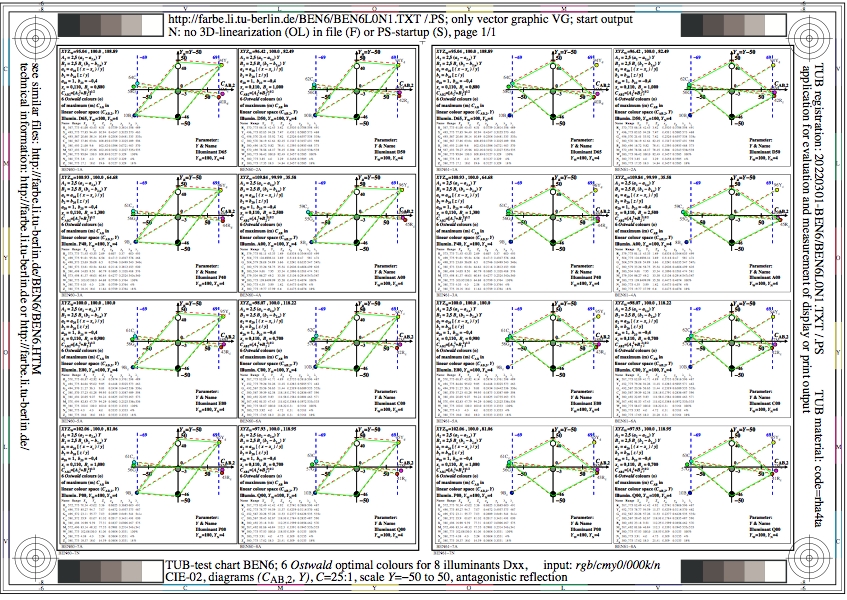
Figure BEN6L0N1.jpg: Output in format A6 of the file
BEN6L0NP.PDF, see
BEN6L0N1.
PS /
TXT /
PDF /
jpg
BEN6: TUB-test chart BEN6; 6 Ostwald optimal colours
for 8 illuminants Dxx, CIE-02-degree observer, chromatic value
diagram (CAB2, Y), C=25:1, Y-transfer
Figure BEN7L0N1.jpg: Output in format A6 of the file
BEN7L0NP.PDF, see
BEN7L0N1.
PS /
TXT /
PDF /
jpg
BEN7: TUB-test chart BEN7; 6 Ostwald optimal colours
for 8 illuminants Dxx, CIE-02-degree observer, chromatic value
diagram (CAB2, Y), C=10:1, Y-transfer
Figure BEN8L0N1.jpg: Output in format A6 of the file
BEN8L0NP.PDF, see
BEN8L0N1.
PS /
TXT /
PDF /
jpg
BEN8: TUB-test chart BEN8; 6 Ostwald optimal colours
for 8 illuminants Dxx, CIE-02-degree observer, chromatic value
diagram (CAB2, Y), C=4:1, Y-transfer
Figure BEN9L0N1.jpg: Output in format A6 of the file
BEN9L0NP.PDF, see
BEN9L0N1.
PS /
TXT /
PDF /
jpg
BEN9: TUB-test chart BEN9; 6 Ostwald optimal colours
for 8 illuminants Dxx, CIE-02-degree observer, chromatic value
diagram (CAB2, Y), C=2:1, Y-transfer

Figure BEO0L0N1.jpg: Output in format A6 of the file
BEO0L0NP.PDF, see
BEO0L0N1.
PS /
TXT /
PDF /
jpg
BEO0: TUB-test chart BEO0; 6 Ostwald optimal colours
for 8 illuminants Pxx, CIE-10-degree observer, chromatic value
diagram (CAB2, Y), C>=288:1, -50<=Ya<=50

Figure BEO1L0N1.jpg: Output in format A6 of the file
BEO1L0NP.PDF, see
BEO1L0N1.
PS /
TXT /
PDF /
jpg
BEO1: TUB-test chart BEO1; 6 Ostwald optimal colours
for 8 illuminants Pxx, CIE-10-degree observer, chromatic value
diagram (CAB2, Y), C=25:1, -50<=Ya<=50

Figure BEO2L0N1.jpg: Output in format A6 of the file
BEO2L0NP.PDF, see
BEO2L0N1.
PS /
TXT /
PDF /
jpg
BEO2: TUB-test chart BEO2; 6 Ostwald optimal colours
for 8 illuminants Pxx, CIE-10-degree observer, chromatic value
diagram (CAB2, Y), C=10:1

Figure BEO3L0N1.jpg: Output in format A6 of the file
BEO3L0NP.PDF, see
BEO3L0N1.
PS /
TXT /
PDF /
jpg
BEO3: TUB-test chart BEO3; 6 Ostwald optimal colours
for 8 illuminants Pxx, CIE-10-degree observer, chromatic value
diagram (CAB2, Y), C=4:1, -50<=Ya<=50

Figure BEO4L0N1.jpg: Output in format A6 of the file
BEO4L0NP.PDF, see
BEO4L0N1.
PS /
TXT /
PDF /
jpg
BEO4: TUB-test chart BEO4; 6 Ostwald optimal colours
for 8 illuminants Pxx, CIE-10-degree observer, chromatic value
diagram (CAB2, Y), C=2:1, -50<=Ya<=50
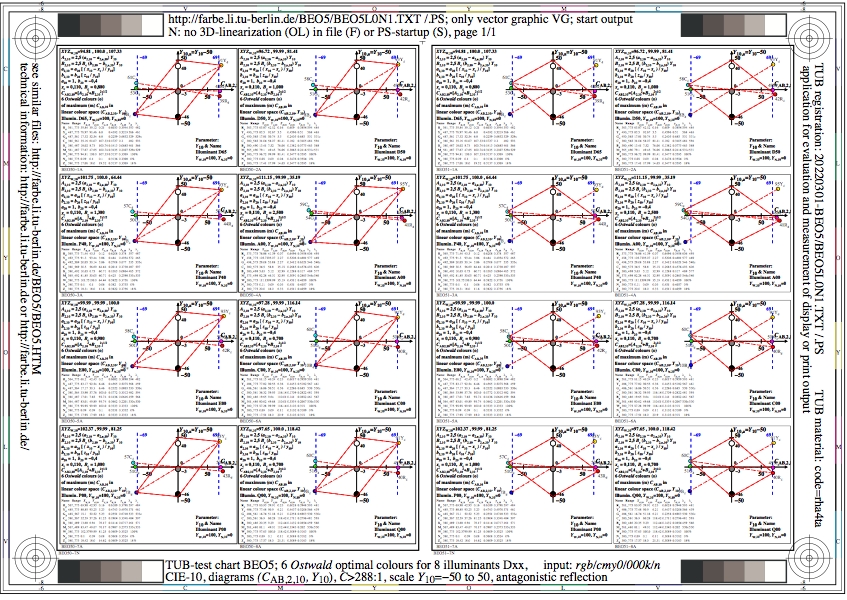
Figure BEO5L0N1.jpg: Output in format A6 of the file
BEO5L0NP.PDF, see
BEO5L0N1.
PS /
TXT /
PDF /
jpg
BEO5: TUB-test chart BEO5; 6 Ostwald optimal colours
for 8 illuminants Dxx, CIE-10-degree observer, chromatic value
diagram (CAB2, Y), C>=288:1, -50<=Ya<=50

Figure BEO6L0N1.jpg: Output in format A6 of the file
BEO6L0NP.PDF, see
BEO6L0N1.
PS /
TXT /
PDF /
jpg
BEO6: TUB-test chart BEO6; 6 Ostwald optimal colours
for 8 illuminants Dxx, CIE-10-degree observer, chromatic value
diagram (CAB2, Y), C=25:1, Y-transfer
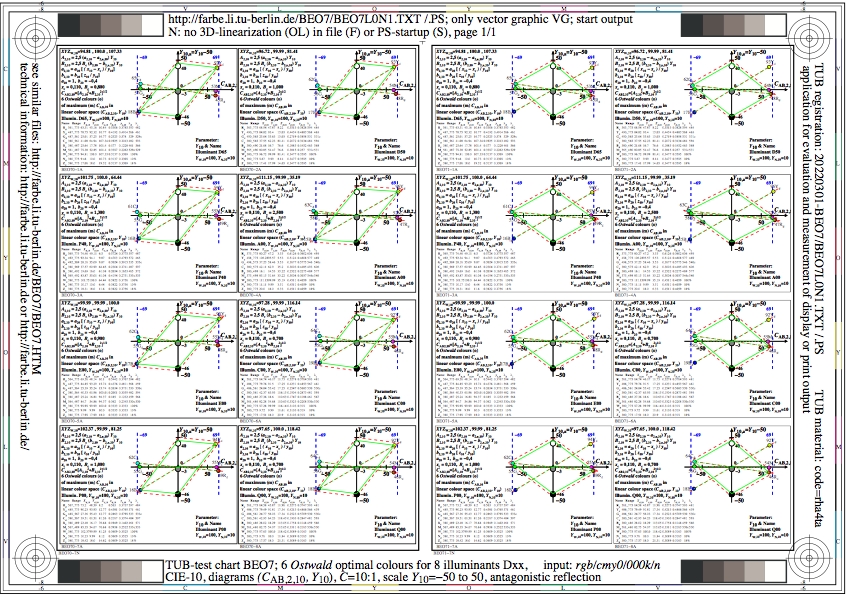
Figure BEO7L0N1.jpg: Output in format A6 of the file
BEO7L0NP.PDF, see
BEO7L0N1.
PS /
TXT /
PDF /
jpg
BEO7: TUB-test chart BEO7; 6 Ostwald optimal colours
for 8 illuminants Dxx, CIE-10-degree observer, chromatic value
diagram (CAB2, Y), C=10:1, Y-transfer

Figure BEO8L0N1.jpg: Output in format A6 of the file
BEO8L0NP.PDF, see
BEO8L0N1.
PS /
TXT /
PDF /
jpg
BEO8: TUB-test chart BEO8; 6 Ostwald optimal colours
for 8 illuminants Dxx, CIE-10-degree observer, chromatic value
diagram (CAB2, Y), C=4:1, Y-transfer
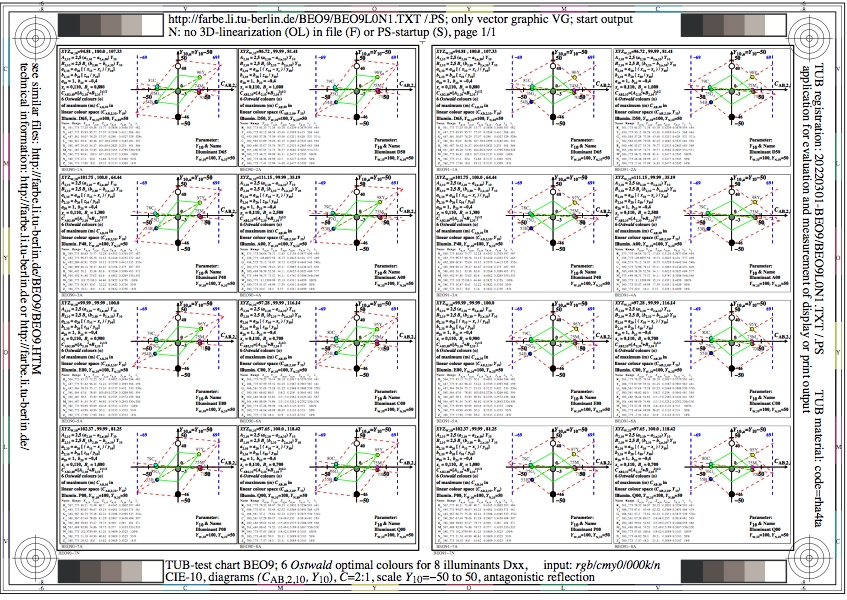
Figure BEO9L0N1.jpg: Output in format A6 of the file
BEO9L0NP.PDF, see
BEO9L0N1.
PS /
TXT /
PDF /
jpg
BEO9: TUB-test chart BEO9; 6 Ostwald optimal colours
for 8 illuminants Dxx, CIE-10-degree observer, chromatic value
diagram (CAB2, Y), C=2:1, Y-transfer

Figure BEP0L0N1.jpg: Output in format A6 of the file
BEP0L0NP.PDF, see
BEP0L0N1.
PS /
TXT /
PDF /
jpg
BEP0: TUB-test chart BEQ0; 6 Ostwald optimal colours
for 8 illuminants Pxx, CIE-10-degree observer, diagram
(CAB2, Y), C>=288:1, -1<=Yan<=1
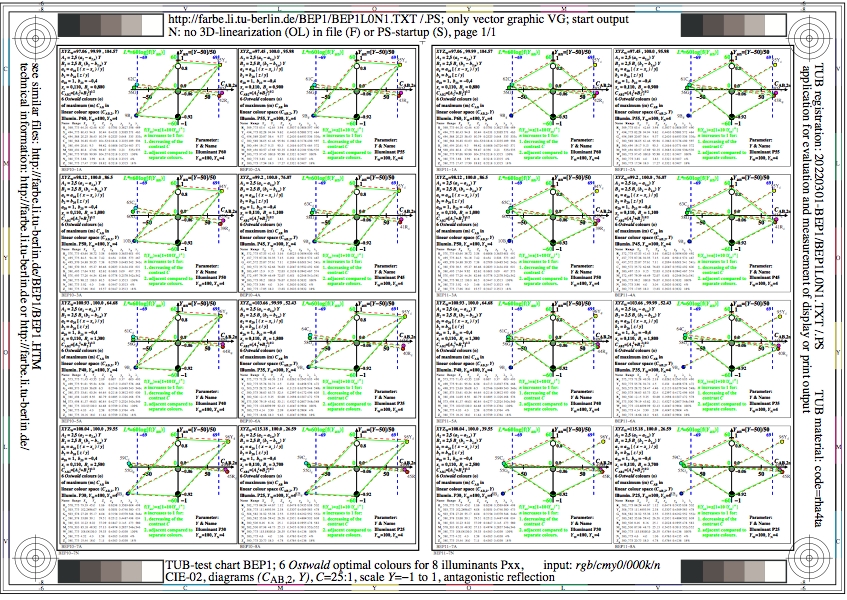
Figure BEP1L0N1.jpg: Output in format A6 of the file
BEP1L0NP.PDF, see
BEP1L0N1.
PS /
TXT /
PDF /
jpg
BEP1: TUB-test chart BEQ1; 6 Ostwald optimal colours
for 8 illuminants Pxx, CIE-10-degree observer, diagram
(CAB2, Y), C=25:1, -1<=Yan<=1
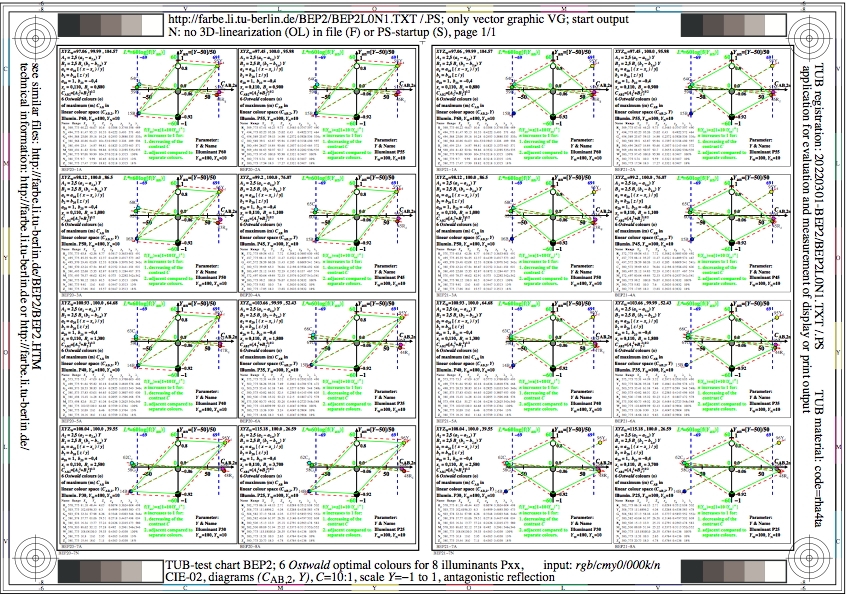
Figure BEP2L0N1.jpg: Output in format A6 of the file
BEP2L0NP.PDF, see
BEP2L0N1.
PS /
TXT /
PDF /
jpg
BEP2: TUB-test chart BEQ2; 6 Ostwald optimal colours
for 8 illuminants Pxx, CIE-10-degree observer, diagram
(CAB2, Y), C=10:1, -1<=Yan<=1
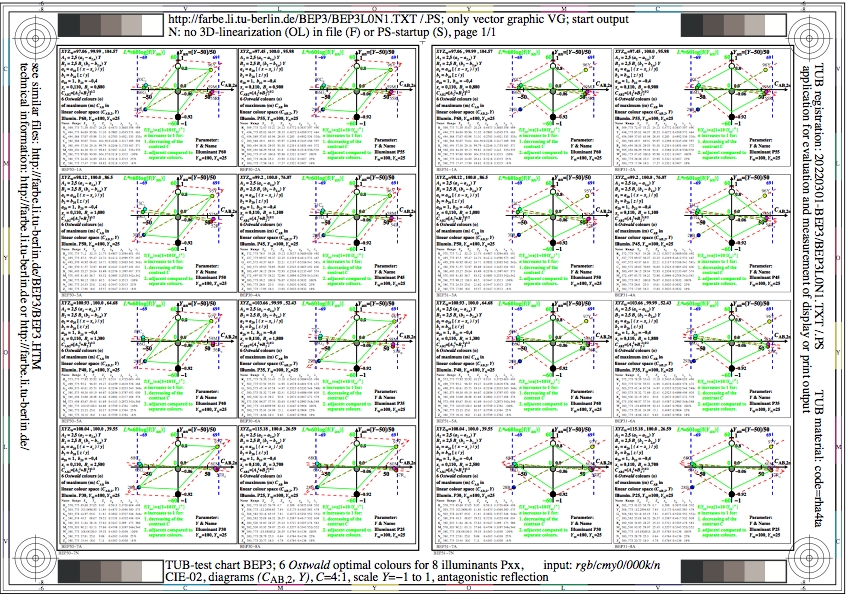
Figure BEP3L0N1.jpg: Output in format A6 of the file
BEP3L0NP.PDF, see
BEP3L0N1.
PS /
TXT /
PDF /
jpg
BEP3: TUB-test chart BEQ3; 6 Ostwald optimal colours
for 8 illuminants Pxx, CIE-10-degree observer, chromatic value
diagram (CAB2, Y), C=4:1, -1<=Yan<=1

Figure BEP4L0N1.jpg: Output in format A6 of the file
BEP4L0NP.PDF, see
BEP4L0N1.
PS /
TXT /
PDF /
jpg
BEP4: TUB-test chart BEQ4; 6 Ostwald optimal colours
for 8 illuminants Pxx, CIE-10-degree observer, chromatic value
diagram (CAB2, Y), C=2:1, -1<=Yan<=1
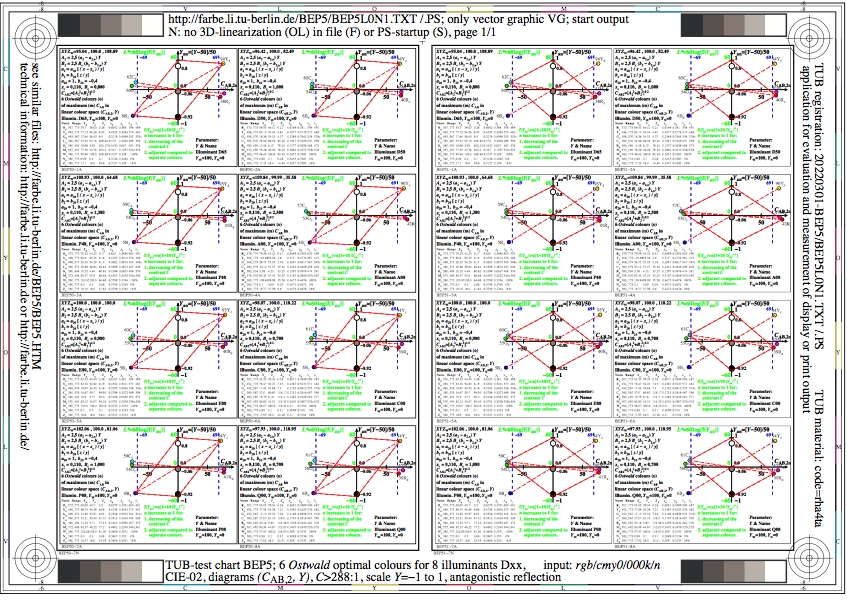
Figure BEP5L0N1.jpg: Output in format A6 of the file
BEP5L0NP.PDF, see
BEP5L0N1.
PS /
TXT /
PDF /
jpg
BEP5: TUB-test chart BEQ5; 6 Ostwald optimal colours
for 8 illuminants Dxx, CIE-10-degree observer, diagram
(CAB2, Y), C>=288:1, -1<=Yan<=1
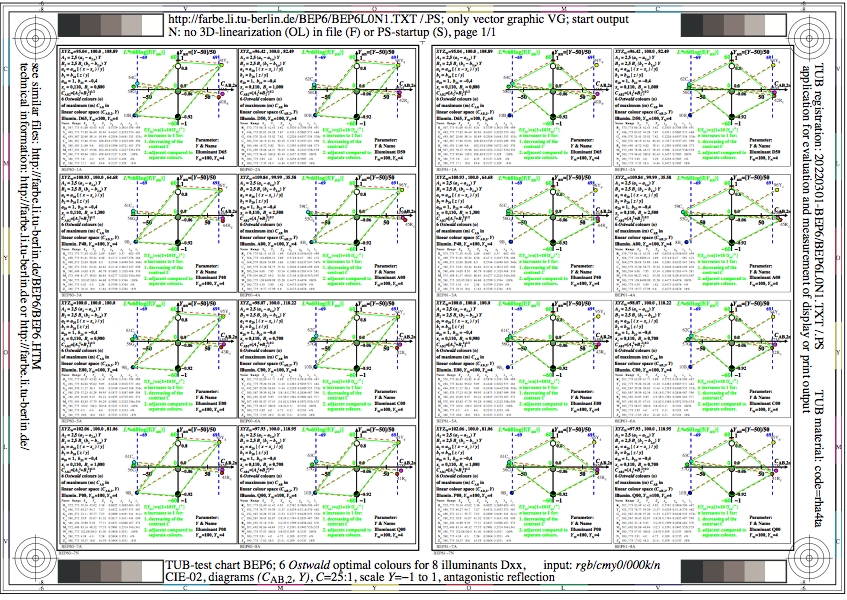
Figure BEP6L0N1.jpg: Output in format A6 of the file
BEP6L0NP.PDF, see
BEP6L0N1.
PS /
TXT /
PDF /
jpg
BEP6: TUB-test chart BEQ6; 6 Ostwald optimal colours
for 8 illuminants Dxx, CIE-10-degree observer, chromatic value
diagram (CAB2, Y), C=25:1, Y-transfer
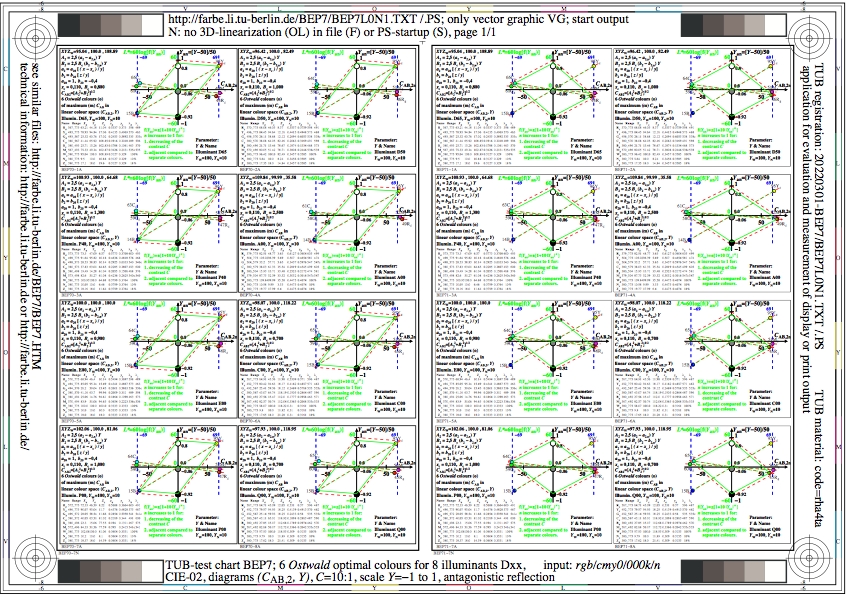
Figure BEP7L0N1.jpg: Output in format A6 of the file
BEP7L0NP.PDF, see
BEP7L0N1.
PS /
TXT /
PDF /
jpg
BEP7: TUB-test chart BEQ7; 6 Ostwald optimal colours
for 8 illuminants Dxx, CIE-10-degree observer, chromatic value
diagram (CAB2, Y), C=10:1, Y-transfer
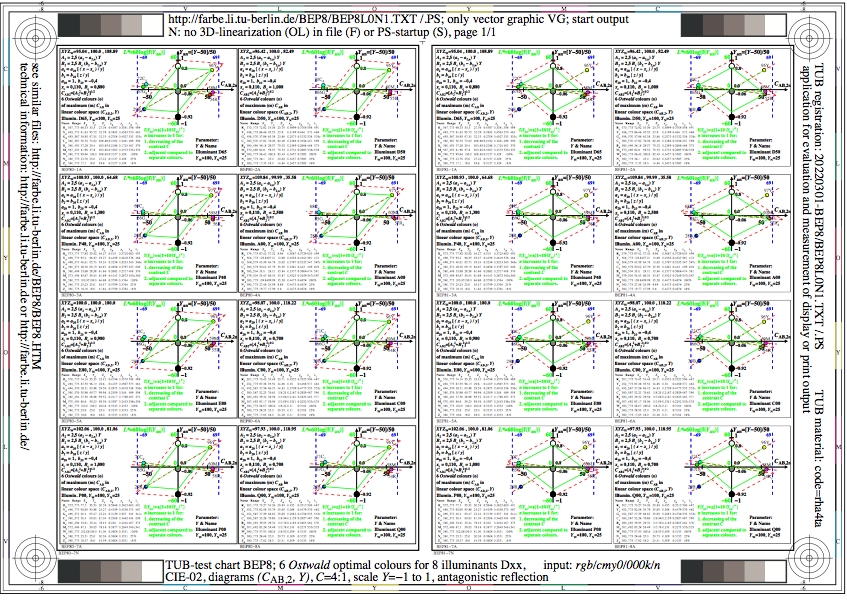
Figure BEP8L0N1.jpg: Output in format A6 of the file
BEP8L0NP.PDF, see
BEP8L0N1.
PS /
TXT /
PDF /
jpg
BEP8: TUB-test chart BEQ8; 6 Ostwald optimal colours
for 8 illuminants Dxx, CIE-10-degree observer, chromatic value
diagram (CAB2, Y), C=4:1, Y-transfer
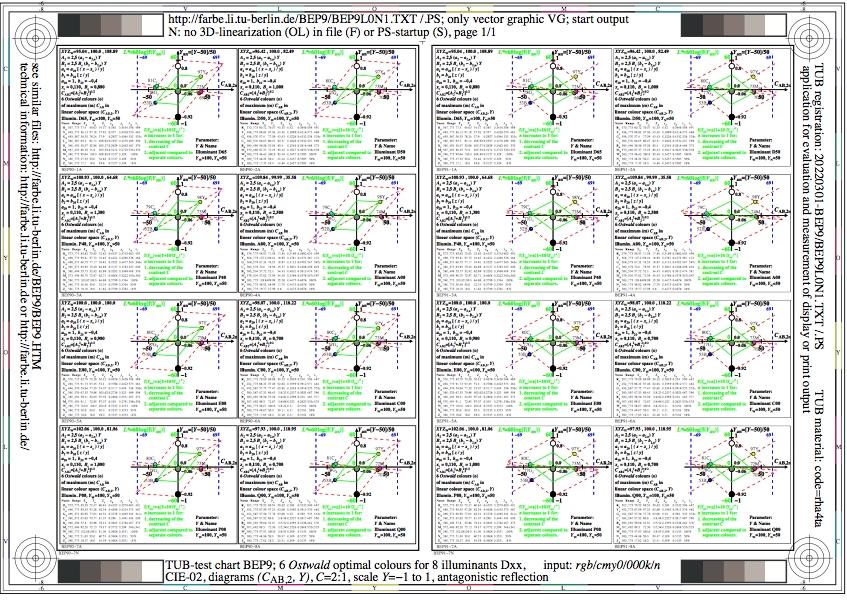
Figure BEP9L0N1.jpg: Output in format A6 of the file
BEP9L0NP.PDF, see
BEP9L0N1.
PS /
TXT /
PDF /
jpg
BEP9: TUB-test chart BEQ9; 6 Ostwald optimal colours
for 8 illuminants Dxx, CIE-10-degree observer, chromatic value
diagram (CAB2, Y), C=2:1, Y-transfer
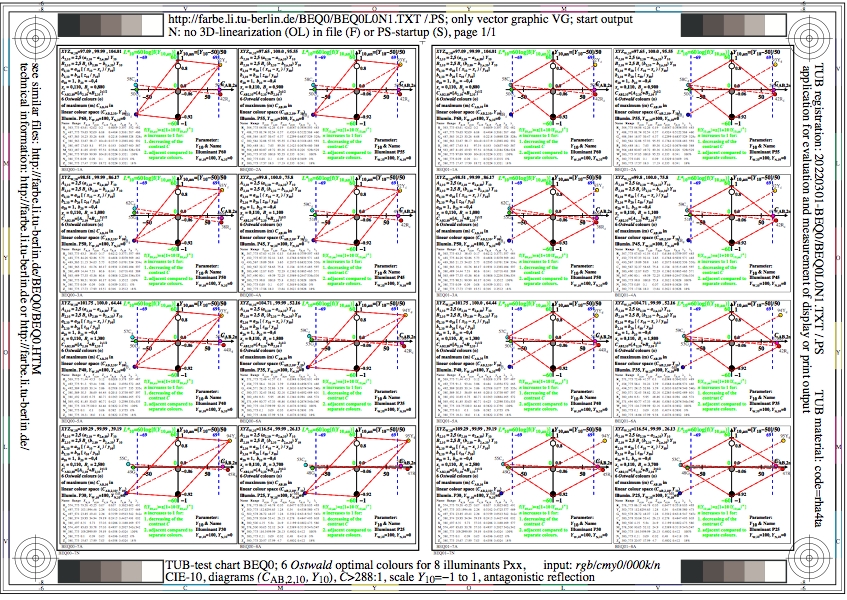
Figure BEQ0L0N1.jpg: Output in format A6 of the file
BEQ0L0NP.PDF, see
BEQ0L0N1.
PS /
TXT /
PDF /
jpg
BEQ0: TUB-test chart BEQ0; 6 Ostwald optimal colours
for 8 illuminants Pxx, CIE-10-degree observer, diagram
(CAB2, Y), C>=288:1, -1<=Yan<=1
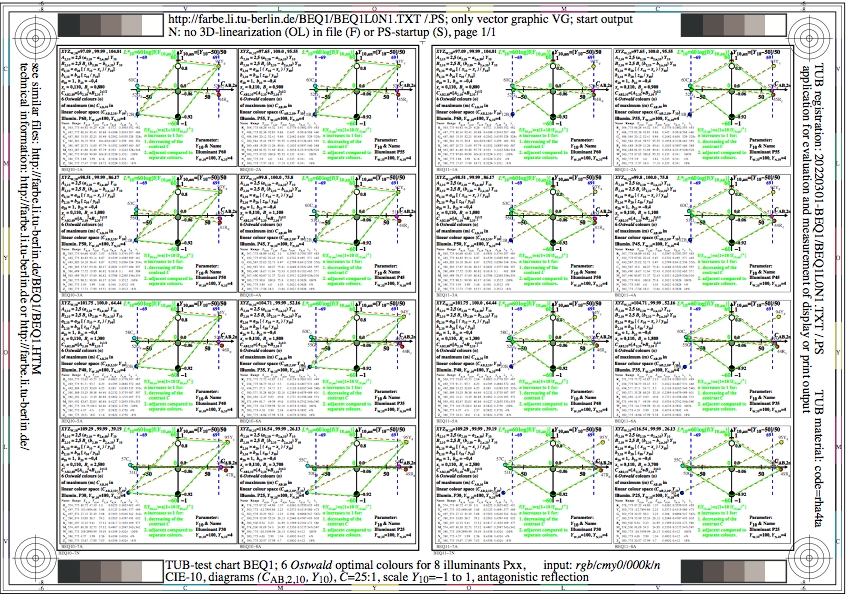
Figure BEQ1L0N1.jpg: Output in format A6 of the file
BEQ1L0NP.PDF, see
BEQ1L0N1.
PS /
TXT /
PDF /
jpg
BEQ1: TUB-test chart BEQ1; 6 Ostwald optimal colours
for 8 illuminants Pxx, CIE-10-degree observer, diagram
(CAB2, Y), C=25:1, -1<=Yan<=1

Figure BEQ2L0N1.jpg: Output in format A6 of the file
BEQ2L0NP.PDF, see
BEQ2L0N1.
PS /
TXT /
PDF /
jpg
BEQ2: TUB-test chart BEQ2; 6 Ostwald optimal colours
for 8 illuminants Pxx, CIE-10-degree observer, diagram
(CAB2, Y), C=10:1, -1<=Yan<=1
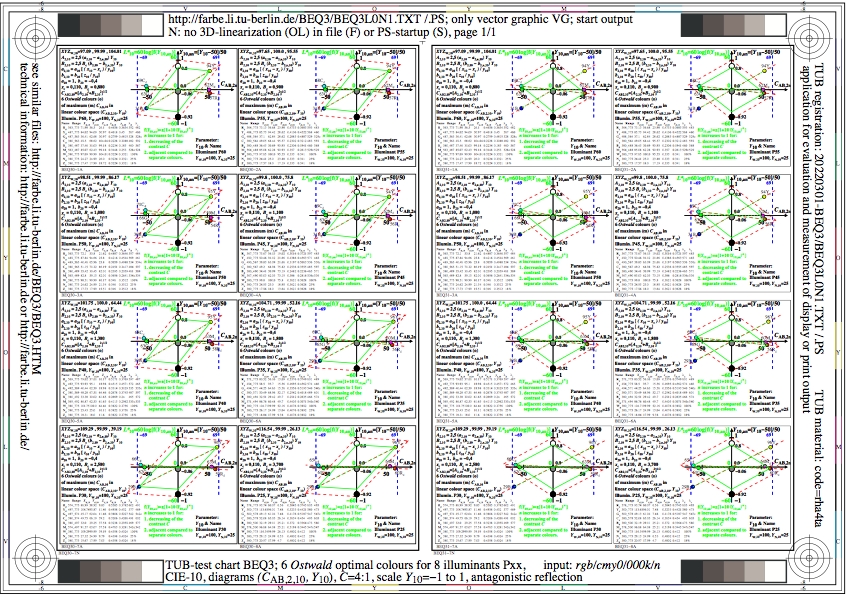
Figure BEQ3L0N1.jpg: Output in format A6 of the file
BEQ3L0NP.PDF, see
BEQ3L0N1.
PS /
TXT /
PDF /
jpg
BEQ3: TUB-test chart BEQ3; 6 Ostwald optimal colours
for 8 illuminants Pxx, CIE-10-degree observer, chromatic value
diagram (CAB2, Y), C=4:1, -1<=Yan<=1

Figure BEQ4L0N1.jpg: Output in format A6 of the file
BEQ4L0NP.PDF, see
BEQ4L0N1.
PS /
TXT /
PDF /
jpg
BEQ4: TUB-test chart BEQ4; 6 Ostwald optimal colours
for 8 illuminants Pxx, CIE-10-degree observer, chromatic value
diagram (CAB2, Y), C=2:1, -1<=Yan<=1
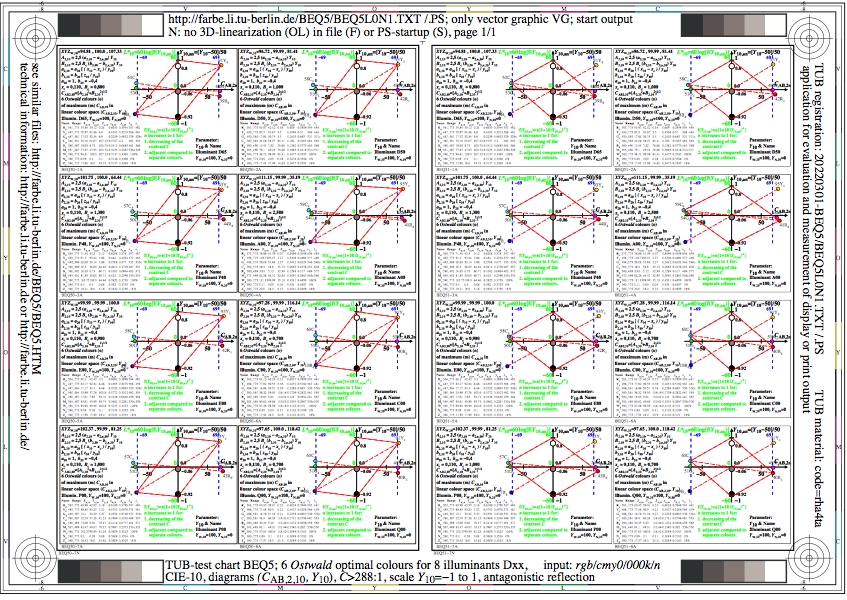
Figure BEQ5L0N1.jpg: Output in format A6 of the file
BEQ5L0NP.PDF, see
BEQ5L0N1.
PS /
TXT /
PDF /
jpg
BEQ5: TUB-test chart BEQ5; 6 Ostwald optimal colours
for 8 illuminants Dxx, CIE-10-degree observer, diagram
(CAB2, Y), C>=288:1, -1<=Yan<=1
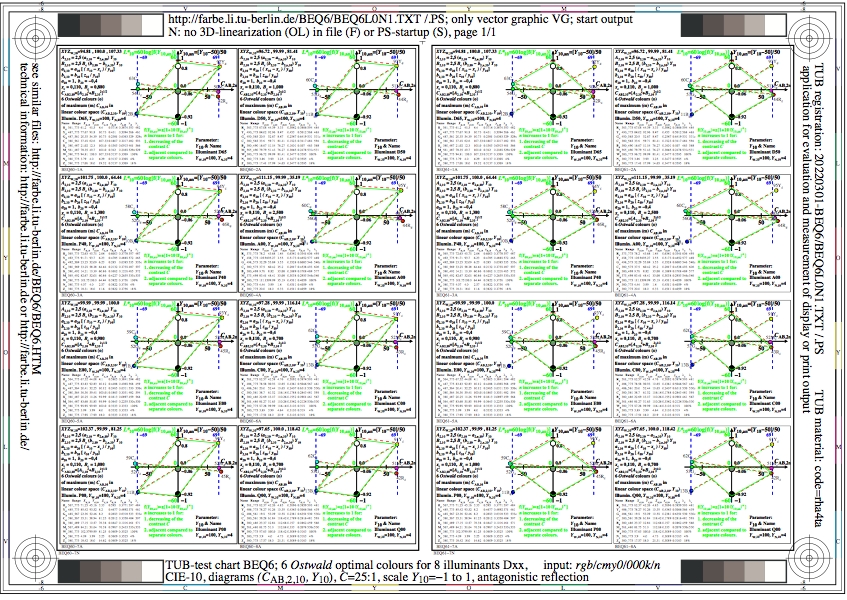
Figure BEQ6L0N1.jpg: Output in format A6 of the file
BEQ6L0NP.PDF, see
BEQ6L0N1.
PS /
TXT /
PDF /
jpg
BEQ6: TUB-test chart BEQ6; 6 Ostwald optimal colours
for 8 illuminants Dxx, CIE-10-degree observer, chromatic value
diagram (CAB2, Y), C=25:1, Y-transfer

Figure BEQ7L0N1.jpg: Output in format A6 of the file
BEQ7L0NP.PDF, see
BEQ7L0N1.
PS /
TXT /
PDF /
jpg
BEQ7: TUB-test chart BEQ7; 6 Ostwald optimal colours
for 8 illuminants Dxx, CIE-10-degree observer, chromatic value
diagram (CAB2, Y), C=10:1, Y-transfer
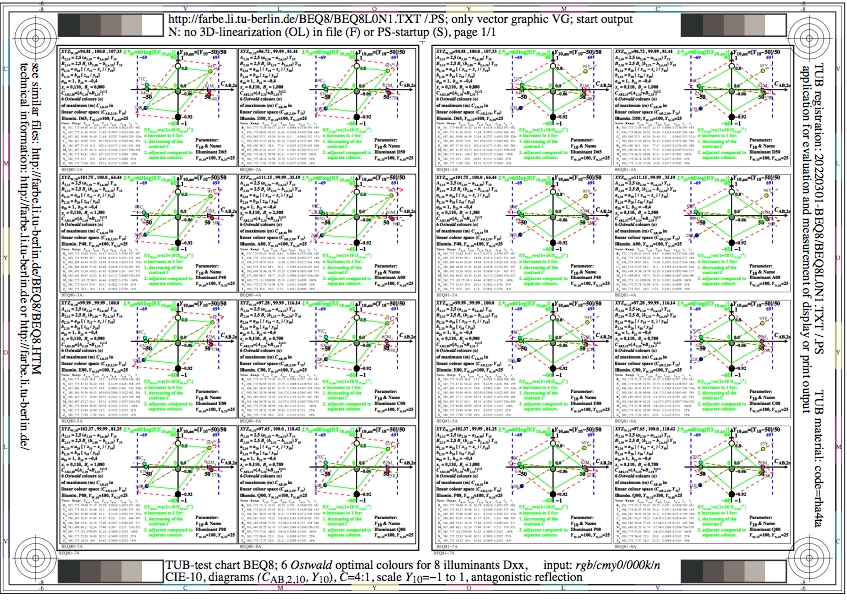
Figure BEQ8L0N1.jpg: Output in format A6 of the file
BEQ8L0NP.PDF, see
BEQ8L0N1.
PS /
TXT /
PDF /
jpg
BEQ8: TUB-test chart BEQ8; 6 Ostwald optimal colours
for 8 illuminants Dxx, CIE-10-degree observer, chromatic value
diagram (CAB2, Y), C=4:1, Y-transfer
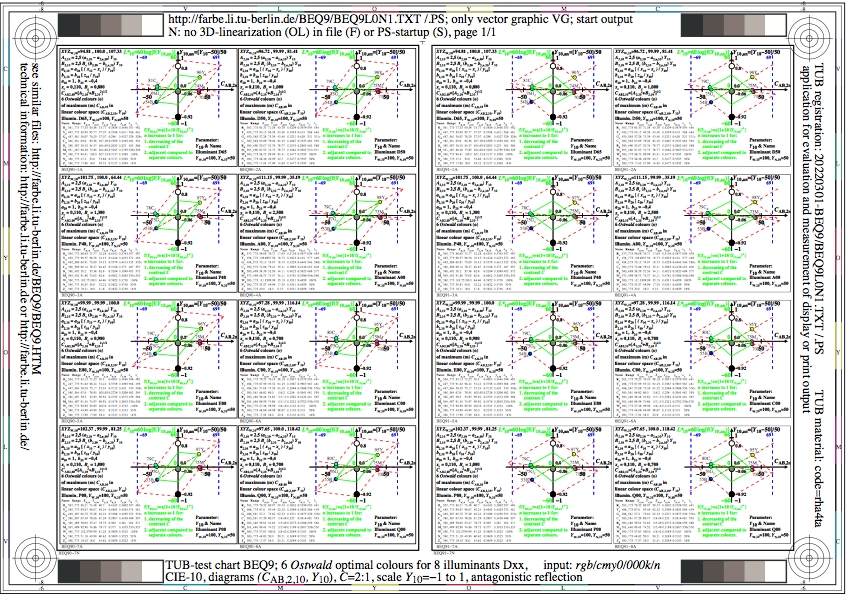
Figure BEQ9L0N1.jpg: Output in format A6 of the file
BEQ9L0NP.PDF, see
BEQ9L0N1.
PS /
TXT /
PDF /
jpg
BEQ9: TUB-test chart BEQ9; 6 Ostwald optimal colours
for 8 illuminants Dxx, CIE-10-degree observer, chromatic value
diagram (CAB2, Y), C=2:1, Y-transfer
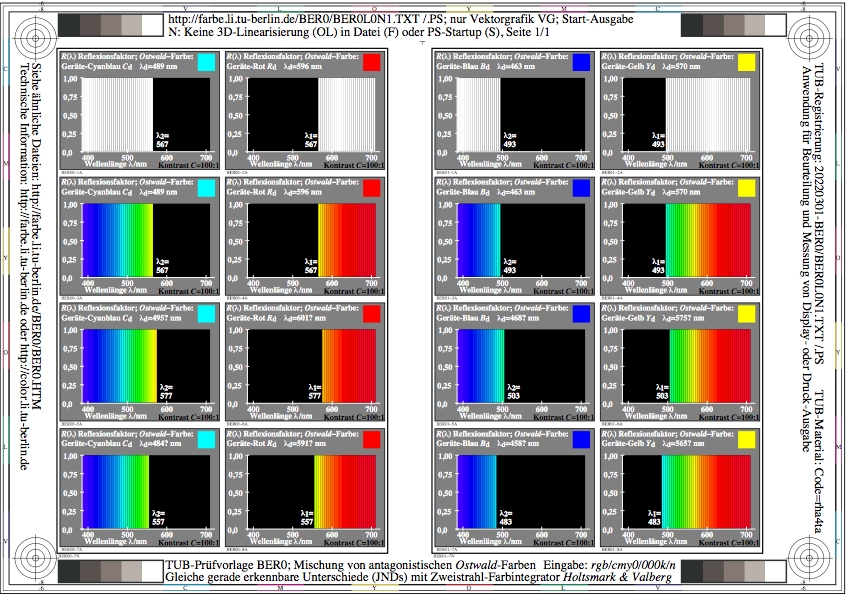
Figure BER0L0N1.jpg: Output in format A6 of the file
BER0L0NP.PDF, see
BER0L0N1.
PS /
TXT /
PDF /
jpg
BER0: TUB-test chart BER0; Mixture to Ostwald colours
Equal just noticeable colour differences (JNDs) for
C-R and B-Y with double beam colour integrator
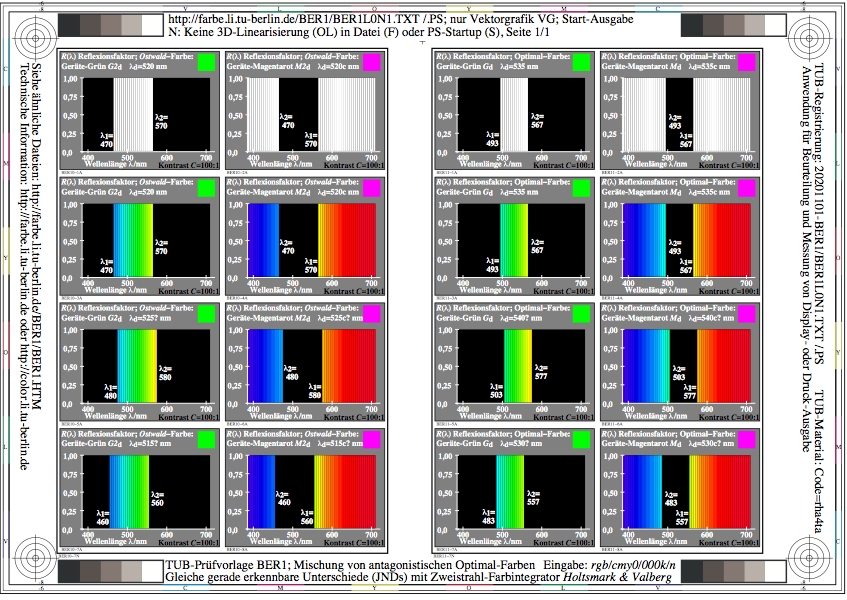
Figure BER1L0N1.jpg: Output in format A6 of the file
BER1L0NP.PDF, see
BER1L0N1.
PS /
TXT /
PDF /
jpg
BER1: TUB-test chart BER1; Mixture to optimal colours
Equal just noticeable colour differences (JNDs) for
G-M and G2-M2 with double beam colour integrator
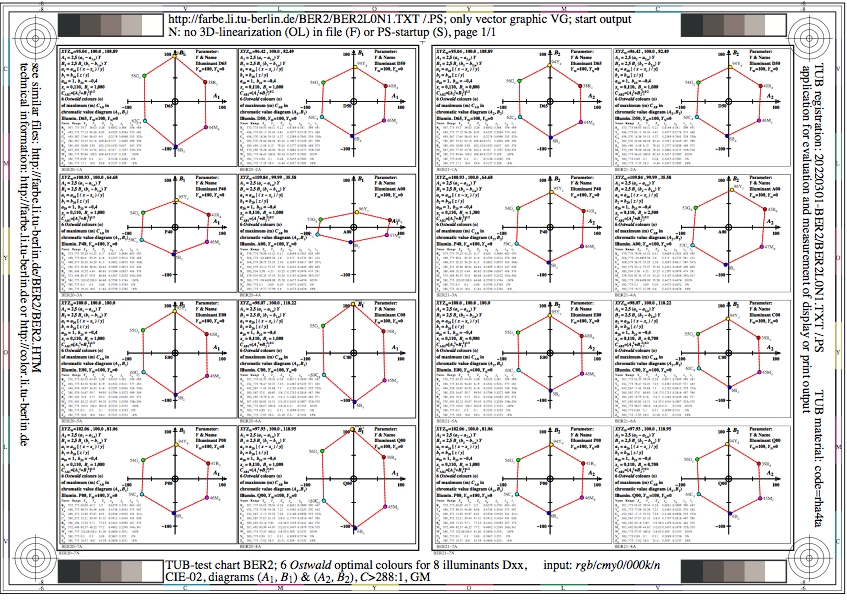
Figure BER2L0N1.jpg: Output in format A6 of the file
BER2L0NP.PDF, see
BER2L0N1.
PS /
TXT /
PDF /
jpg
BER2: TUB-test chart BER2; 6 Ostwald optimal colours, GM
for 8 illuminants Dxx, CIE-02-degree observer, chromatic value
diagrams (CAB1, CAB2), contrast C>=288:1
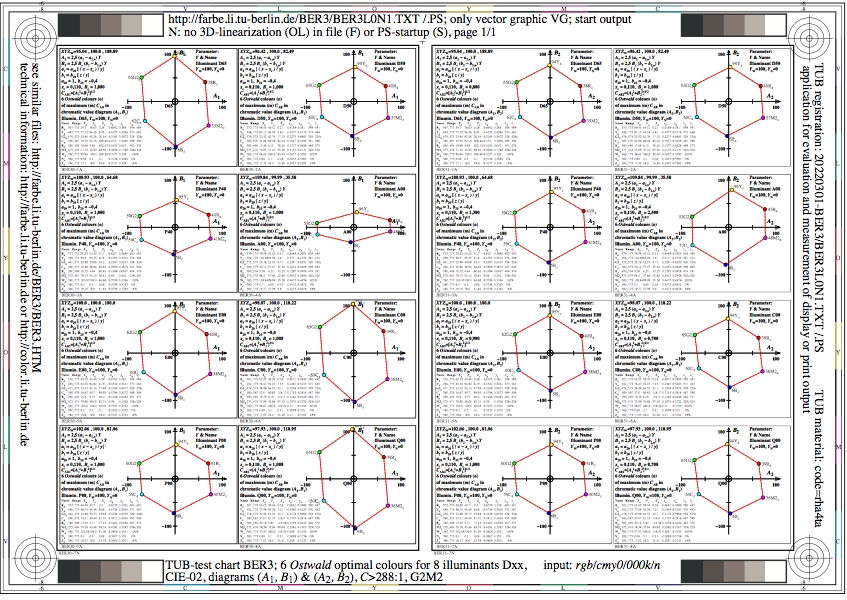
Figure BER3L0N1.jpg: Output in format A6 of the file
BER3L0NP.PDF, see
BER3L0N1.
PS /
TXT /
PDF /
jpg
BER3: TUB-test chart BER3; 6 Ostwald optimal colours, GM2
for 8 illuminants Dxx, CIE-02-degree observer, chromatic value
diagrams (CAB1, CAB2), contrast C>=288:1
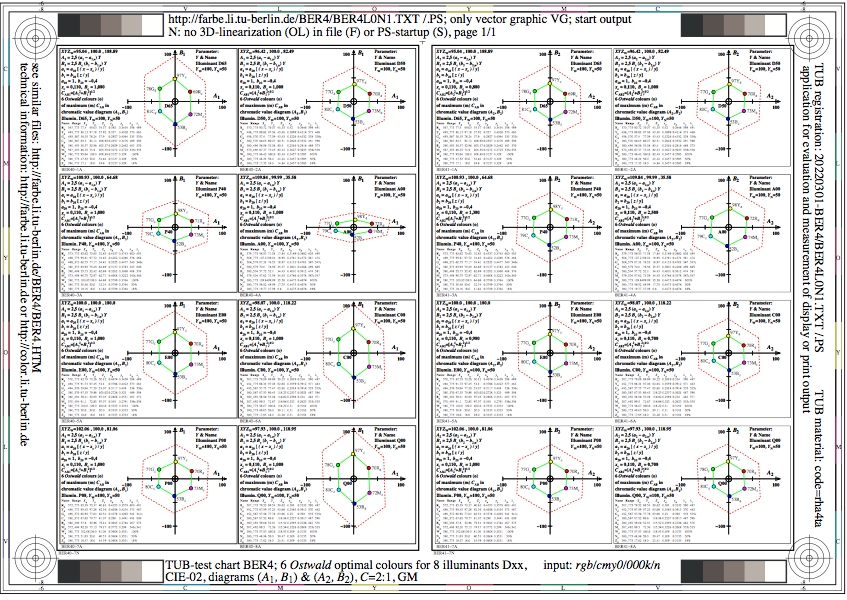
Figure BER4L0N1.jpg: Output in format A6 of the file
BER4L0NP.PDF, see
BER4L0N1.
PS /
TXT /
PDF /
jpg
BER4: TUB-test chart BER4; 6 Ostwald optimal colours, GM
for 8 illuminants Dxx, CIE-02-degree observer, chromatic value
diagrams (CAB1, CAB2), contrast C=2:1
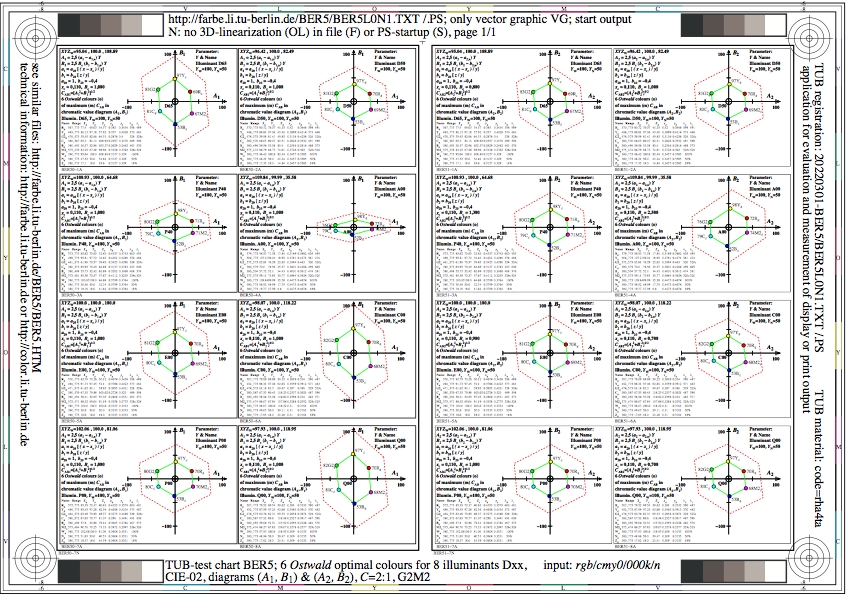
Figure BER5L0N1.jpg: Output in format A6 of the file
BER5L0NP.PDF, see
BER5L0N1.
PS /
TXT /
PDF /
jpg
BER5: TUB-test chart BER5; 6 Ostwald optimal colours, GM2
for 8 illuminants Dxx, CIE-02-degree observer, chromatic value
diagrams (CAB1, CAB2), contrast C=2:1
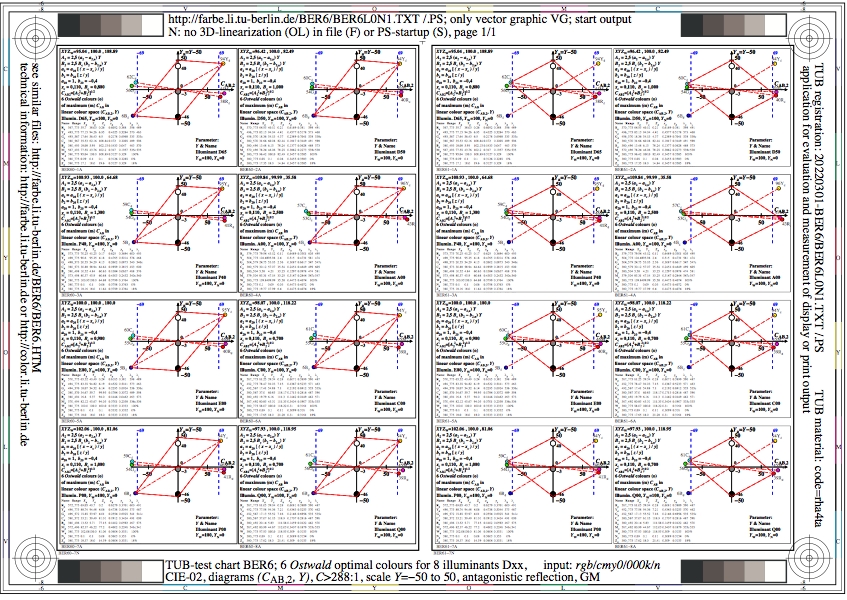
Figure BER6L0N1.jpg: Output in format A6 of the file
BER6L0NP.PDF, see
BER6L0N1.
PS /
TXT /
PDF /
jpg
BER6: TUB-test chart BER6; 6 Ostwald optimal colours, GM
for 8 illuminants Dxx, CIE-02-degree observer, diagram
(CAB2, Y), C>=288:1, -50<=Ya<=50
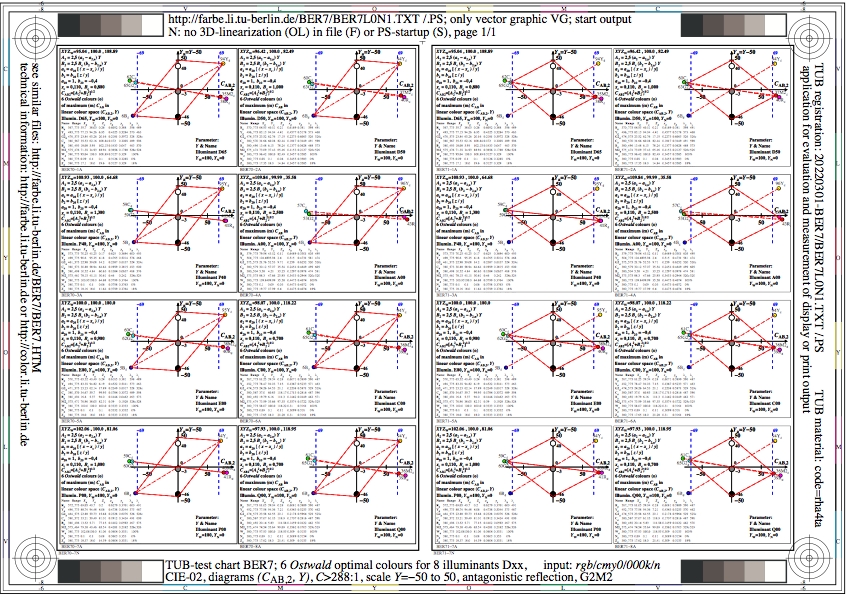
Figure BER7L0N1.jpg: Output in format A6 of the file
BER7L0NP.PDF, see
BER7L0N1.
PS /
TXT /
PDF /
jpg
BER7: TUB-test chart BER7; 6 Ostwald optimal colours, GM2
for 8 illuminants Dxx, CIE-02-degree observer, diagram
(CAB2, Y), C>=288:1, -50<=Ya<=50
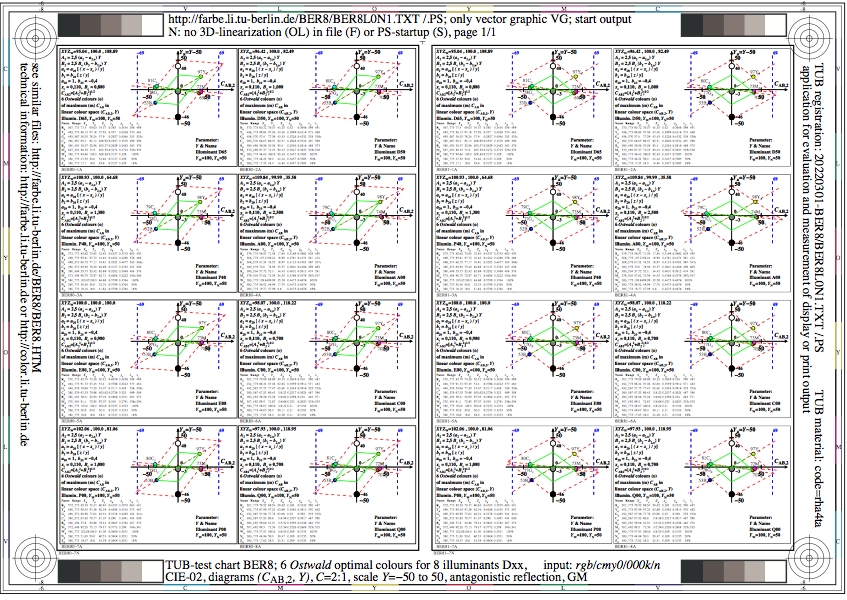
Figure BER8L0N1.jpg: Output in format A6 of the file
BER8L0NP.PDF, see
BER8L0N1.
PS /
TXT /
PDF /
jpg
BER8: TUB-test chart BER8; 6 Ostwald optimal colours, GM
for 8 illuminants Dxx, CIE-02-degree observer, diagram
(CAB2, Y), C=2:1, -50<=Ya<=50
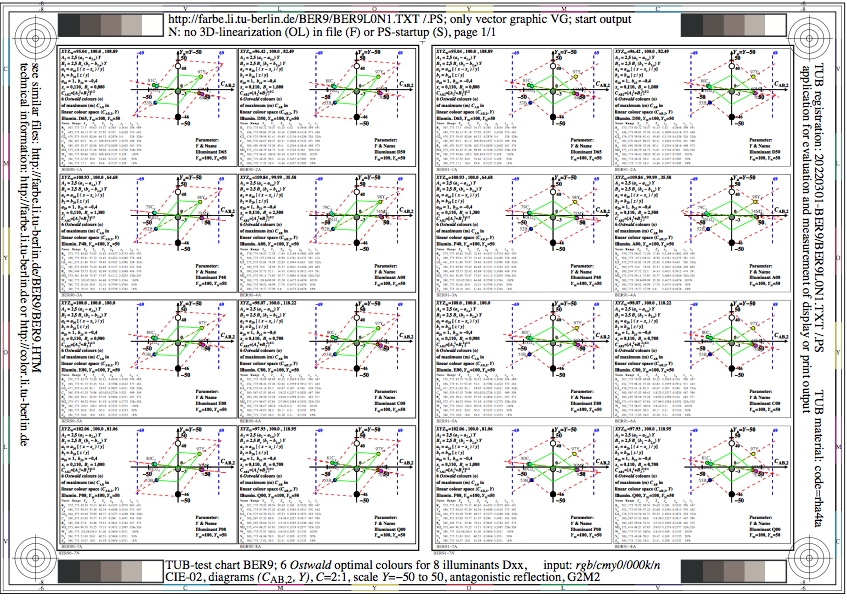
Figure BER9L0N1.jpg: Output in format A6 of the file
BER9L0NP.PDF, see
BER9L0N1.
PS /
TXT /
PDF /
jpg
BER9: TUB-test chart BER9; 6 Ostwald optimal colours, GM2
for 8 illuminants Dxx, CIE-02-degree observer, diagram
(CAB2, Y), C=2:1, -50<=Ya<=50
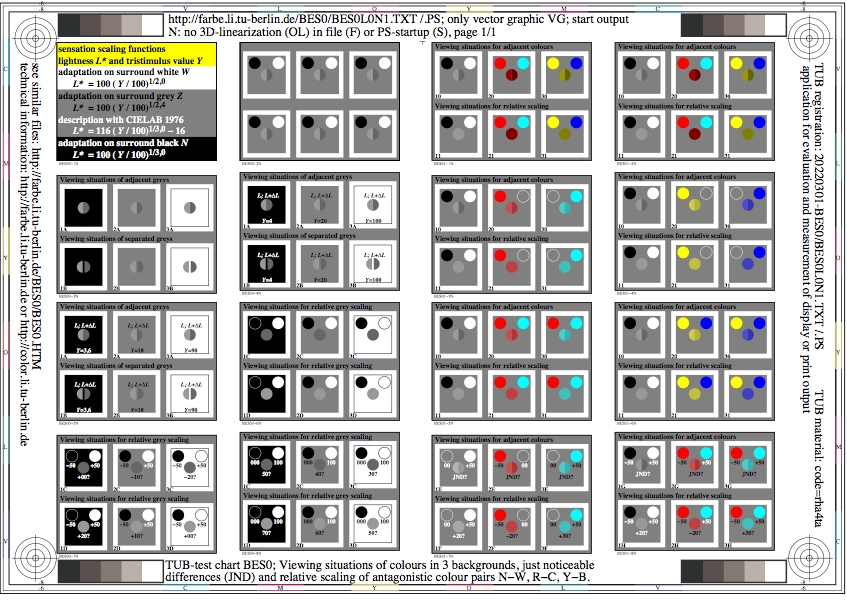
Figure BES0L0N1.jpg: Output in format A6 of the file
BES0L0NP.PDF, see
BES0L0N1.
PS /
TXT /
PDF /
jpg
BES0: TUB-test chart BES0; Viewing situations of colous
Just noticeable differences (JNDs) for greys and colours
Achromatic and chromatic relative scaling
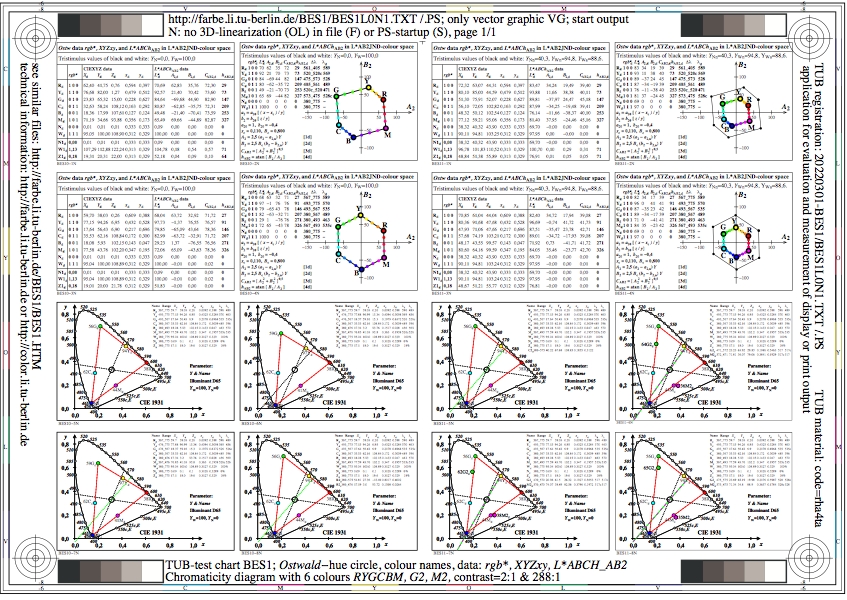
Figure BES1L0N1.jpg: Output in format A6 of the file
BES1L0NP.PDF, see
BES1L0N1.
PS /
TXT /
PDF /
jpg
BES1: TUB-test chart BES1; Ostwald-hue circle
colour names, rgb*, XYZxy, L*ABCH_AB2 data as tables
chromaticity diagram with 6 colours RYGCBM, variation GM->G2M2
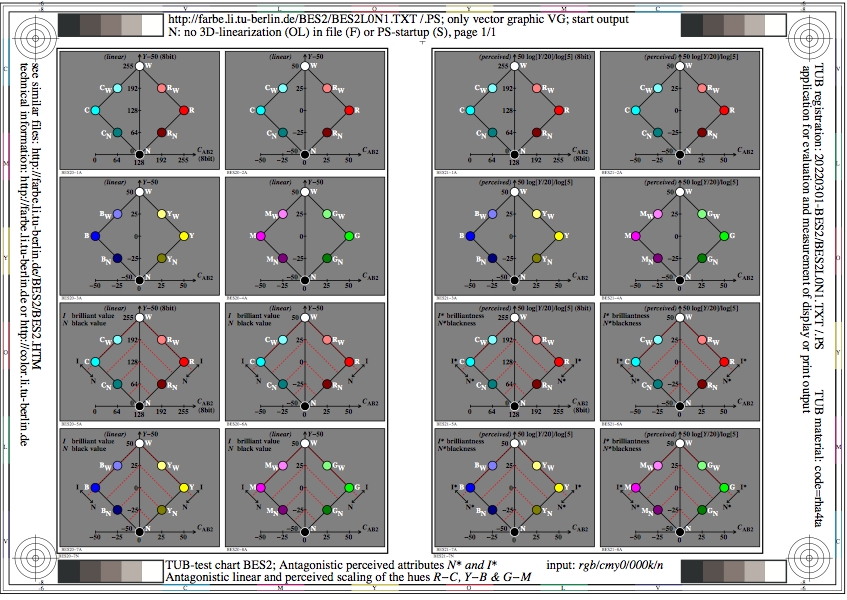
Figure BES2L0N1.jpg: Output in format A6 of the file
BES2L0NP.PDF, see
BES2L0N1.
PS /
TXT /
PDF /
jpg
BES2: TUB-test chart BES1; Antagonistic colour attributes
N* and I*; Antagonistic colour signals
linear and perceived scaling of the hues R-C, Y-B & G-M
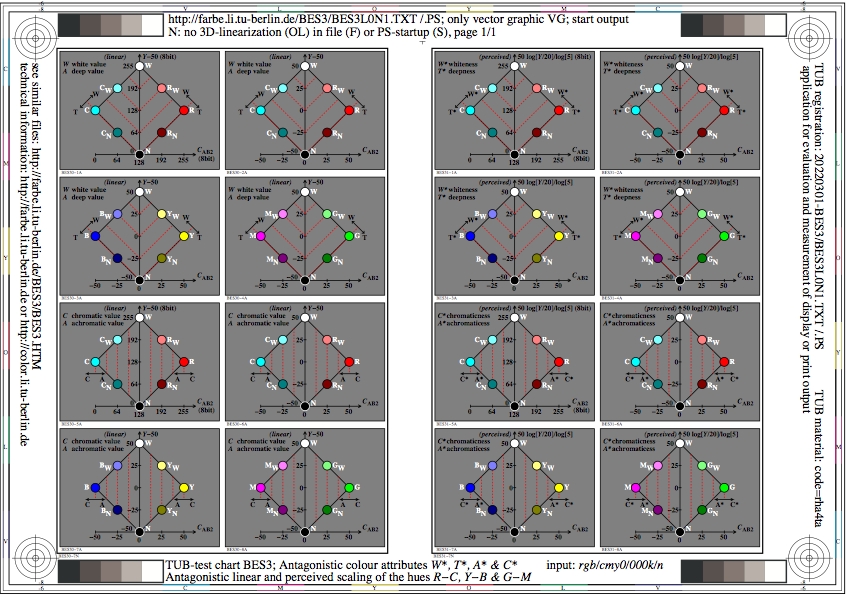
Figure BES3L0N1.jpg: Output in format A6 of the file
BES3L0NP.PDF, see
BES3L0N1.
PS /
TXT /
PDF /
jpg
BES3: TUB-test chart BES3; Antagonistic colour attributes
W*, T*, C* and A*; Antagonistic colour signals
linear and perceived scaling of the hues R-C, Y-B & G-M
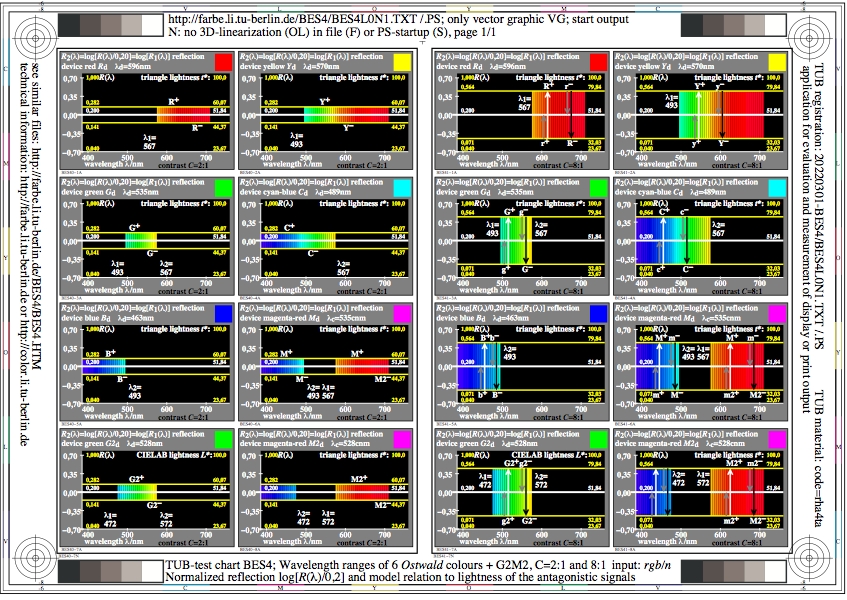
Figure BES4L0N1.jpg: Output in format A6 of the file
BES4L0NP.PDF, see
BES4L0N1.
PS /
TXT /
PDF /
jpg
BES4: TUB-test chart BES4; Wavelength ranges 6 Ostwald
colours + G2M2; Normalized refl;ection log[R(lamda)/0,2]
Model relation to lightness and antagonistic signals
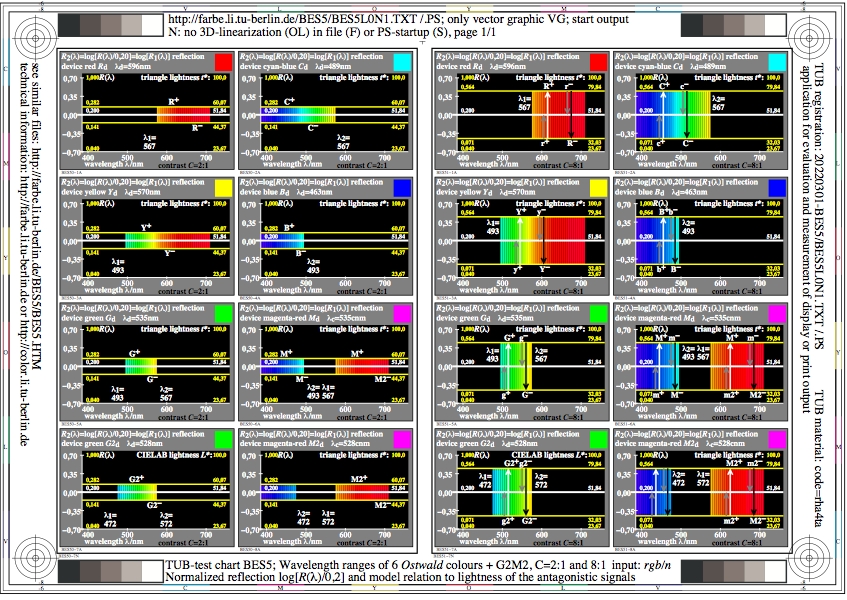
Figure BES5L0N1.jpg: Output in format A6 of the file
BES5L0NP.PDF, see
BES5L0N1.
PS /
TXT /
PDF /
jpg
BES5: TUB-test chart BES5; Wavelength ranges 6 Ostwald
colours + G2M2; Normalized refl;ection log[R(lamda)/0,2]
Model relation to lightness and antagonistic signals
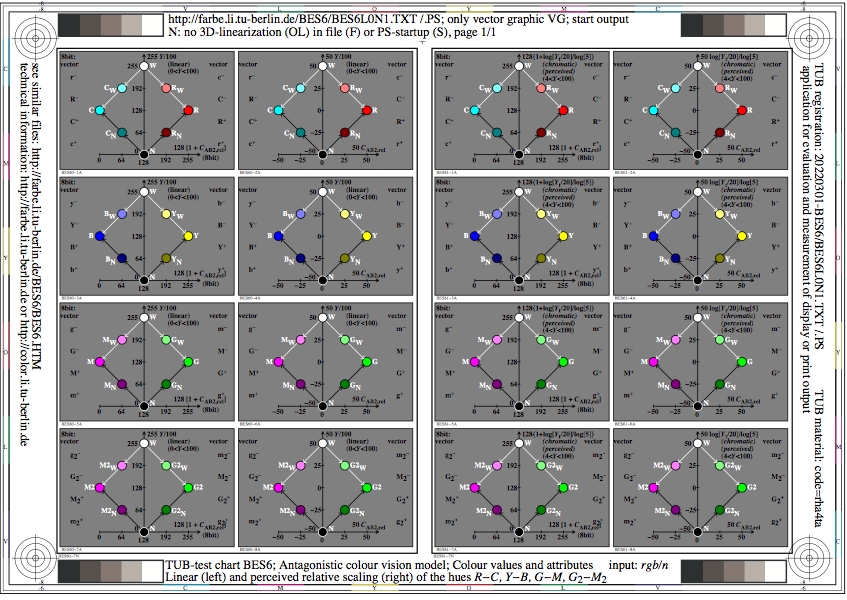
Figure BES6L0N1.jpg: Output in format A6 of the file
BES6L0NP.PDF, see
BES6L0N1.
PS /
TXT /
PDF /
jpg
BES6: TUB-test chart BES6; Antagonistic colour vectors
Linear (left) and perceived relative scaling (right)
of hues R-C, Y-B, G-M, and G2-M2
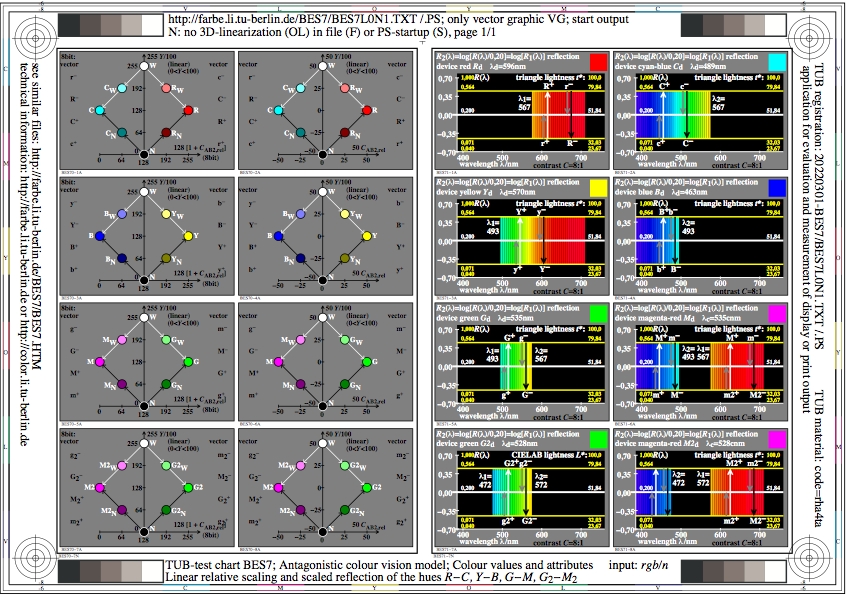
Figure BES7L0N1.jpg: Output in format A6 of the file
BES7L0NP.PDF, see
BES7L0N1.
PS /
TXT /
PDF /
jpg
BES7: TUB-test chart BES7; Linear colour values and reflection
Linear relative scaling and scaled reflection
of hues R-C, Y-B, G-M, and G2-M2

Figure BES8L0N1.jpg: Output in format A6 of the file
BES8L0NP.PDF, see
BES8L0N1.
PS /
TXT /
PDF /
jpg
BES8: TUB-test chart BES8; Perceived colour values and reflection
Perceived relative scaling and scaled reflection
of hues R-C, Y-B, G-M, and G2-M2
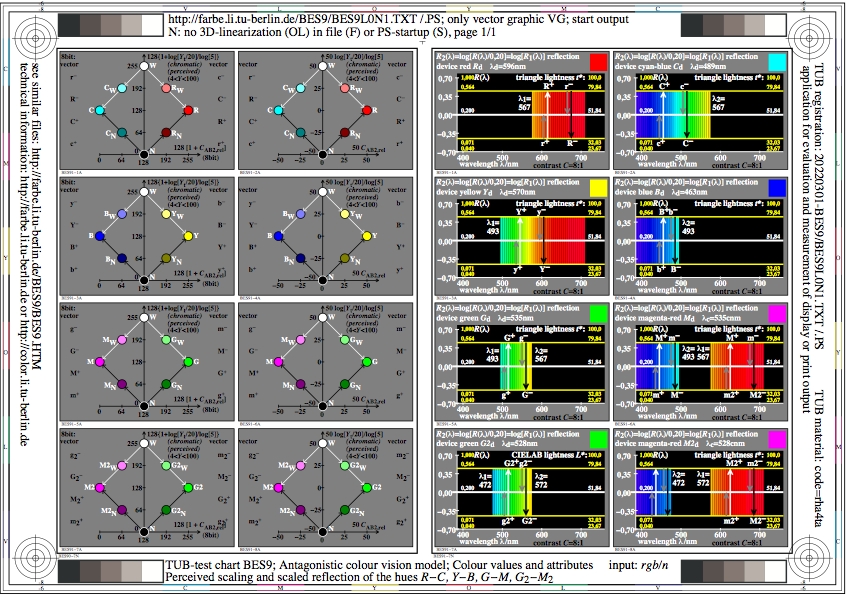
Figure BES9L0N1.jpg: Output in format A6 of the file
BES9L0NP.PDF, see
BES9L0N1.
PS /
TXT /
PDF /
jpg
BES9: TUB-test chart BES9; Perceived colour values and reflection
Perceived relative scaling and scaled reflection
of hues R-C, Y-B, G-M, and G2-M2
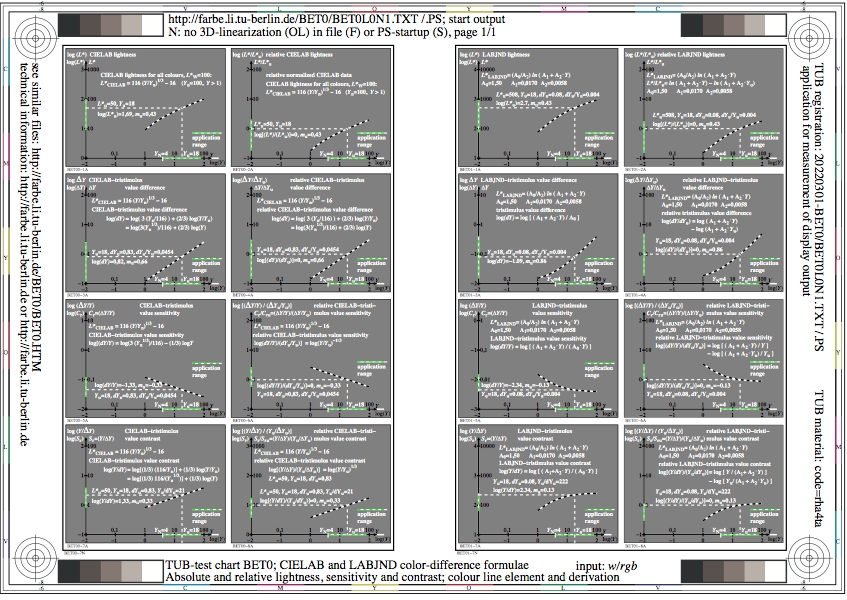
Figure BET0L0N1.jpg: Output in format A6 of the file
BET0L0NP.PDF, see
BET0L0N1.
PS /
TXT /
PDF /
jpg
BET0: TUB-test chart BET0; Colour difference formulae
CIELAB for spacing and LABJND for thresholds
absolute and relative lightness, sensitivity and contrast
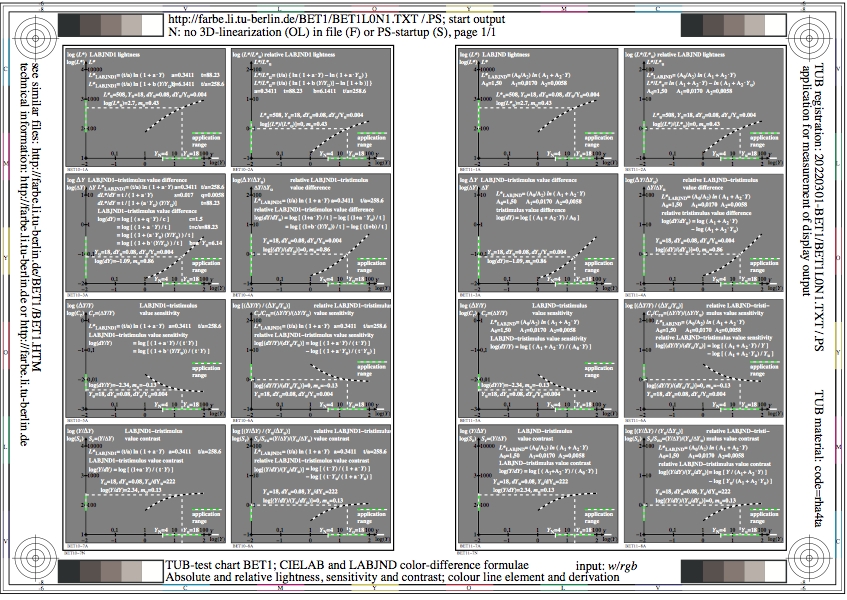
Figure BET1L0N1.jpg: Output in format A6 of the file
BET1L0NP.PDF, see
BET1L0N1.
PS /
TXT /
PDF /
jpg
BET1: TUB-test chart BET1; Colour difference formulae
LABJND1 and LABJND for thresholds
absolute and relative lightness, sensitivity and contrast
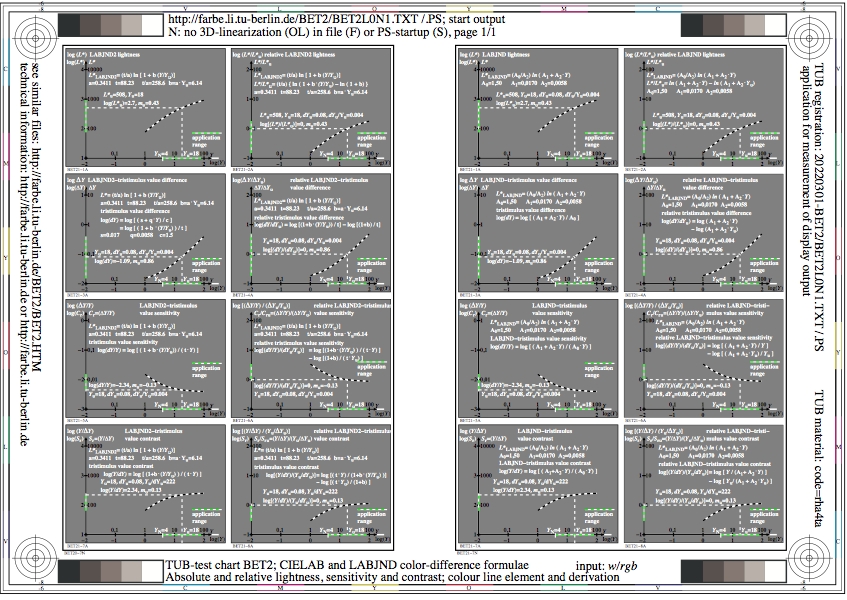
Figure BET2L0N1.jpg: Output in format A6 of the file
BET2L0NP.PDF, see
BET2L0N1.
PS /
TXT /
PDF /
jpg
BET2: TUB-test chart BET2; Colour difference formulae
LABJND2 and LABJND for thresholds
absolute and relative lightness, sensitivity and contrast
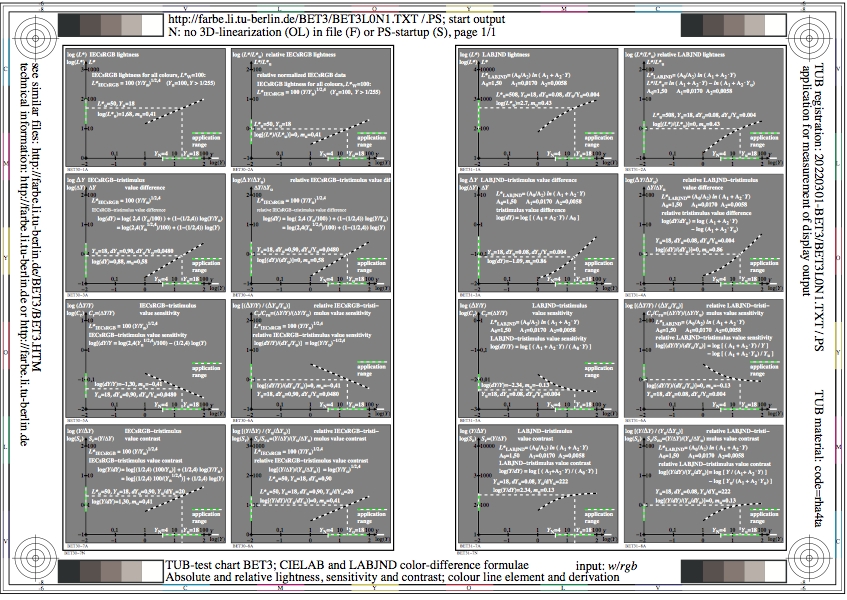
Figure BET3L0N1.jpg: Output in format A6 of the file
BET3L0NP.PDF, see
BET3L0N1.
PS /
TXT /
PDF /
jpg
BET3: TUB-test chart BET3; Colour difference formulae
IECsRGB for spacing and LABJND for thresholds
absolute and relative lightness, sensitivity and contrast
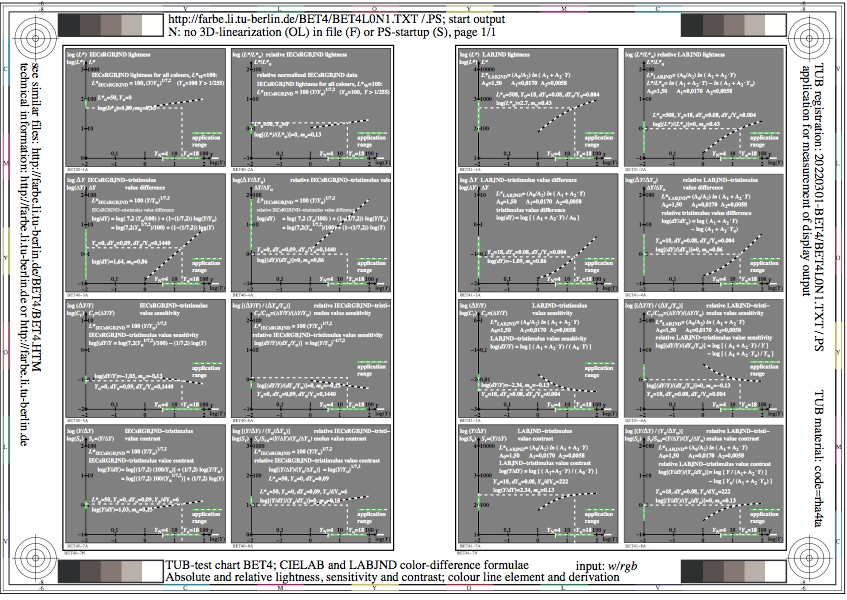
Figure BET4L0N1.jpg: Output in format A6 of the file
BET4L0NP.PDF, see
BET4L0N1.
PS /
TXT /
PDF /
jpg
BET4: TUB-test chart BET4; Colour difference formulae
IECsRGBJND and LABJND for thresholds
absolute and relative lightness, sensitivity and contrast
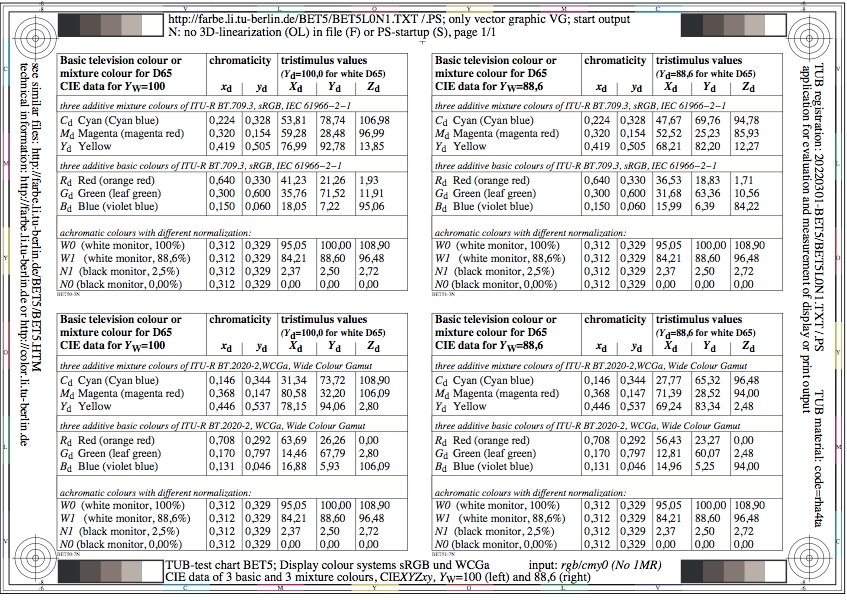
Figure BET5L0N1.jpg: Output in format A6 of the file
BET5L0NP.PDF, see
BET5L0N1.
PS /
TXT /
PDF /
jpg
BET5: TUB-test chart BET5; Display-color systems sRGB and WCGa
CIE data of 3 basic and mixture colours
CIEXYZxy data, Yw=100 (left) and 88,6 (right)
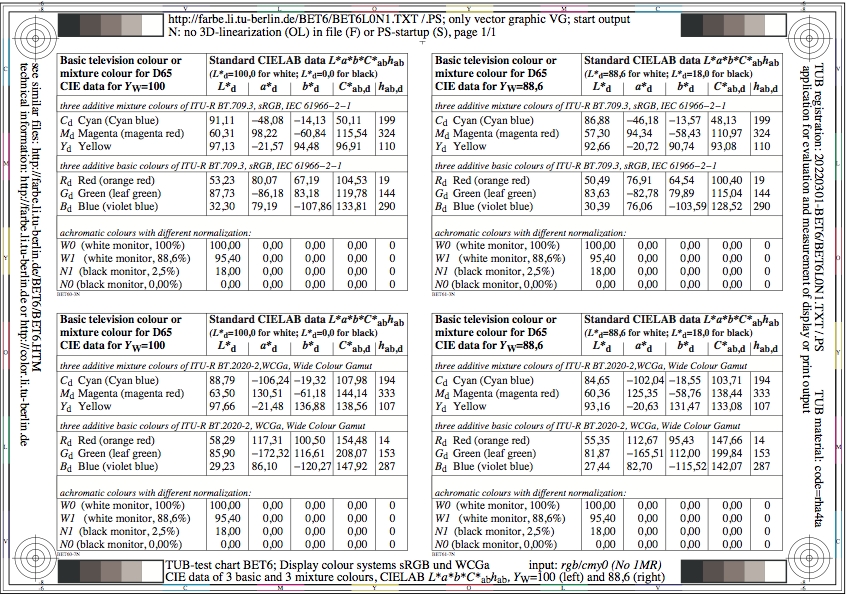
Figure BET6L0N1.jpg: Output in format A6 of the file
BET6L0NP.PDF, see
BET6L0N1.
PS /
TXT /
PDF /
jpg
BET6: TUB-test chart BET6; Display-color systems sRGB and WCGa
CIE data of 3 basic and mixture colours
CIELAB data, Yw=100 (left) and 88,6 (right)
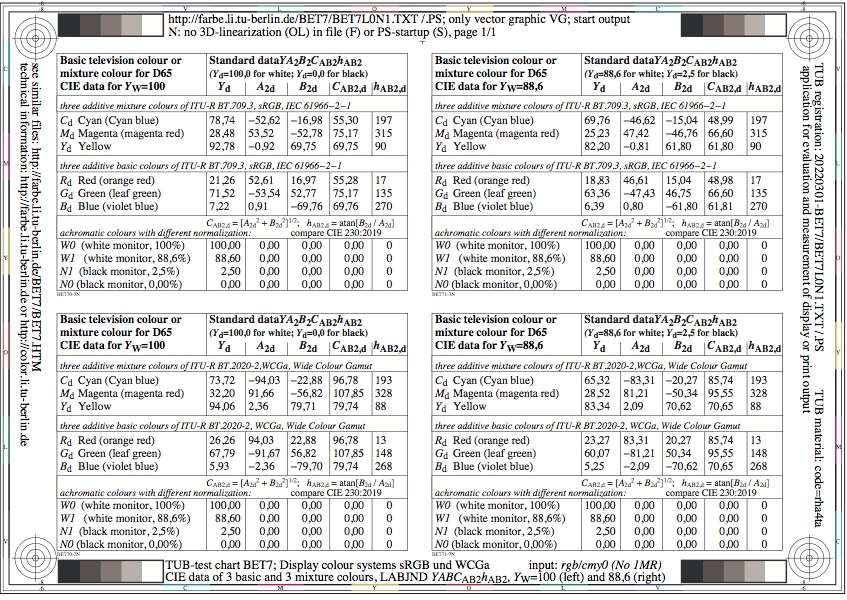
Figure BET7L0N1.jpg: Output in format A6 of the file
BET7L0NP.PDF, see
BET7L0N1.
PS /
TXT /
PDF /
jpg
BET7: TUB-test chart BET7; Display-color systems sRGB and WCGa
CIE data of 3 basic and mixture colours
YABCh2 data, Yw=100 (left) and 88,6 (right)
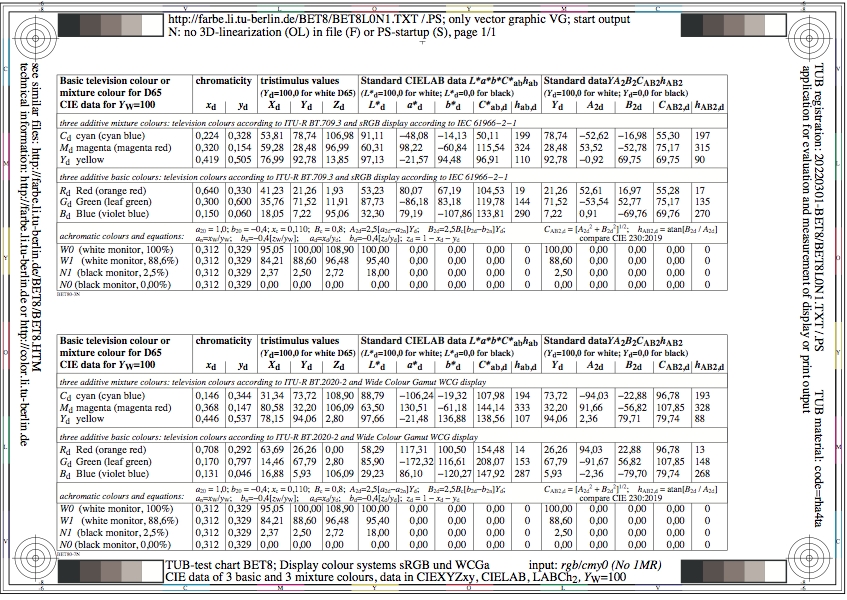
Figure BET8L0N1.jpg: Output in format A6 of the file
BET8L0NP.PDF, see
BET8L0N1.
PS /
TXT /
PDF /
jpg
BET8: TUB-test chart BET8; Display-colour systems sRGBand WCGa
CIE data of 3 basic and mixture colours
data in CIEXYZxy, CIELAB, and YABCh2, Yw=100
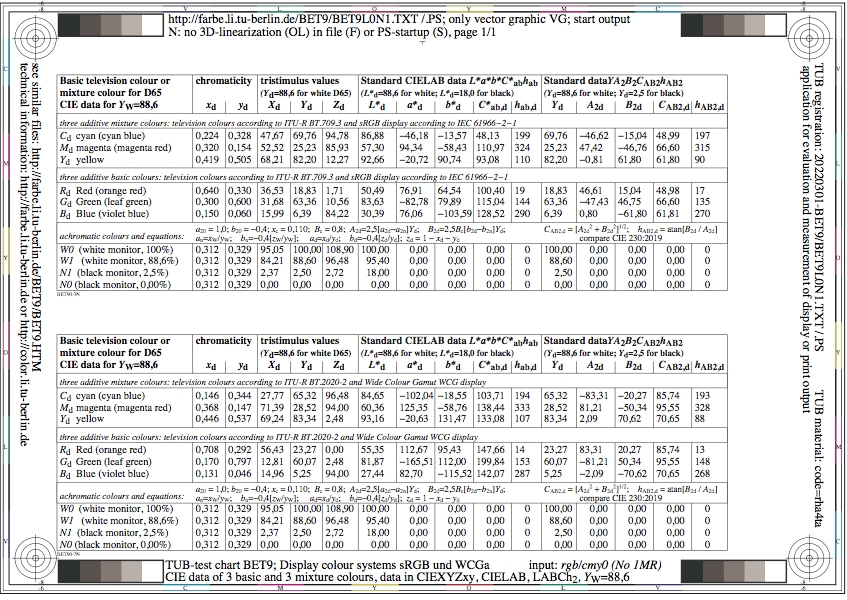
Figure BET9L0N1.jpg: Output in format A6 of the file
BET9L0NP.PDF, see
BET9L0N1.
PS /
TXT /
PDF /
jpg

Figure BEU0L0N1.jpg: Output in format A6 of the file
BEU0L0NP.PDF, see
BEU0L0N1.
PS /
TXT /
PDF /
jpg
BEU0: TUB-test chart BEU0; Ostwald, sRGB, and WCGa colours
colours in chromaticity diagram (x, y)
colours in chromatic value diagram (A2, B2)

Figure BEU1L0N1.jpg: Output in format A6 of the file
BEU1L0NP.PDF, see
BEU1L0N1.
PS /
TXT /
PDF /
jpg
BEU1: TUB-test chart BEU1; Colour-difference formulae W & Yn
CIELAB for spacing and LABJND for thresholds
absolute and relative lightness, sensitivity and contrast
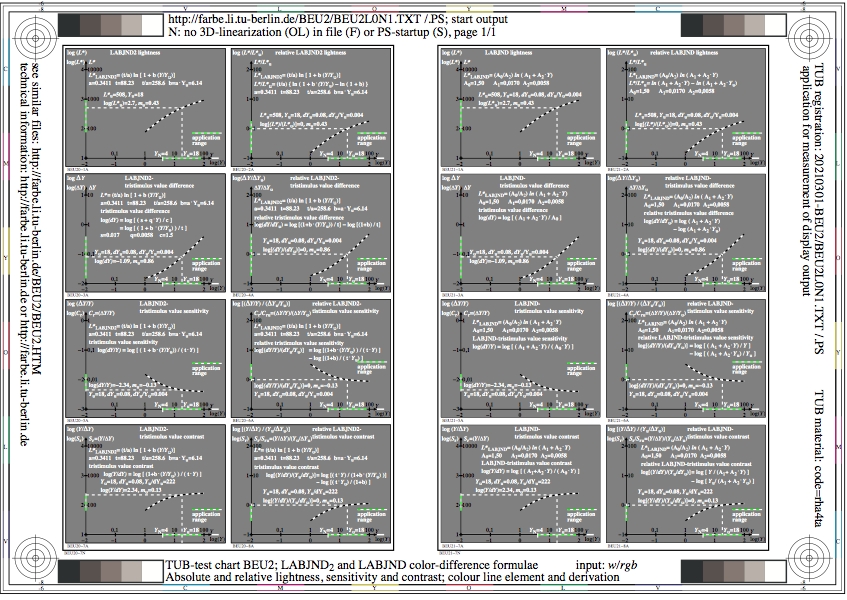
Figure BEU2L0N1.jpg: Output in format A6 of the file
BEU2L0NP.PDF, see
BEU2L0N1.
PS /
TXT /
PDF /
jpg
BEU2: TUB-test chart BEU2; Colour-difference formulae W & Yn
LABJND2 and LABJND for thresholds
absolute and relative lightness, sensitivity and contrast
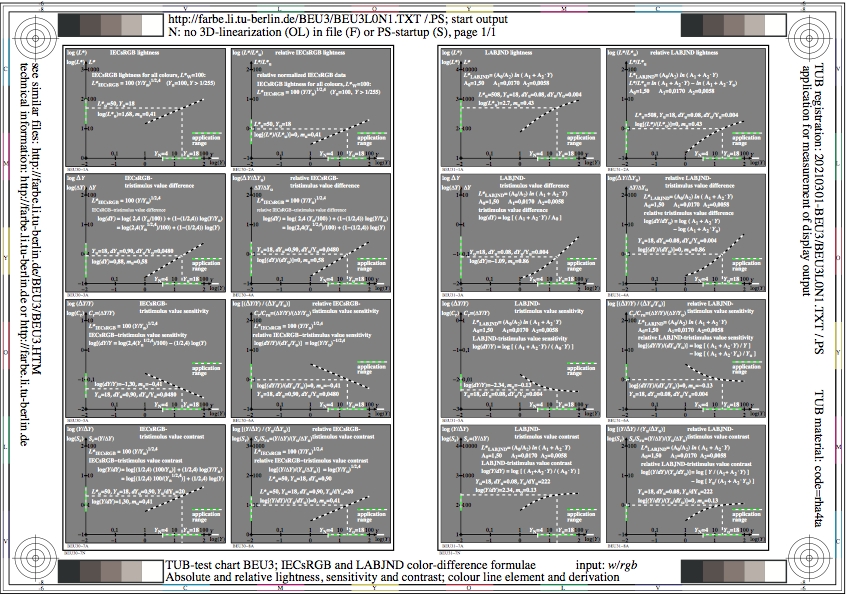
Figure BEU3L0N1.jpg: Output in format A6 of the file
BEU3L0NP.PDF, see
BEU3L0N1.
PS /
TXT /
PDF /
jpg
BEU3: TUB-test chart BEU3; Colour-difference formulae W & Yn
IECsRGB for spacing and LABJND for thresholds
absolute and relative lightness, sensitivity and contrast
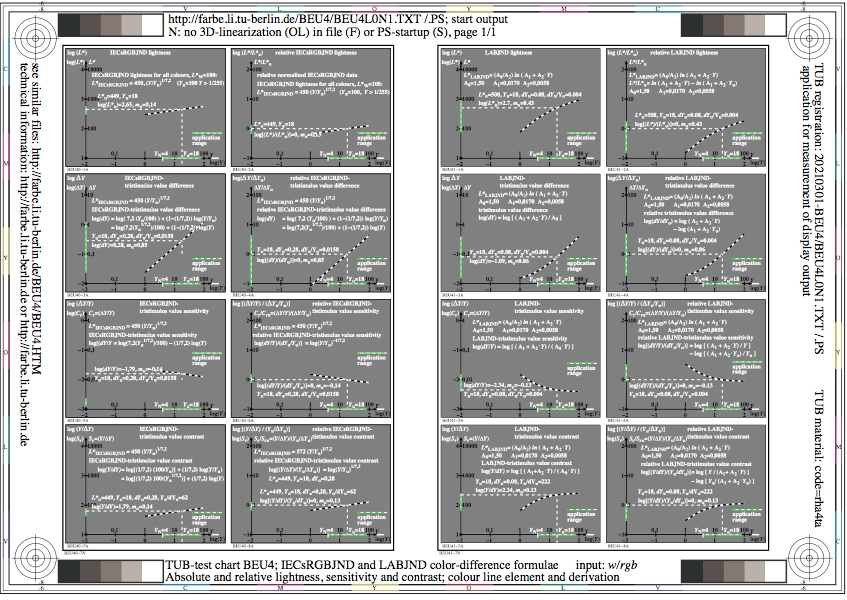
Figure BEU4L0N1.jpg: Output in format A6 of the file
BEU4L0NP.PDF, see
BEU4L0N1.
PS /
TXT /
PDF /
jpg
BEU4: TUB-test chart BEU4; Colour-difference formulae W & Yn
IECsRGBJND and LABJND for thresholds
absolute and relative lightness, sensitivity and contrast

Figure BEU5L0N1.jpg: Output in format A6 of the file
BEU5L0NP.PDF, see
BEU5L0N1.
PS /
TXT /
PDF /
jpg
BEU5: TUB-test chart BEU5; Viewing situations in three surrounds
Lightness functions and derivations for separated
and adjacent colours in three surrounds N, Z, W
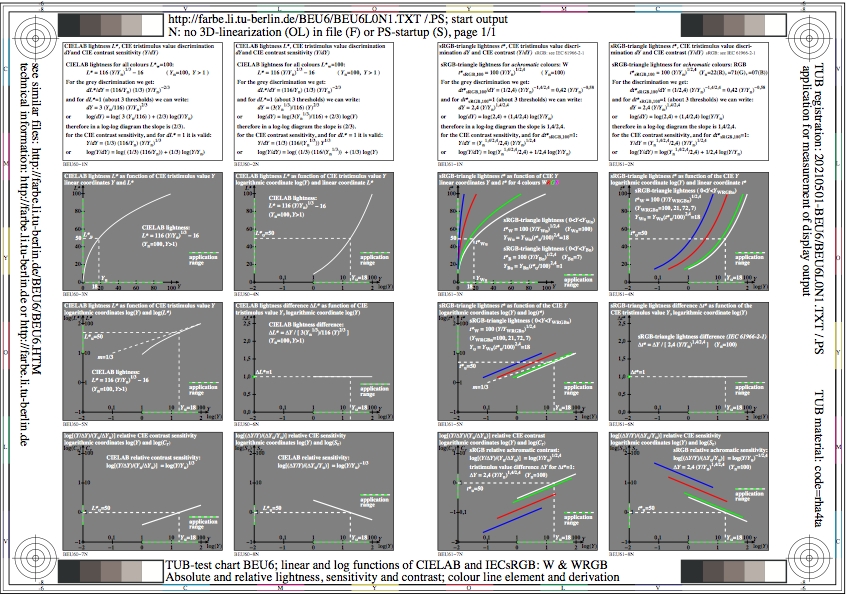
Figure BEU6L0N1.jpg: Output in format A6 of the file
BEU6L0NP.PDF, see
BEU6L0N1.
PS /
TXT /
PDF /
jpg
BEU6: TUB-test chart BEU6; Colour-difference formulae WRGB & Yn
CIELAB and IECsRGB colour-difference formulae, linear Y
absolute and relative lightness, sensitivity and contrast
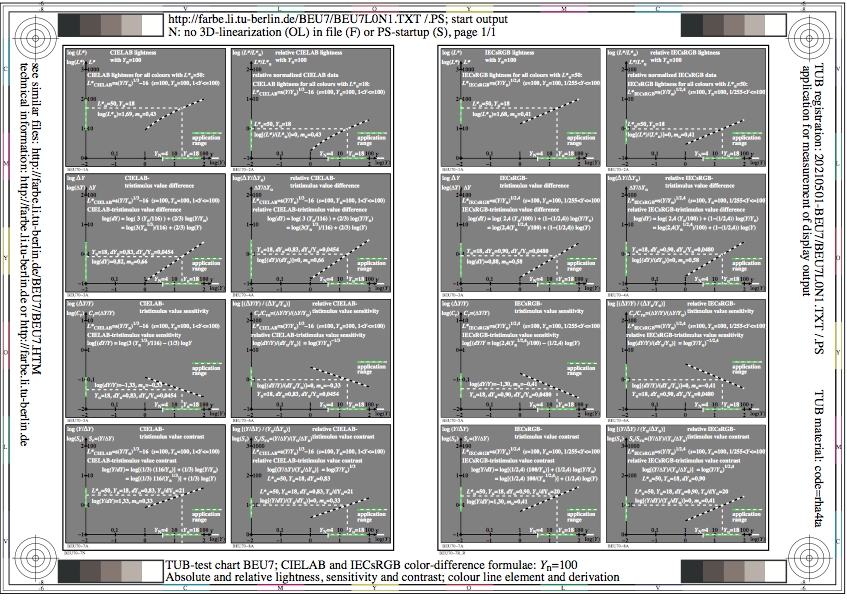
Figure BEU7L0N1.jpg: Output in format A6 of the file
BEU7L0NP.PDF, see
BEU7L0N1.
PS /
TXT /
PDF /
jpg
BEU7: TUB-test chart BEU7; Colour-difference formulae W & Yn
CIELAB and IECsRGB colour-difference formulae
absolute and relative lightness, sensitivity and contrast

Figure BEU8L0N1.jpg: Output in format A6 of the file
BEU8L0NP.PDF, see
BEU8L0N1.
PS /
TXT /
PDF /
jpg
BEU8: TUB-test chart BEU8; Colour-difference formulae W & Yu
CIELAB and IECsRGB colour-difference formulae
absolute and relative lightness, sensitivity and contrast
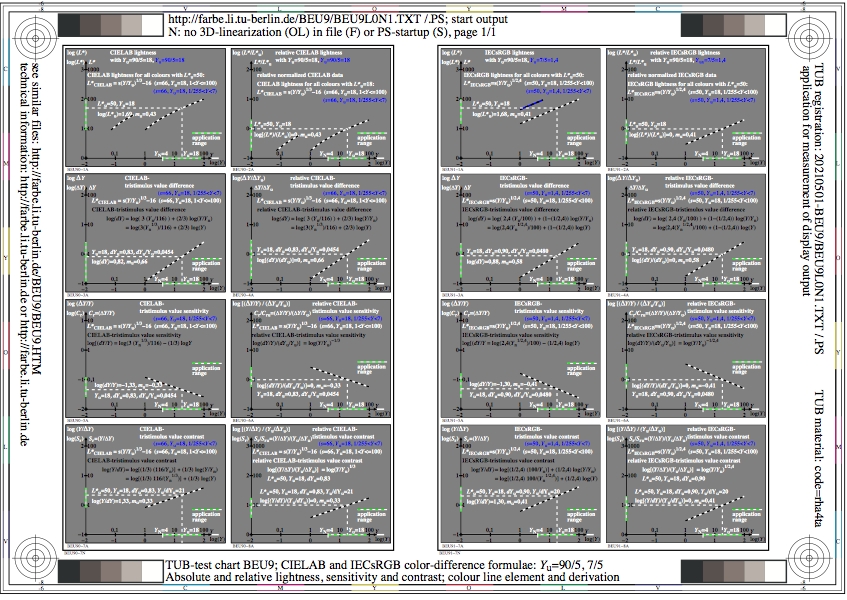
Figure BEU9L0N1.jpg: Output in format A6 of the file
BEU9L0NP.PDF, see
BEU9L0N1.
PS /
TXT /
PDF /
jpg
BEU9: TUB-test chart BEU9; Colour-difference formulae WB & Yu
CIELAB and IECsRGB colour-difference formulae
absolute and relative lightness, sensitivity and contrast
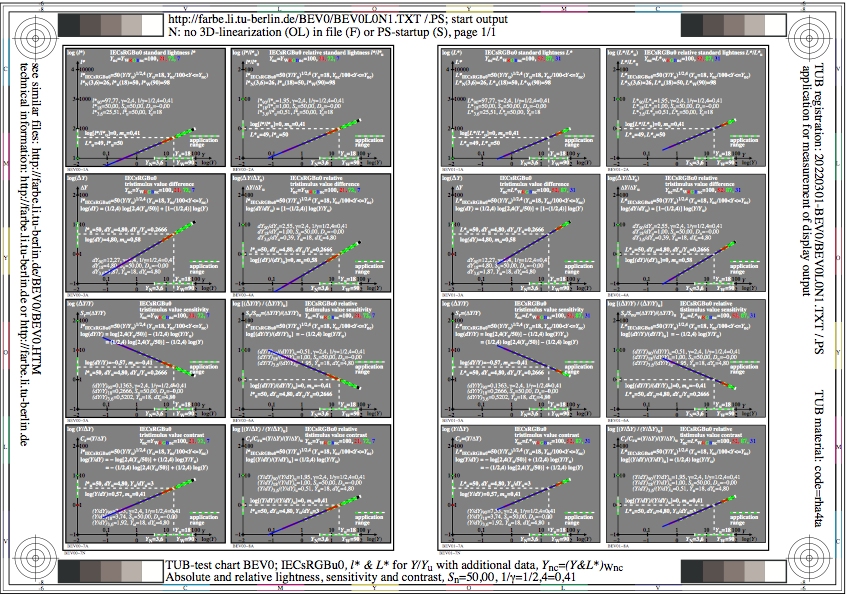
Figure BEV0L0N1.jpg: Output in format A6 of the file
BEV0L0NP.PDF, see
BEV0L0N1.
PS /
TXT /
PDF /
jpg
BEV0: TUB-test chart BEV0; Colour-difference formulae t* & T*
IECsRGBu0 colour-lightness formulae for (Y/Yn)
absolute and relative lightness, sensitivity and contrast
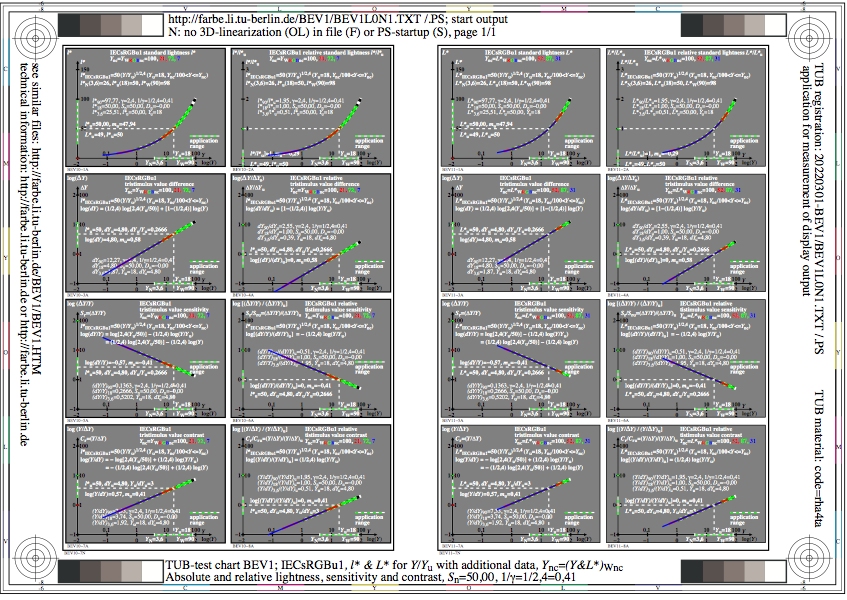
Figure BEV1L0N1.jpg: Output in format A6 of the file
BEV1L0NP.PDF, see
BEV1L0N1.
PS /
TXT /
PDF /
jpg
BEV1: TUB-test chart BEV1; Colour-difference formulae t* & T*
IECsRGBu1 colour-lightness formulae for (Y/Yn)
absolute and relative lightness, sensitivity and contrast

Figure BEV2L0N1.jpg: Output in format A6 of the file
BEV2L0NP.PDF, see
BEV2L0N1.
PS /
TXT /
PDF /
jpg
BEV2: TUB-test chart BEV2; Colour-difference formulae t* & T*
IECsRGBu2 triangle-lightness formulae for (Y/Yn)
absolute and relative lightness, sensitivity and contrast
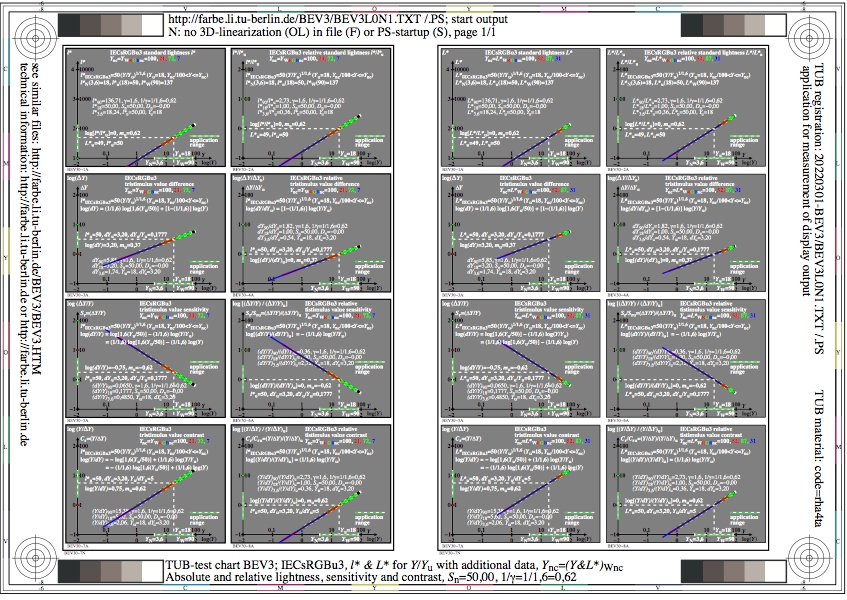
Figure BEV3L0N1.jpg: Output in format A6 of the file
BEV3L0NP.PDF, see
BEV3L0N1.
PS /
TXT /
PDF /
jpg
BEV3: TUB-test chart BEV3; Colour-difference formulae t* & T*
IECsRGBu3 triangle-lightness formulae for (Y/Yn)
absolute and relative lightness, sensitivity and contrast

Figure BEV4L0N1.jpg: Output in format A6 of the file
BEV4L0NP.PDF, see
BEV4L0N1.
PS /
TXT /
PDF /
jpg
BEV4: TUB-test chart BEV4; Colour-difference formulae t* & T*
IECsRGBu4 triangle-lightness formulae for (Y/Yn)
absolute and relative lightness, sensitivity and contrast
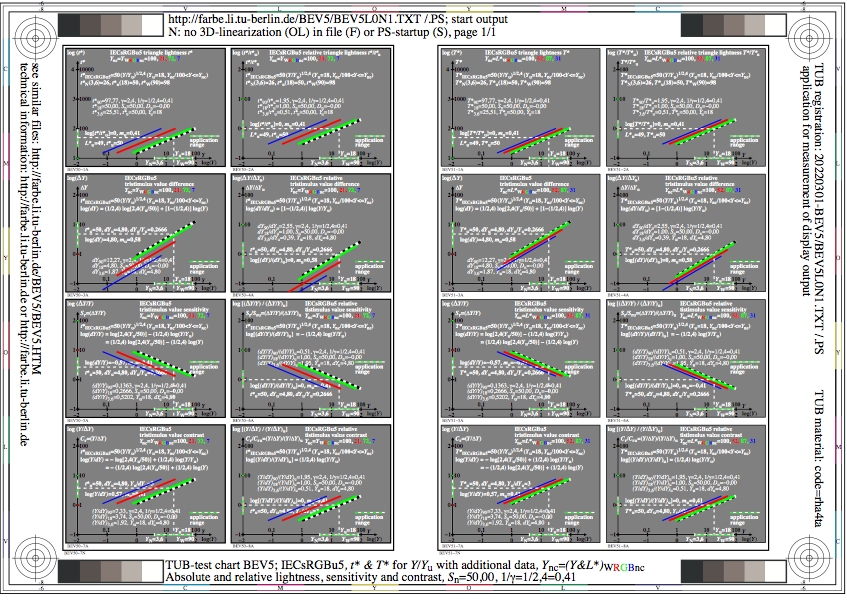
Figure BEV5L0N1.jpg: Output in format A6 of the file
BEV5L0NP.PDF, see
BEV5L0N1.
PS /
TXT /
PDF /
jpg
BEV5: TUB-test chart BEV5; Colour-difference formulae t* & T*
IECsRGBu5 triangle-lightness formulae for (Y/Yn)
absolute and relative lightness, sensitivity and contrast
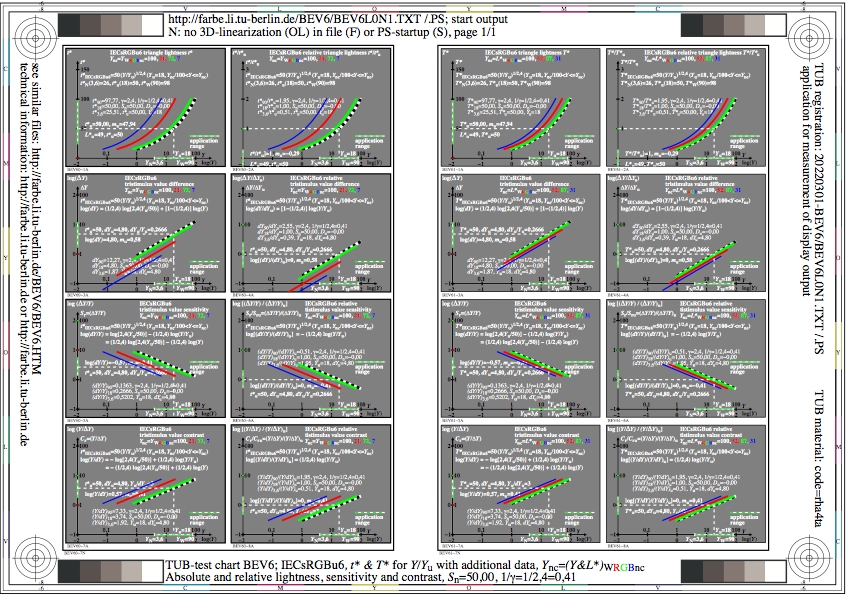
Figure BEV6L0N1.jpg: Output in format A6 of the file
BEV6L0NP.PDF, see
BEV6L0N1.
PS /
TXT /
PDF /
jpg
BEV6: TUB-test chart BEV6; Colour-difference formulae t* & T*
IECsRGBu6 triangle-lightness formulae for (Y/Yn)
absolute and relative lightness, sensitivity and contrast

Figure BEV7L0N1.jpg: Output in format A6 of the file
BEV7L0NP.PDF, see
BEV7L0N1.
PS /
TXT /
PDF /
jpg
BEV7: TUB-test chart BEV7; Colour-difference formulae t* & T*
IECsRGBu7 triangle-lightness formulae for (Y/Yn)
absolute and relative lightness, sensitivity and contrast

Figure BEV8L0N1.jpg: Output in format A6 of the file
BEV8L0NP.PDF, see
BEV8L0N1.
PS /
TXT /
PDF /
jpg
BEV8: TUB-test chart BEV8; Colour-difference formulae t* & T*
IECsRGBu8 triangle-lightness formulae for (Y/Yn)
absolute and relative lightness, sensitivity and contrast

Figure BEV9L0N1.jpg: Output in format A6 of the file
BEV9L0NP.PDF, see
BEV9L0N1.
PS /
TXT /
PDF /
jpg
BEV9: TUB-test chart BEV9; Colour-difference formulae t* & T*
IECsRGBu9 triangle-lightness formulae for (Y/Yn)
absolute and relative lightness, sensitivity and contrast

Figure BEW0L0N1.jpg: Output in format A6 of the file
BEW0L0NP.PDF, see
BEW0L0N1.
PS /
TXT /
PDF /
jpg
BEW0: TUB-test chart BEW0; Colour-difference formulae t* & T*
IECsRGBu0 colour-lightness formulae for (Y/Yn)
absolute and relative lightness, sensitivity and contrast
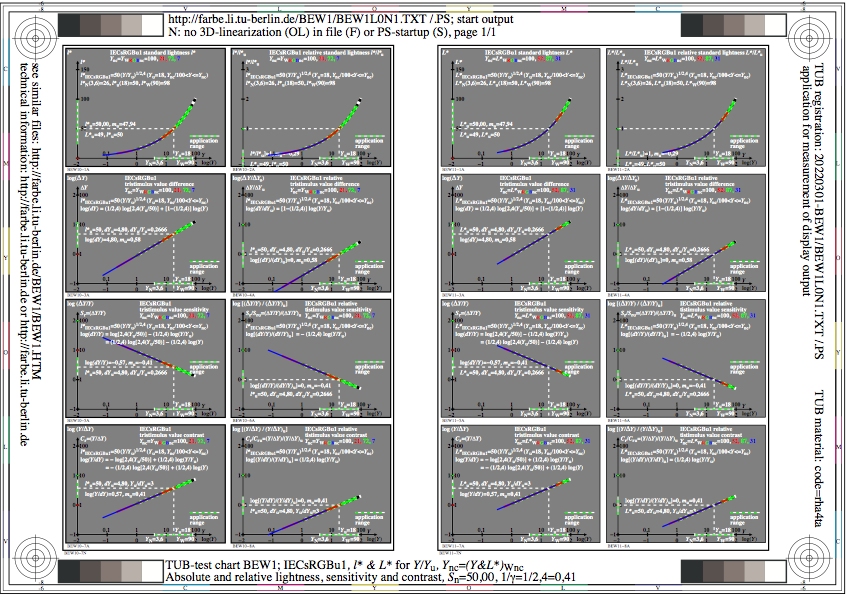
Figure BEW1L0N1.jpg: Output in format A6 of the file
BEW1L0NP.PDF, see
BEW1L0N1.
PS /
TXT /
PDF /
jpg
BEW1: TUB-test chart BEW1; Colour-difference formulae t* & T*
IECsRGBu1 colour-lightness formulae for (Y/Yn)
absolute and relative lightness, sensitivity and contrast
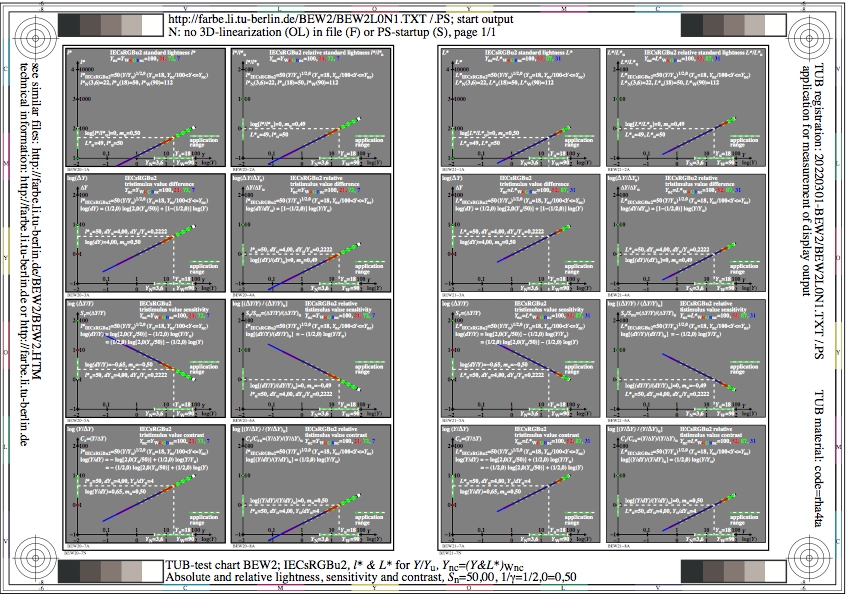
Figure BEW2L0N1.jpg: Output in format A6 of the file
BEW2L0NP.PDF, see
BEW2L0N1.
PS /
TXT /
PDF /
jpg
BEW2: TUB-test chart BEW2; Colour-difference formulae t* & T*
IECsRGBu2 triangle-lightness formulae for (Y/Yn)
absolute and relative lightness, sensitivity and contrast
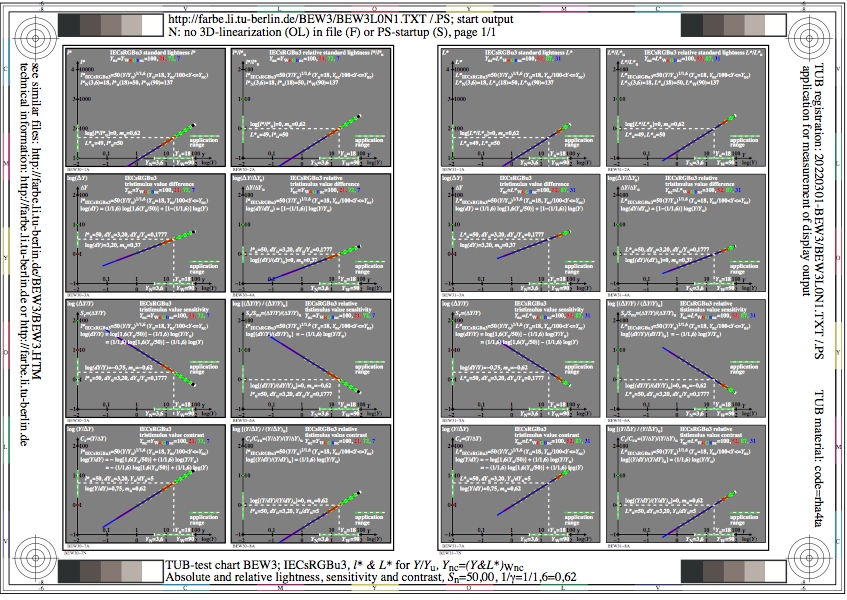
Figure BEW3L0N1.jpg: Output in format A6 of the file
BEW3L0NP.PDF, see
BEW3L0N1.
PS /
TXT /
PDF /
jpg
BEW3: TUB-test chart BEW3; Colour-difference formulae t* & T*
IECsRGBu3 triangle-lightness formulae for (Y/Yn)
absolute and relative lightness, sensitivity and contrast
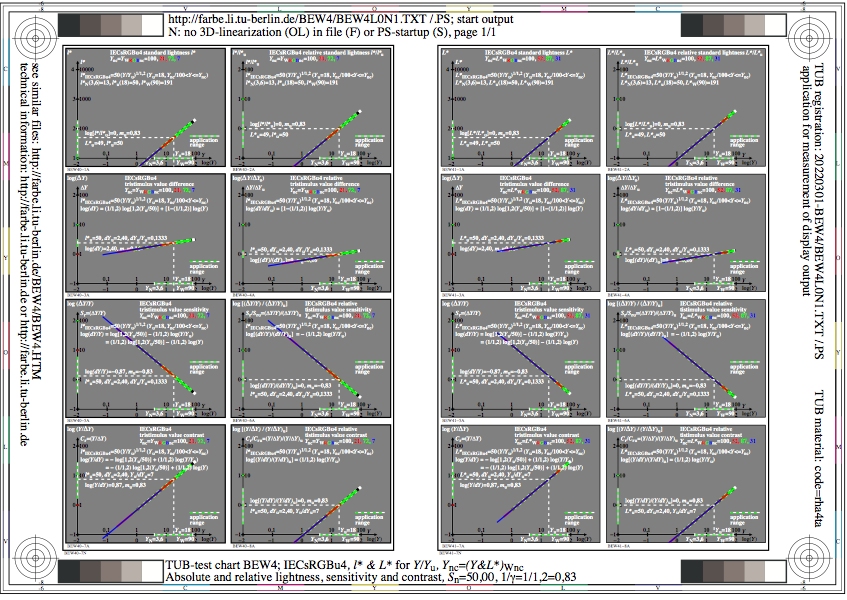
Figure BEW4L0N1.jpg: Output in format A6 of the file
BEW4L0NP.PDF, see
BEW4L0N1.
PS /
TXT /
PDF /
jpg
BEW4: TUB-test chart BEW4; Colour-difference formulae t* & T*
IECsRGBu4 triangle-lightness formulae for (Y/Yn)
absolute and relative lightness, sensitivity and contrast

Figure BEW5L0N1.jpg: Output in format A6 of the file
BEW5L0NP.PDF, see
BEW5L0N1.
PS /
TXT /
PDF /
jpg
BEW5: TUB-test chart BEW5; Colour-difference formulae t* & T*
IECsRGBu5 triangle-lightness formulae for (Y/Yn)
absolute and relative lightness, sensitivity and contrast
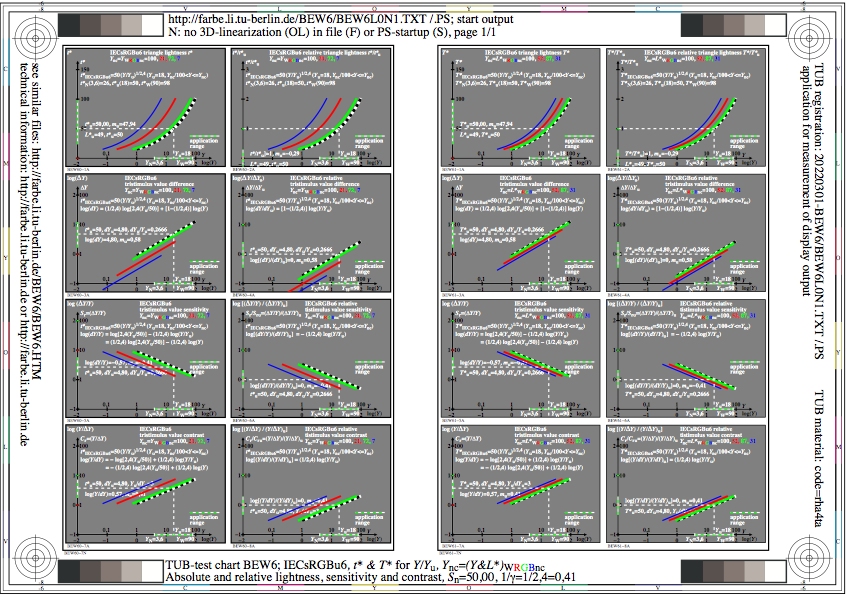
Figure BEW6L0N1.jpg: Output in format A6 of the file
BEW6L0NP.PDF, see
BEW6L0N1.
PS /
TXT /
PDF /
jpg
BEW6: TUB-test chart BEW6; Colour-difference formulae t* & T*
IECsRGBu6 triangle-lightness formulae for (Y/Yn)
absolute and relative lightness, sensitivity and contrast
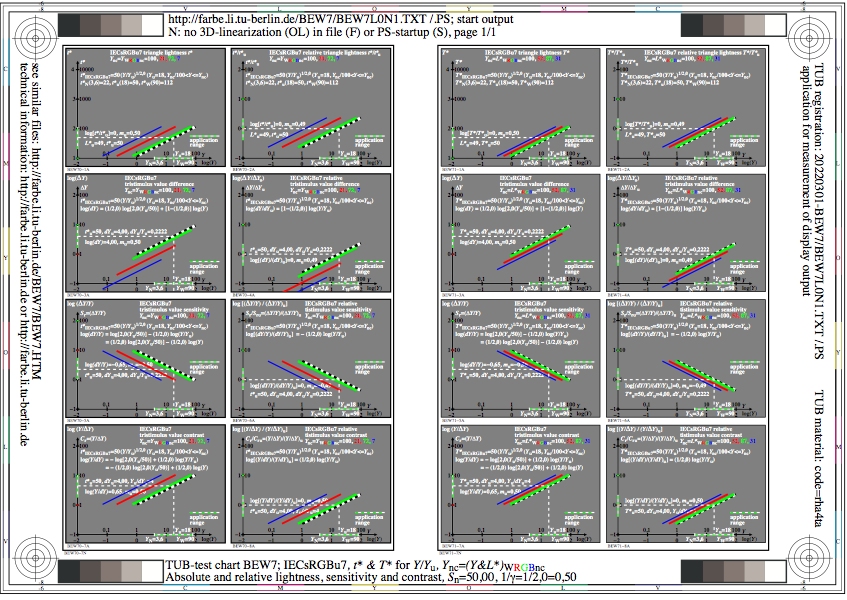
Figure BEW7L0N1.jpg: Output in format A6 of the file
BEW7L0NP.PDF, see
BEW7L0N1.
PS /
TXT /
PDF /
jpg
BEW7: TUB-test chart BEW7; Colour-difference formulae t* & T*
IECsRGBu7 triangle-lightness formulae for (Y/Yn)
absolute and relative lightness, sensitivity and contrast

Figure BEW8L0N1.jpg: Output in format A6 of the file
BEW8L0NP.PDF, see
BEW8L0N1.
PS /
TXT /
PDF /
jpg
BEW8: TUB-test chart BEW8; Colour-difference formulae t* & T*
IECsRGBu8 triangle-lightness formulae for (Y/Yn)
absolute and relative lightness, sensitivity and contrast
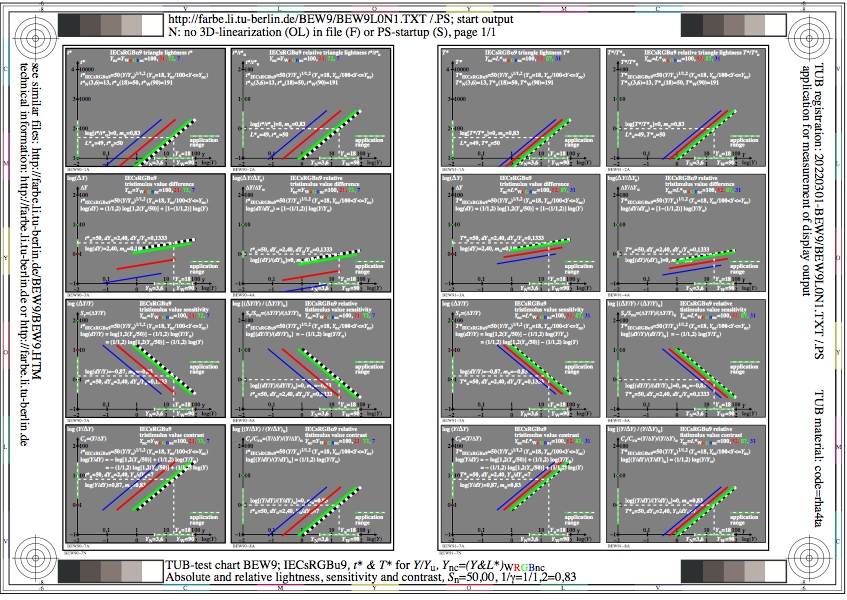
Figure BEW9L0N1.jpg: Output in format A6 of the file
BEW9L0NP.PDF, see
BEW9L0N1.
PS /
TXT /
PDF /
jpg
BEW9: TUB-test chart BEW9; Colour-difference formulae t* & T*
IECsRGBu9 triangle-lightness formulae for (Y/Yn)
absolute and relative lightness, sensitivity and contrast

Figure BEX0L0N1.jpg: Output in format A6 of the file
BEX0L0NP.PDF, see
BEX0L0N1.
PS /
TXT /
PDF /
jpg
BEX0: TUB-test chart BEX0; Colour-difference formulae t* & T*
CIELABu0 colour-lightness formulae for (Y/Yn)
absolute and relative lightness, sensitivity and contrast
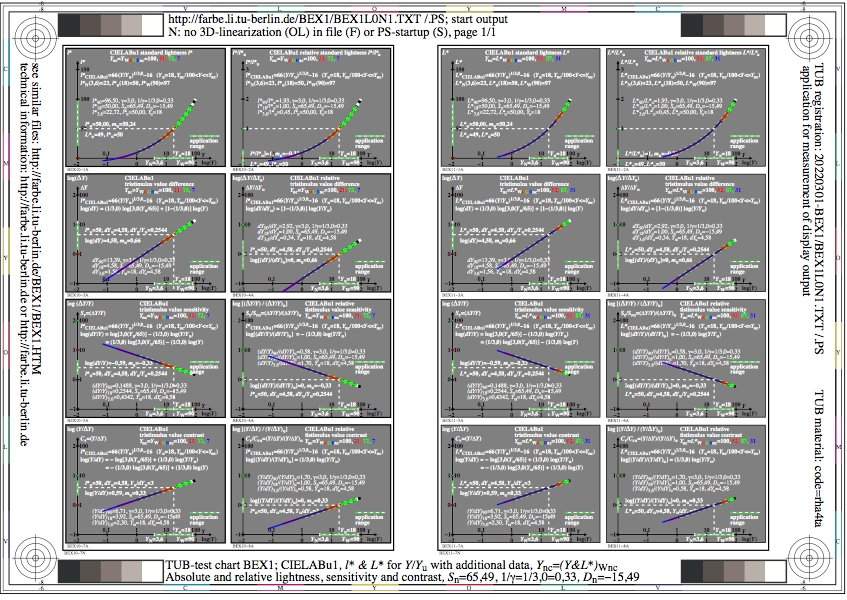
Figure BEX1L0N1.jpg: Output in format A6 of the file
BEX1L0NP.PDF, see
BEX1L0N1.
PS /
TXT /
PDF /
jpg
BEX1: TUB-test chart BEX1; Colour-difference formulae t* & T*
CIELABu1 colour-lightness formulae for (Y/Yn)
absolute and relative lightness, sensitivity and contrast
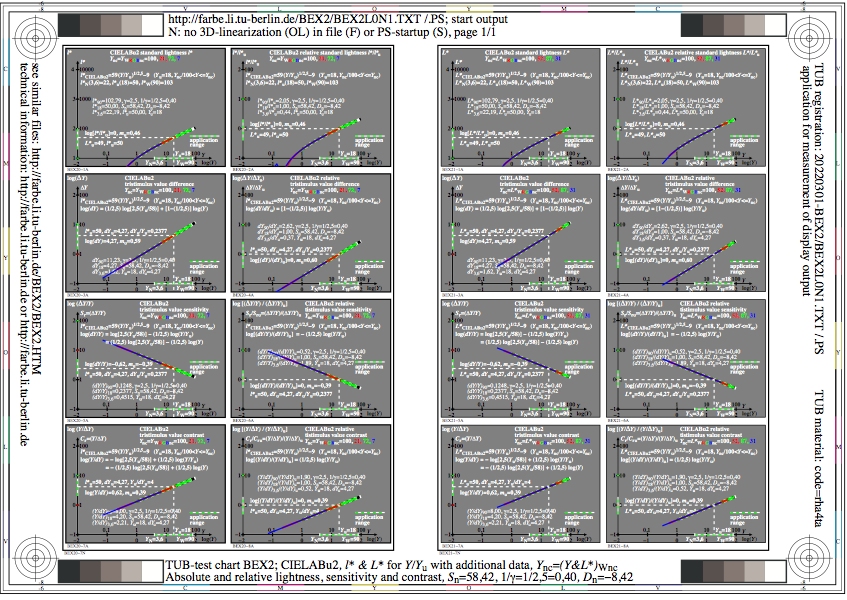
Figure BEX2L0N1.jpg: Output in format A6 of the file
BEX2L0NP.PDF, see
BEX2L0N1.
PS /
TXT /
PDF /
jpg
BEX2: TUB-test chart BEX2; Colour-difference formulae t* & T*
CIELABu2 triangle-lightness formulae for (Y/Yn)
absolute and relative lightness, sensitivity and contrast
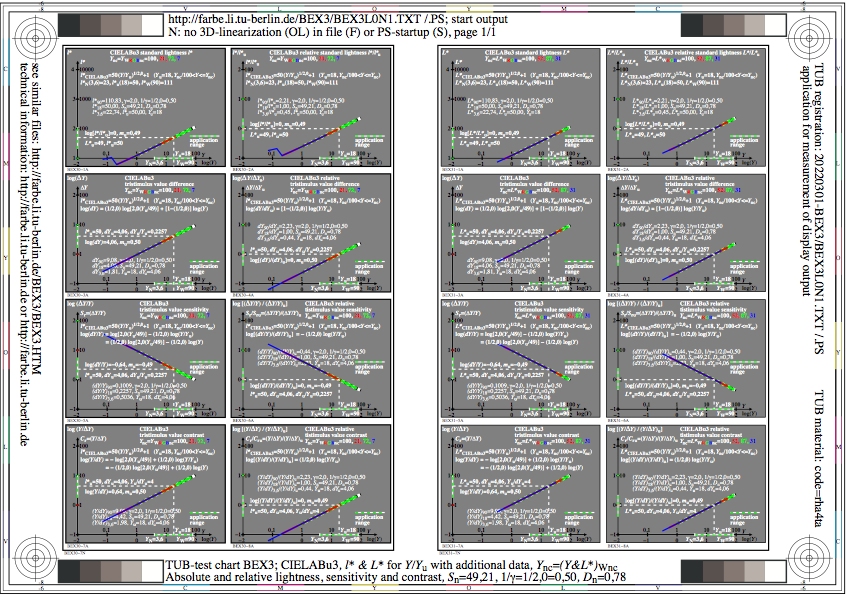
Figure BEX3L0N1.jpg: Output in format A6 of the file
BEX3L0NP.PDF, see
BEX3L0N1.
PS /
TXT /
PDF /
jpg
BEX3: TUB-test chart BEX3; Colour-difference formulae t* & T*
CIELABu3 triangle-lightness formulae for (Y/Yn)
absolute and relative lightness, sensitivity and contrast
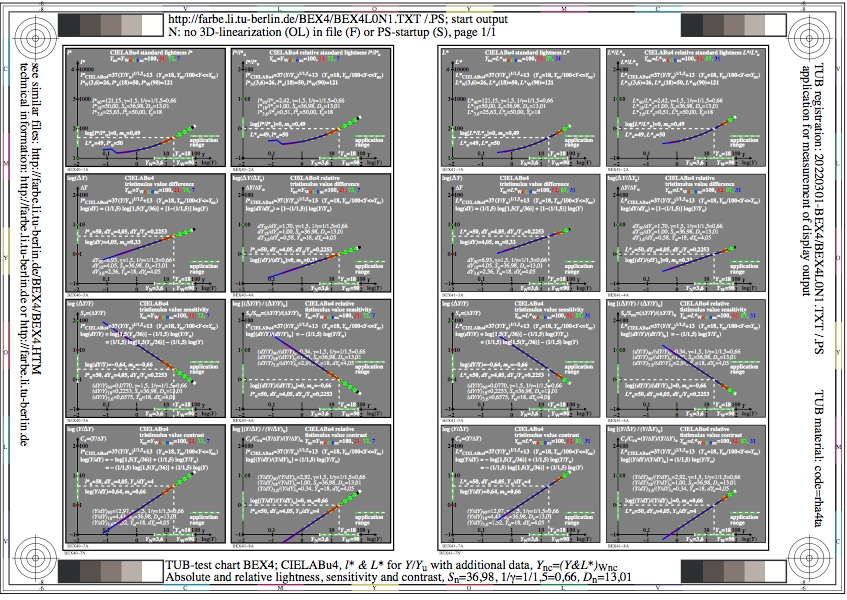
Figure BEX4L0N1.jpg: Output in format A6 of the file
BEX4L0NP.PDF, see
BEX4L0N1.
PS /
TXT /
PDF /
jpg
BEX4: TUB-test chart BEX4; Colour-difference formulae t* & T*
CIELABu4 triangle-lightness formulae for (Y/Yn)
absolute and relative lightness, sensitivity and contrast
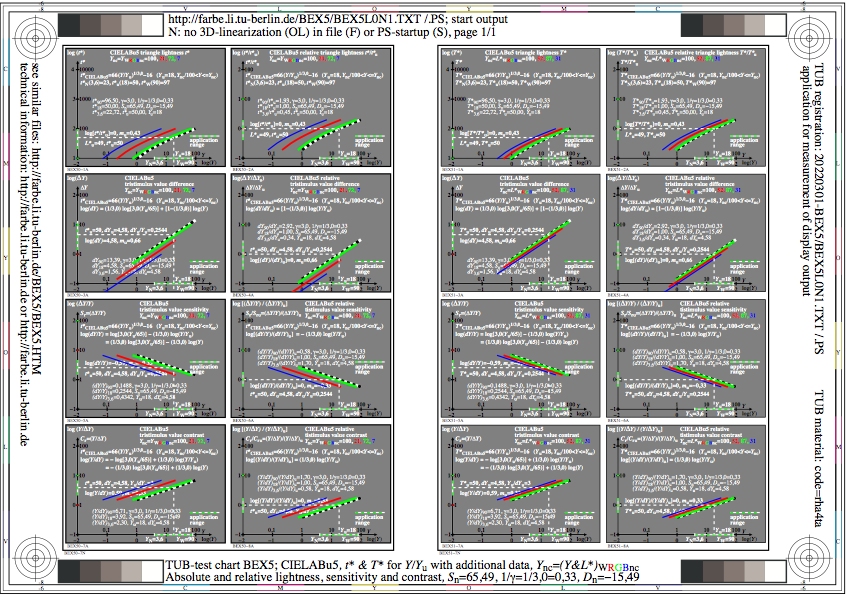
Figure BEX5L0N1.jpg: Output in format A6 of the file
BEX5L0NP.PDF, see
BEX5L0N1.
PS /
TXT /
PDF /
jpg
BEX5: TUB-test chart BEX5; Colour-difference formulae t* & T*
CIELABu5 triangle-lightness formulae for (Y/Yn)
absolute and relative lightness, sensitivity and contrast
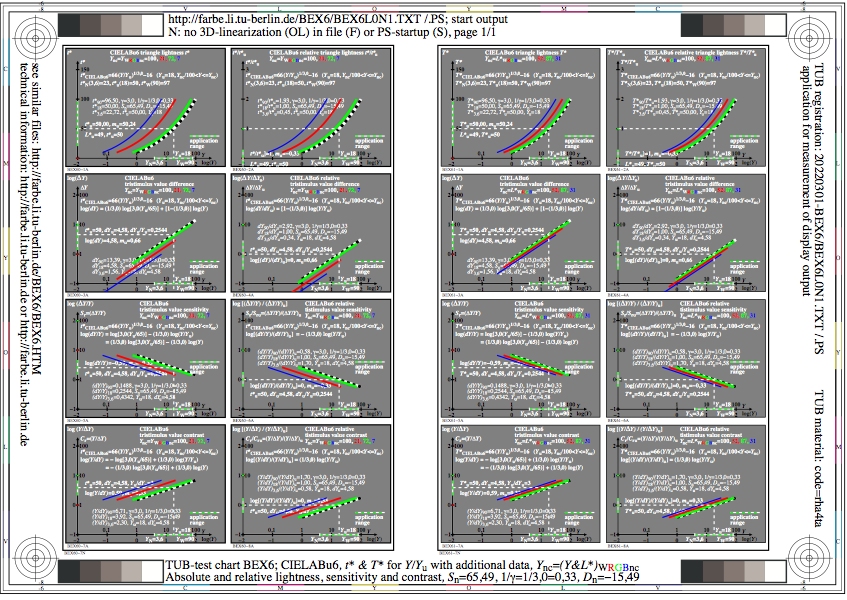
Figure BEX6L0N1.jpg: Output in format A6 of the file
BEX6L0NP.PDF, see
BEX6L0N1.
PS /
TXT /
PDF /
jpg
BEX6: TUB-test chart BEX6; Colour-difference formulae t* & T*
CIELABu6 triangle-lightness formulae for (Y/Yn)
absolute and relative lightness, sensitivity and contrast
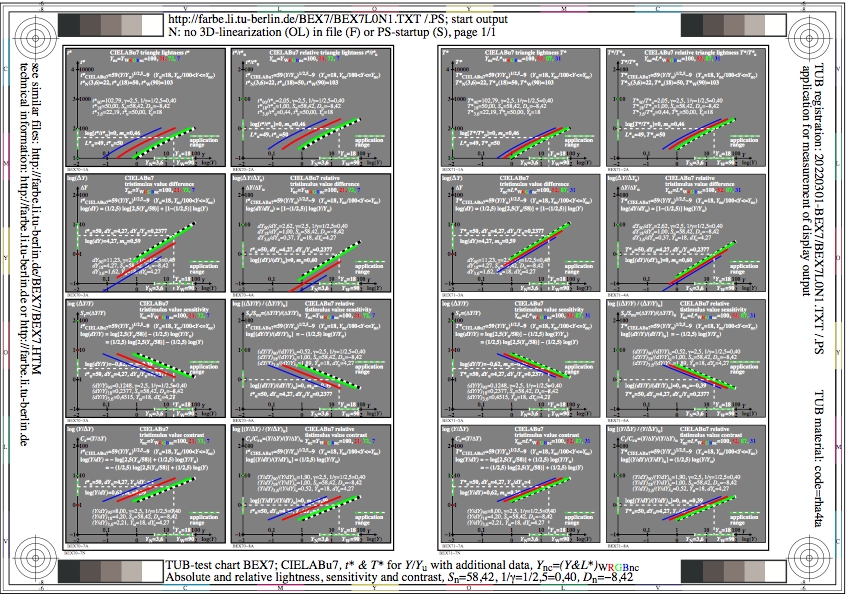
Figure BEX7L0N1.jpg: Output in format A6 of the file
BEX7L0NP.PDF, see
BEX7L0N1.
PS /
TXT /
PDF /
jpg
BEX7: TUB-test chart BEX7; Colour-difference formulae t* & T*
CIELABu7 triangle-lightness formulae for (Y/Yn)
absolute and relative lightness, sensitivity and contrast
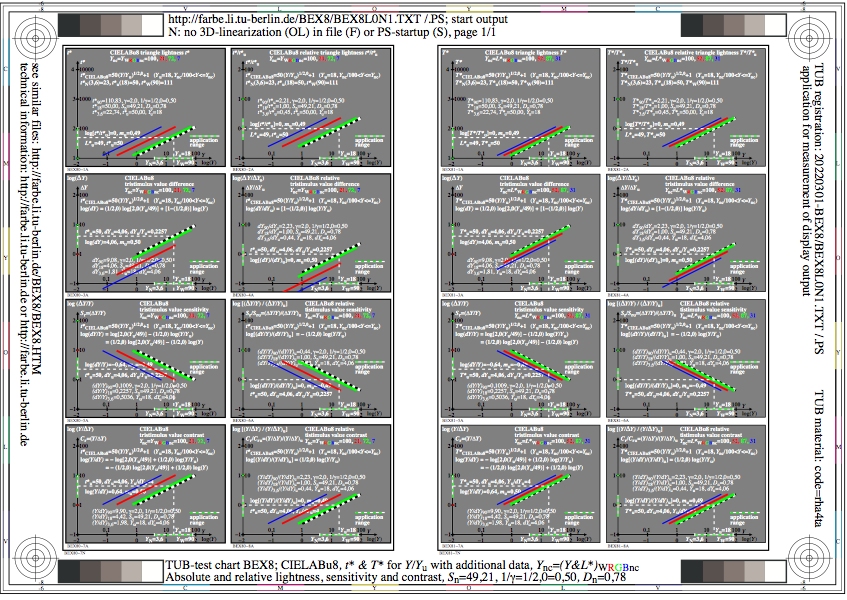
Figure BEX8L0N1.jpg: Output in format A6 of the file
BEX8L0NP.PDF, see
BEX8L0N1.
PS /
TXT /
PDF /
jpg
BEX8: TUB-test chart BEX8; Colour-difference formulae t* & T*
CIELABu8 triangle-lightness formulae for (Y/Yn)
absolute and relative lightness, sensitivity and contrast
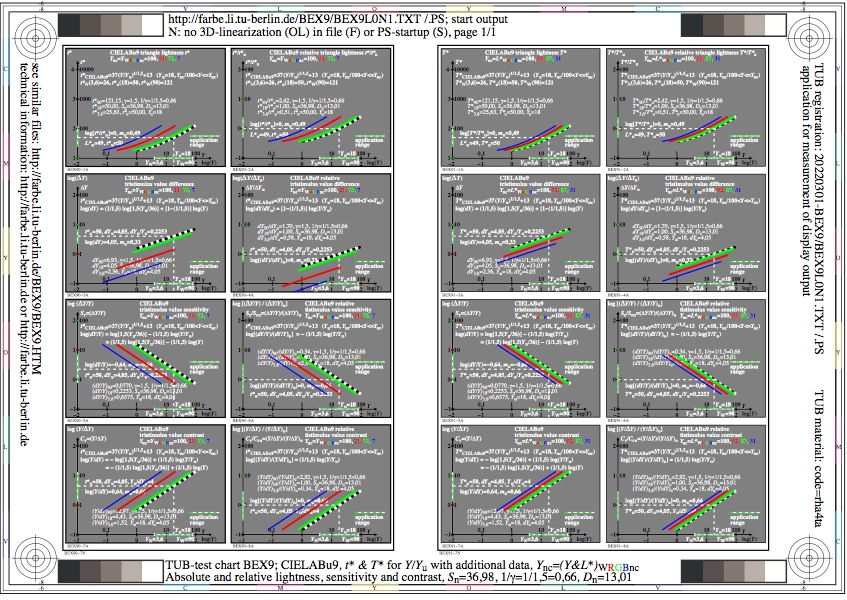
Figure BEX9L0N1.jpg: Output in format A6 of the file
BEX9L0NP.PDF, see
BEX9L0N1.
PS /
TXT /
PDF /
jpg
BEX9: TUB-test chart BEX9; Colour-difference formulae t* & T*
CIELABu9 triangle-lightness formulae for (Y/Yn)
absolute and relative lightness, sensitivity and contrast

Figure BEY0L0N1.jpg: Output in format A6 of the file
BEY0L0NP.PDF, see
BEY0L0N1.
PS /
TXT /
PDF /
jpg
BEY0: TUB-test chart BEY0; Colour-difference formulae t* & T*
CIELABu0 colour-lightness formulae for (Y/Yn)
absolute and relative lightness, sensitivity and contrast
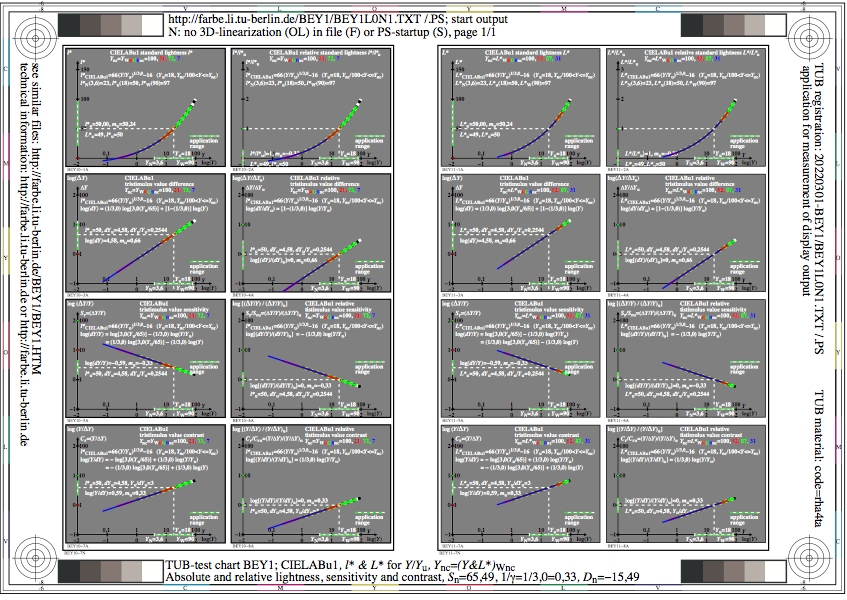
Figure BEY1L0N1.jpg: Output in format A6 of the file
BEY1L0NP.PDF, see
BEY1L0N1.
PS /
TXT /
PDF /
jpg
BEY1: TUB-test chart BEY1; Colour-difference formulae t* & T*
CIELABu1 colour-lightness formulae for (Y/Yn)
absolute and relative lightness, sensitivity and contrast
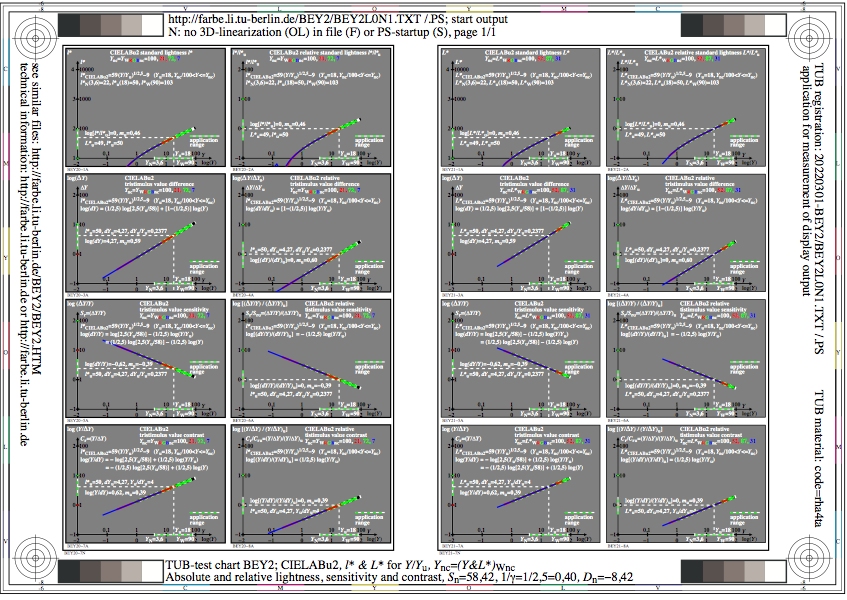
Figure BEY2L0N1.jpg: Output in format A6 of the file
BEY2L0NP.PDF, see
BEY2L0N1.
PS /
TXT /
PDF /
jpg
BEY2: TUB-test chart BEY2; Colour-difference formulae t* & T*
CIELABu2 triangle-lightness formulae for (Y/Yn)
absolute and relative lightness, sensitivity and contrast
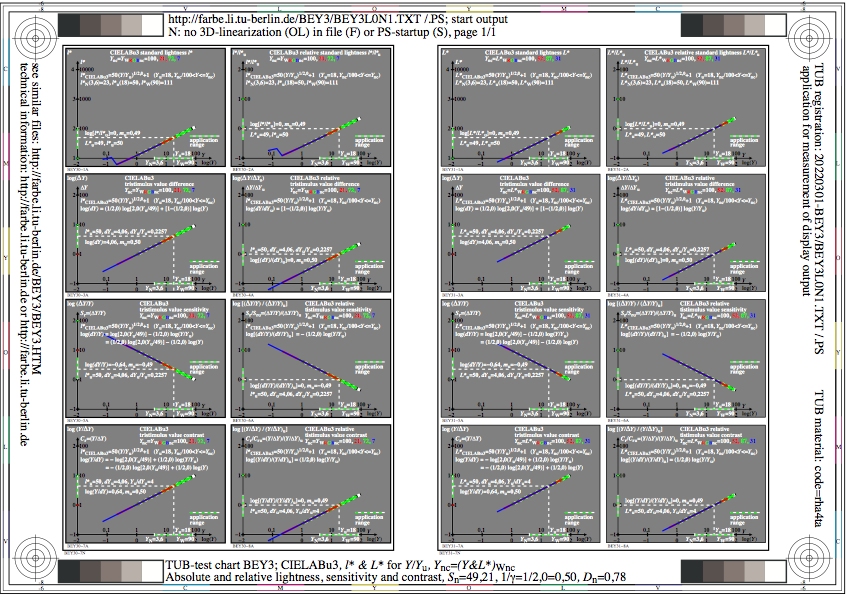
Figure BEY3L0N1.jpg: Output in format A6 of the file
BEY3L0NP.PDF, see
BEY3L0N1.
PS /
TXT /
PDF /
jpg
BEY3: TUB-test chart BEY3; Colour-difference formulae t* & T*
CIELABu3 triangle-lightness formulae for (Y/Yn)
absolute and relative lightness, sensitivity and contrast
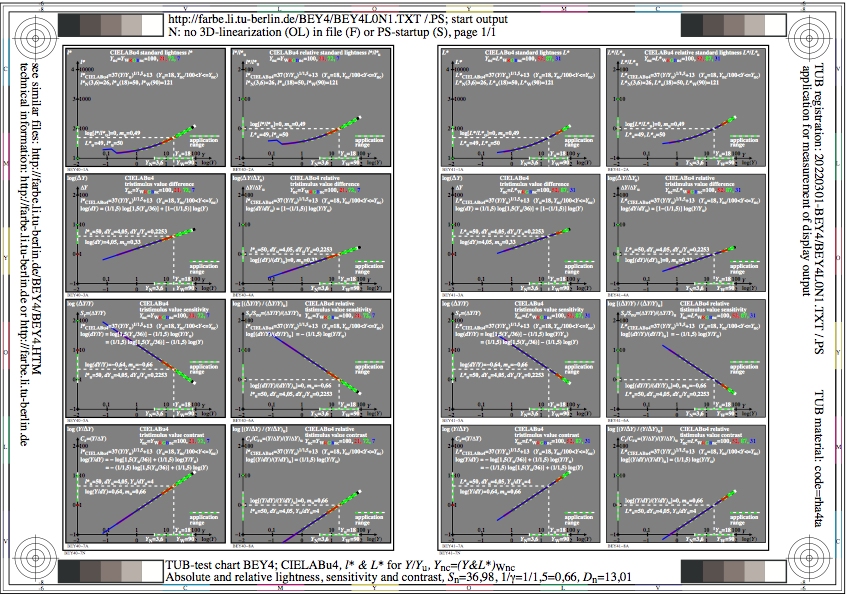
Figure BEY4L0N1.jpg: Output in format A6 of the file
BEY4L0NP.PDF, see
BEY4L0N1.
PS /
TXT /
PDF /
jpg
BEY4: TUB-test chart BEY4; Colour-difference formulae t* & T*
CIELABu4 triangle-lightness formulae for (Y/Yn)
absolute and relative lightness, sensitivity and contrast

Figure BEY5L0N1.jpg: Output in format A6 of the file
BEY5L0NP.PDF, see
BEY5L0N1.
PS /
TXT /
PDF /
jpg
BEY5: TUB-test chart BEY5; Colour-difference formulae t* & T*
CIELABu5 triangle-lightness formulae for (Y/Yn)
absolute and relative lightness, sensitivity and contrast

Figure BEY6L0N1.jpg: Output in format A6 of the file
BEY6L0NP.PDF, see
BEY6L0N1.
PS /
TXT /
PDF /
jpg
BEY6: TUB-test chart BEY6; Colour-difference formulae t* & T*
CIELABu6 triangle-lightness formulae for (Y/Yn)
absolute and relative lightness, sensitivity and contrast
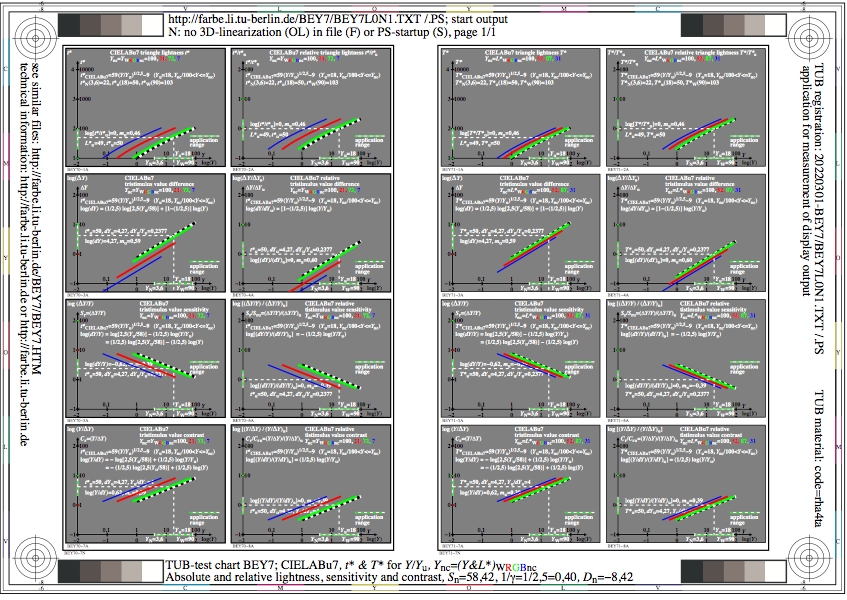
Figure BEY7L0N1.jpg: Output in format A6 of the file
BEY7L0NP.PDF, see
BEY7L0N1.
PS /
TXT /
PDF /
jpg
BEY7: TUB-test chart BEY7; Colour-difference formulae t* & T*
CIELABu7 triangle-lightness formulae for (Y/Yn)
absolute and relative lightness, sensitivity and contrast
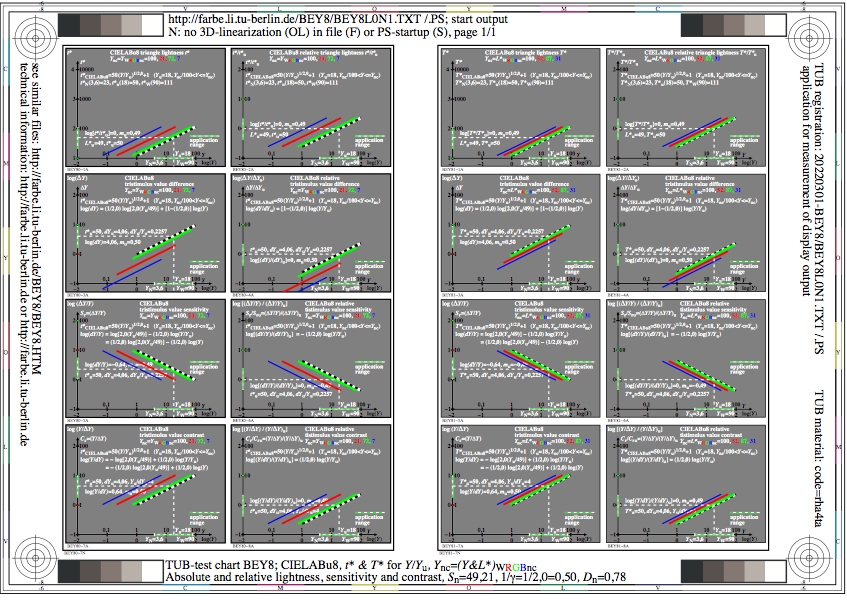
Figure BEY8L0N1.jpg: Output in format A6 of the file
BEY8L0NP.PDF, see
BEY8L0N1.
PS /
TXT /
PDF /
jpg
BEY8: TUB-test chart BEY8; Colour-difference formulae t* & T*
CIELABu8 triangle-lightness formulae for (Y/Yn)
absolute and relative lightness, sensitivity and contrast

Figure BEY9L0N1.jpg: Output in format A6 of the file
BEY9L0NP.PDF, see
BEY9L0N1.
PS /
TXT /
PDF /
jpg
BEY9: TUB-test chart BEY9; Colour-difference formulae t* & T*
CIELABu9 triangle-lightness formulae for (Y/Yn)
absolute and relative lightness, sensitivity and contrast
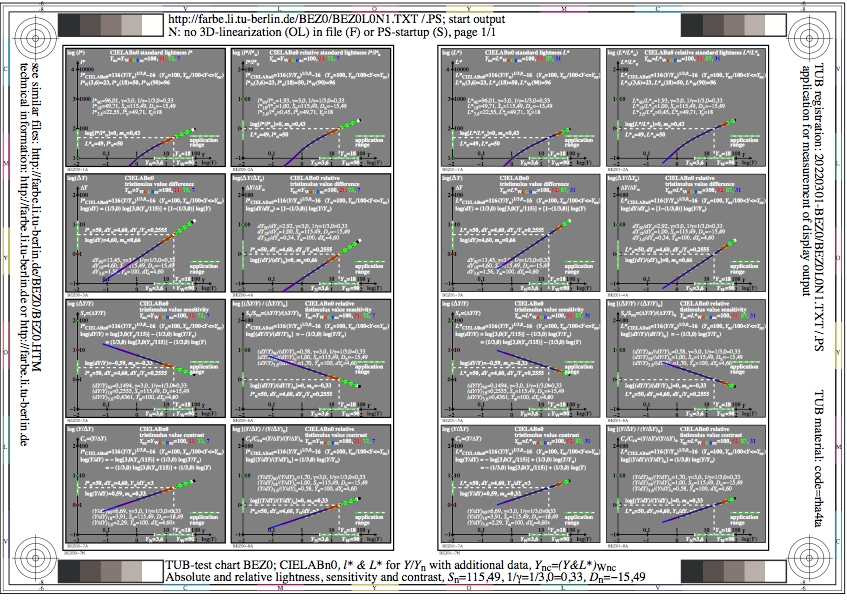
Figure BEZ0L0N1.jpg: Output in format A6 of the file
BEZ0L0NP.PDF, see
BEZ0L0N1.
PS /
TXT /
PDF /
jpg
BEZ0: TUB-test chart BEZ0; Colour-difference formulae t* & T*
CIELABn0 colour-lightness formulae for (Y/Yn)
absolute and relative lightness, sensitivity and contrast
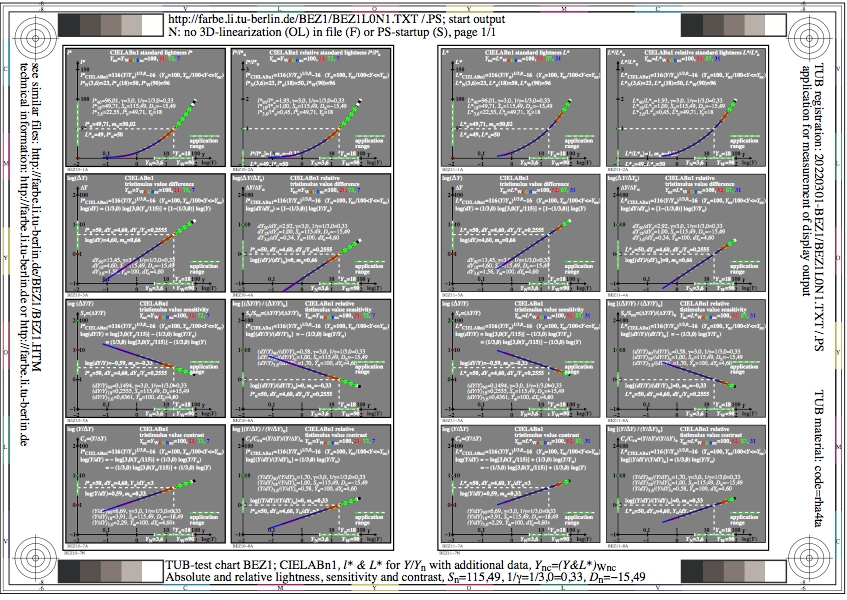
Figure BEZ1L0N1.jpg: Output in format A6 of the file
BEZ1L0NP.PDF, see
BEZ1L0N1.
PS /
TXT /
PDF /
jpg
BEZ1: TUB-test chart BEZ1; Colour-difference formulae t* & T*
CIELABn1 colour-lightness formulae for (Y/Yn)
absolute and relative lightness, sensitivity and contrast

Figure BEZ2L0N1.jpg: Output in format A6 of the file
BEZ2L0NP.PDF, see
BEZ2L0N1.
PS /
TXT /
PDF /
jpg
BEZ2: TUB-test chart BEZ2; Colour-difference formulae t* & T*
CIELABn2 triangle-lightness formulae for (Y/Yn)
absolute and relative lightness, sensitivity and contrast
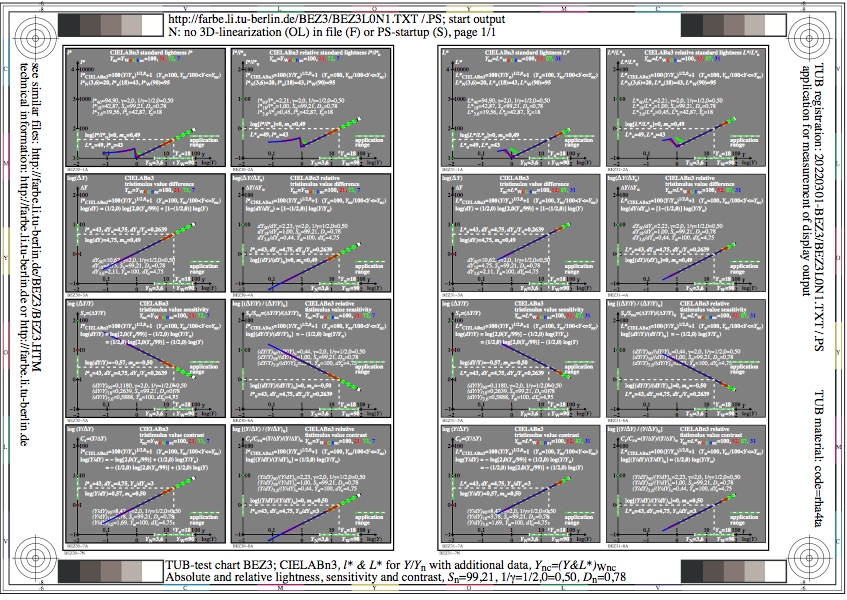
Figure BEZ3L0N1.jpg: Output in format A6 of the file
BEZ3L0NP.PDF, see
BEZ3L0N1.
PS /
TXT /
PDF /
jpg
BEZ3: TUB-test chart BEZ3; Colour-difference formulae t* & T*
CIELABn3 triangle-lightness formulae for (Y/Yn)
absolute and relative lightness, sensitivity and contrast
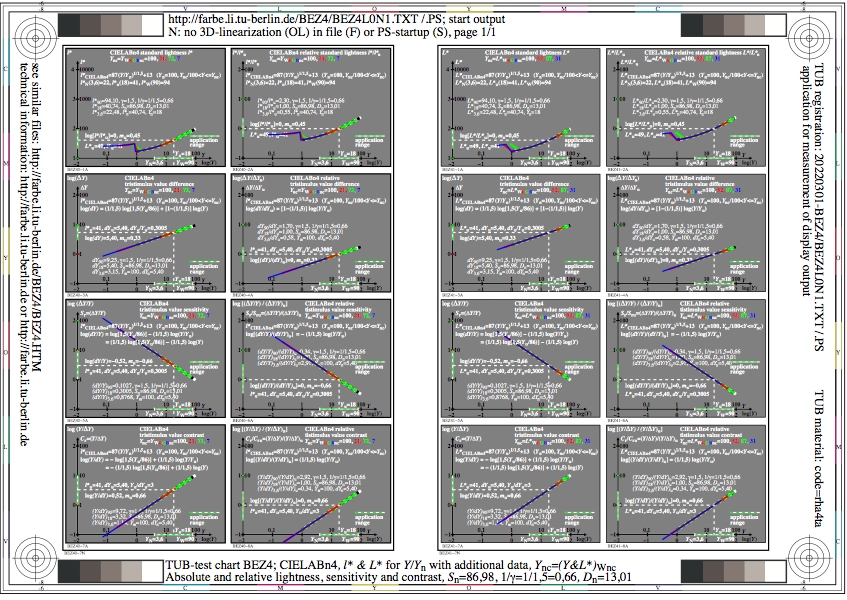
Figure BEZ4L0N1.jpg: Output in format A6 of the file
BEZ4L0NP.PDF, see
BEZ4L0N1.
PS /
TXT /
PDF /
jpg
BEZ4: TUB-test chart BEZ4; Colour-difference formulae t* & T*
CIELABn4 triangle-lightness formulae for (Y/Yn)
absolute and relative lightness, sensitivity and contrast
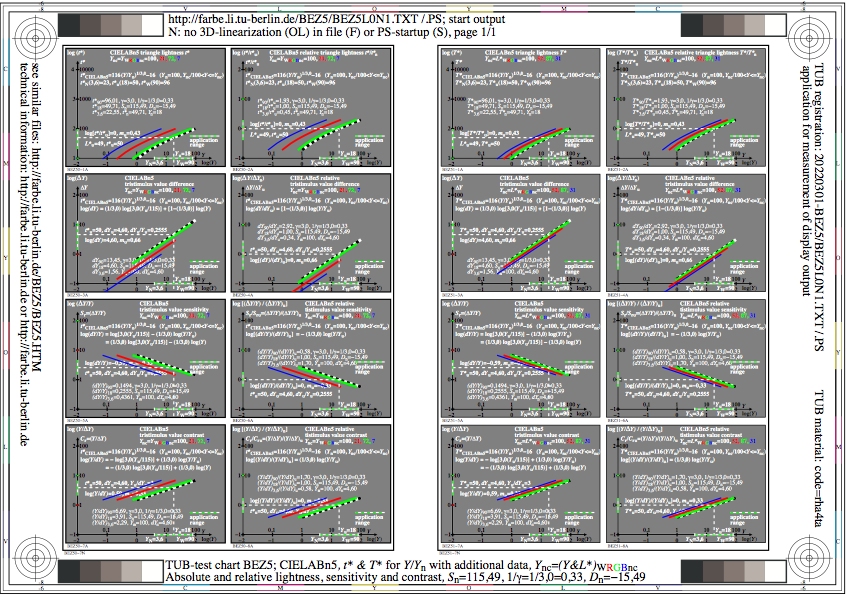
Figure BEZ5L0N1.jpg: Output in format A6 of the file
BEZ5L0NP.PDF, see
BEZ5L0N1.
PS /
TXT /
PDF /
jpg
BEZ5: TUB-test chart BEZ5; Colour-difference formulae t* & T*
CIELABn5 triangle-lightness formulae for (Y/Yn)
absolute and relative lightness, sensitivity and contrast
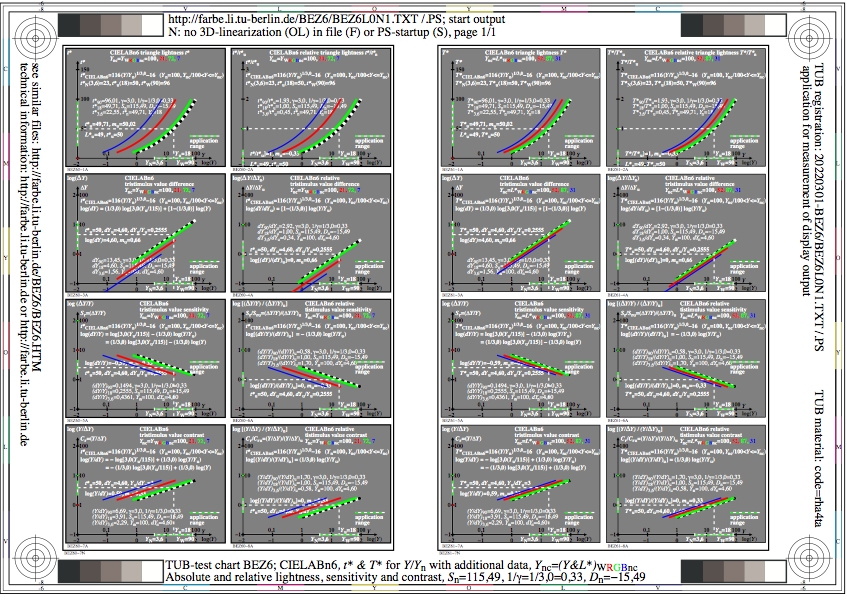
Figure BEZ6L0N1.jpg: Output in format A6 of the file
BEZ6L0NP.PDF, see
BEZ6L0N1.
PS /
TXT /
PDF /
jpg
BEZ6: TUB-test chart BEZ6; Colour-difference formulae t* & T*
CIELABn6 triangle-lightness formulae for (Y/Yn)
absolute and relative lightness, sensitivity and contrast
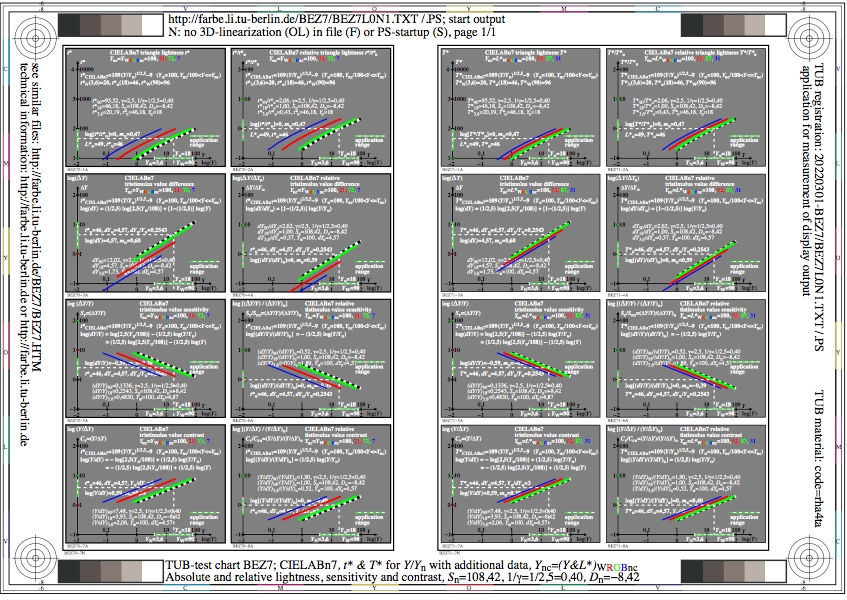
Figure BEZ7L0N1.jpg: Output in format A6 of the file
BEZ7L0NP.PDF, see
BEZ7L0N1.
PS /
TXT /
PDF /
jpg
BEZ7: TUB-test chart BEZ7; Colour-difference formulae t* & T*
CIELABn7 triangle-lightness formulae for (Y/Yn)
absolute and relative lightness, sensitivity and contrast

Figure BEZ8L0N1.jpg: Output in format A6 of the file
BEZ8L0NP.PDF, see
BEZ8L0N1.
PS /
TXT /
PDF /
jpg
BEZ8: TUB-test chart BEZ8; Colour-difference formulae t* & T*
CIELABn8 triangle-lightness formulae for (Y/Yn)
absolute and relative lightness, sensitivity and contrast
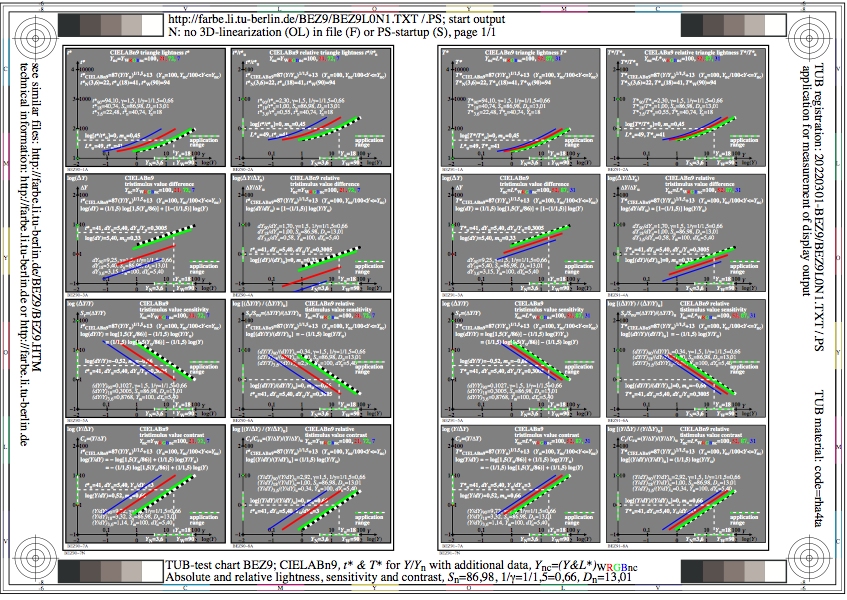
Figure BEZ9L0N1.jpg: Output in format A6 of the file
BEZ9L0NP.PDF, see
BEZ9L0N1.
PS /
TXT /
PDF /
jpg
BEZ9: TUB-test chart BEZ9; Colour-difference formulae t* & T*
CIELABn9 triangle-lightness formulae for (Y/Yn)
absolute and relative lightness, sensitivity and contrast
Section 2, Chapter B:
Colour Vision and Colorimetry (2020)
This image page with 260 image series:
be2s in English,
bg2s in German.
Previous image page:
ae2s in English,
ag2s in German.
Next image page, see
ce2s in English,
cg2s in German.
Introduction, content list and summary:
BEAI,
BEA_I,
BEA_S in English or
BGAI,
BGA_I,
BGA_S in German.
-------
For the archive information (2000-2009) of the BAM server "www.ps.bam.de"
(2000-2018)
about colour test charts, colorimetric calculations,
standards, and publications, see
indexAE.html in English,
indexAG.html in German.
Back to the main page of this TUB web site (NOT archive), see
index.html in English,
indexDE.html in German.