Figure eew0l0n1.jpg: Output in format A6 of the file eew0l0np.pdf, see
eew0l0n1. ps / txt / pdf / jpg
240215 1L2L0X0F_K2710.KTS/YEwlEIN.KTS, http://farbe.li.tu-berlin.de/eews.htm or http://color.li.tu-berlin.de/eews.htm
For links to the
Section 2, Chapter E
Colour Metrics, Differences, and Appearance (2023),
see
For this image page with 10 colour series, see
eews in English,
egws in German.
For the previous image page, see
eevs in English,
egvs in German.
For the next image page, see
eexs in English,
egxs in German.
For the first image page of the previous chapter D, see
DEAS in English,
DGAS in German.
For the first image page of the next chapter F (under work), see
feas in English,
fgas in German.
Content list of chapter E:
eea_i in English or
ega_i in German.
Summary of chapter E:
eea_s in English or
ega_s in German.
For the large image page of chapter E with 260 colour series, see
ee2s in English or
eg2s in German.
Section 2, Chapter E
Colour Metrics, Differences, and Appearance (2023),
Image part eews
The following ten pages eew0 to eew9 of this chapter
show the content with links to the single figures
in up to six formats.
Figure eew0l0n1.jpg: Output in format A6 of the file
eew0l0np.pdf, see
eew0l0n1.
ps /
txt /
pdf /
jpg
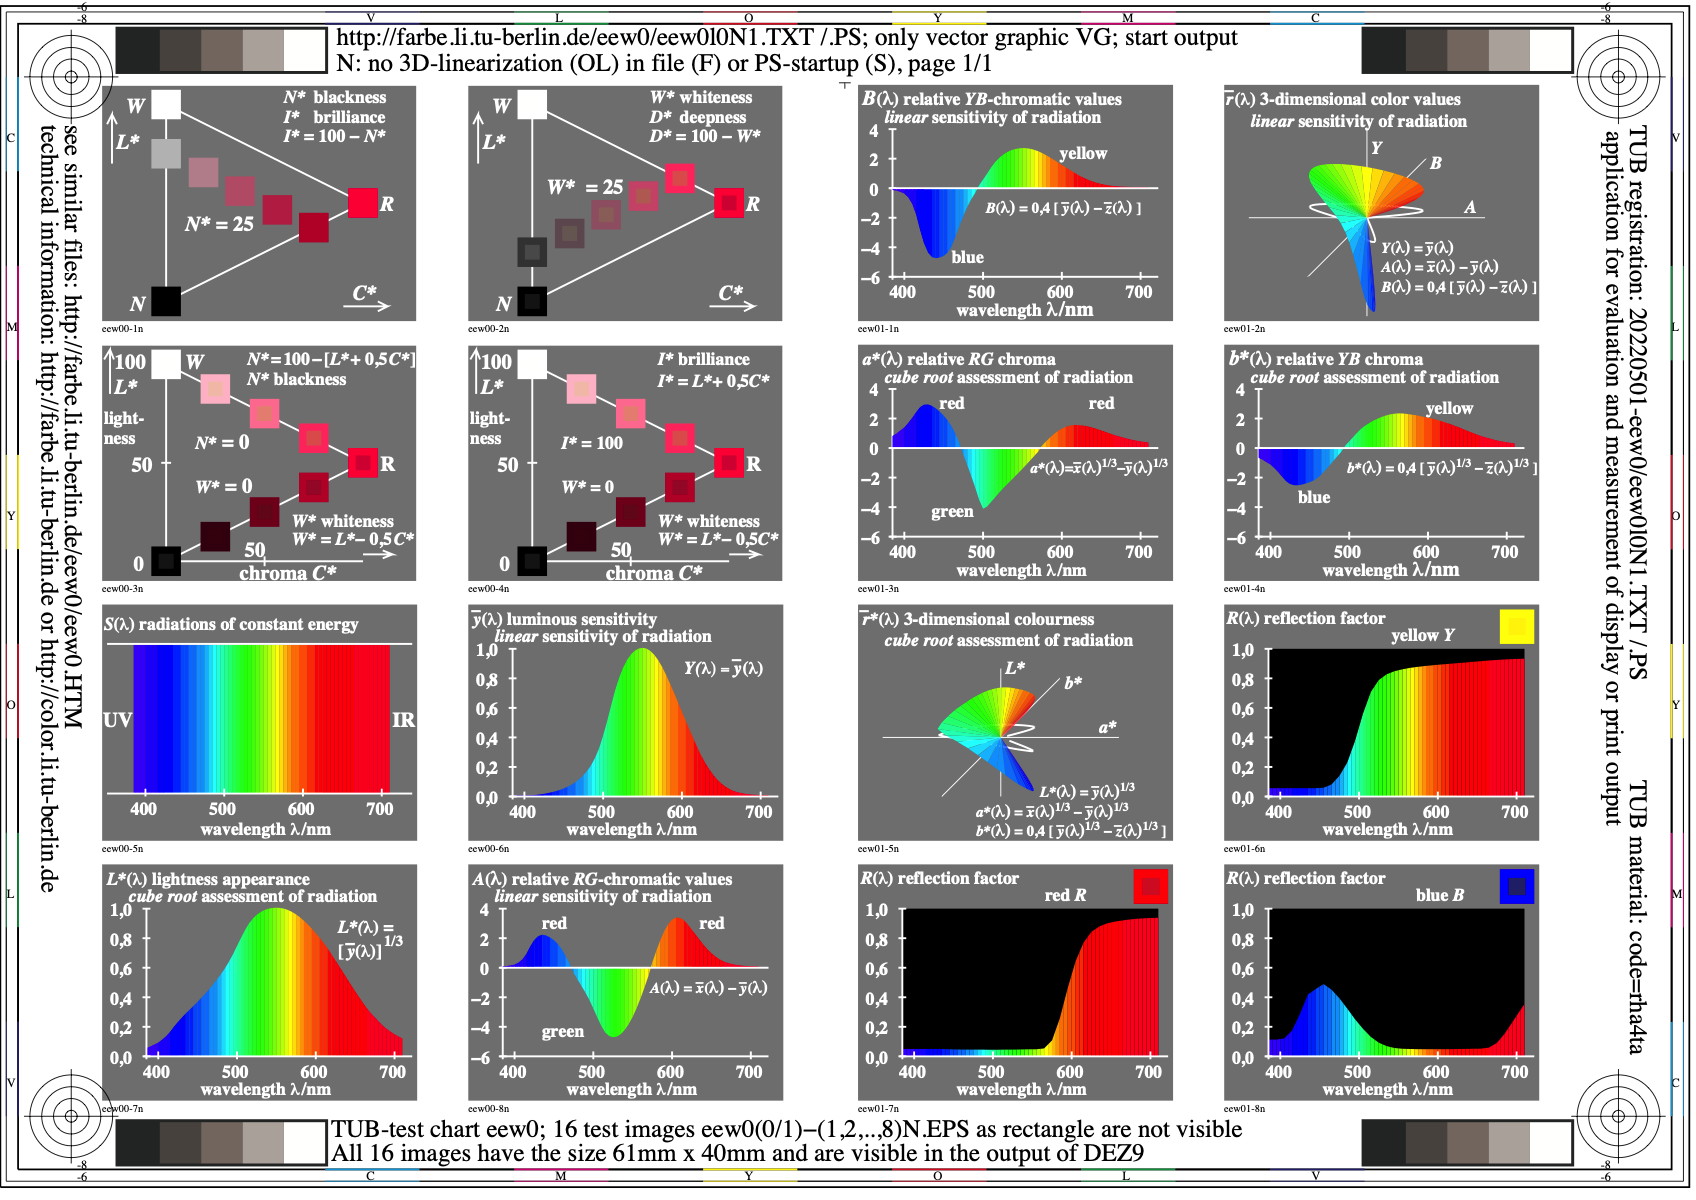
eew0: TUB-test chart eew0; Basic properties of colourimetry,
colour attributes in a hue plane, spectral luminous values,
spectral chroma, spectral reflection of surface colours
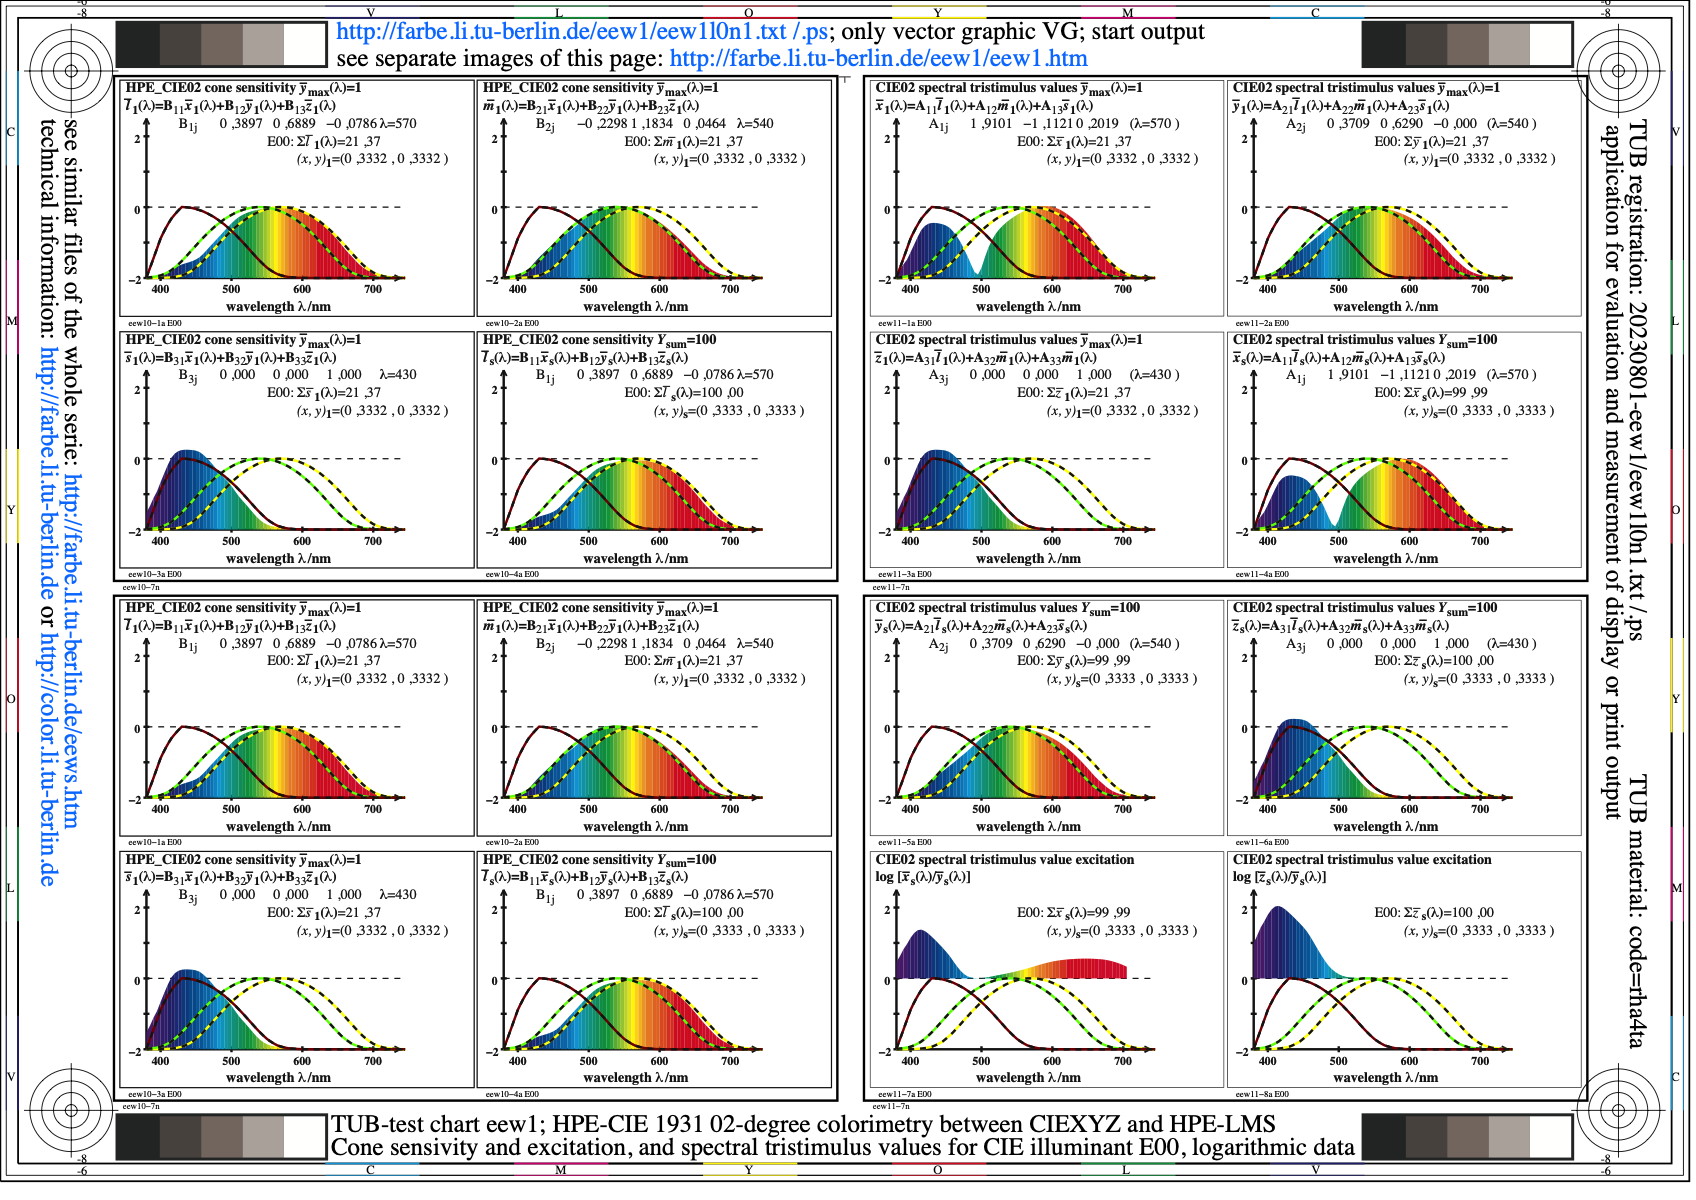
Figure eew1l0n1.jpg: Output in format A6 of the file
eew1l0np.pdf, see
eew1l0n1.
ps /
txt /
pdf /
jpg
eew1: TUB-test chart eew1; HPE-CIE 1931 02-degree colourimetry
between CIEXYZ and HPE-LMS cone sensitivity and
responce, spectral colour values for illuminant E, log data
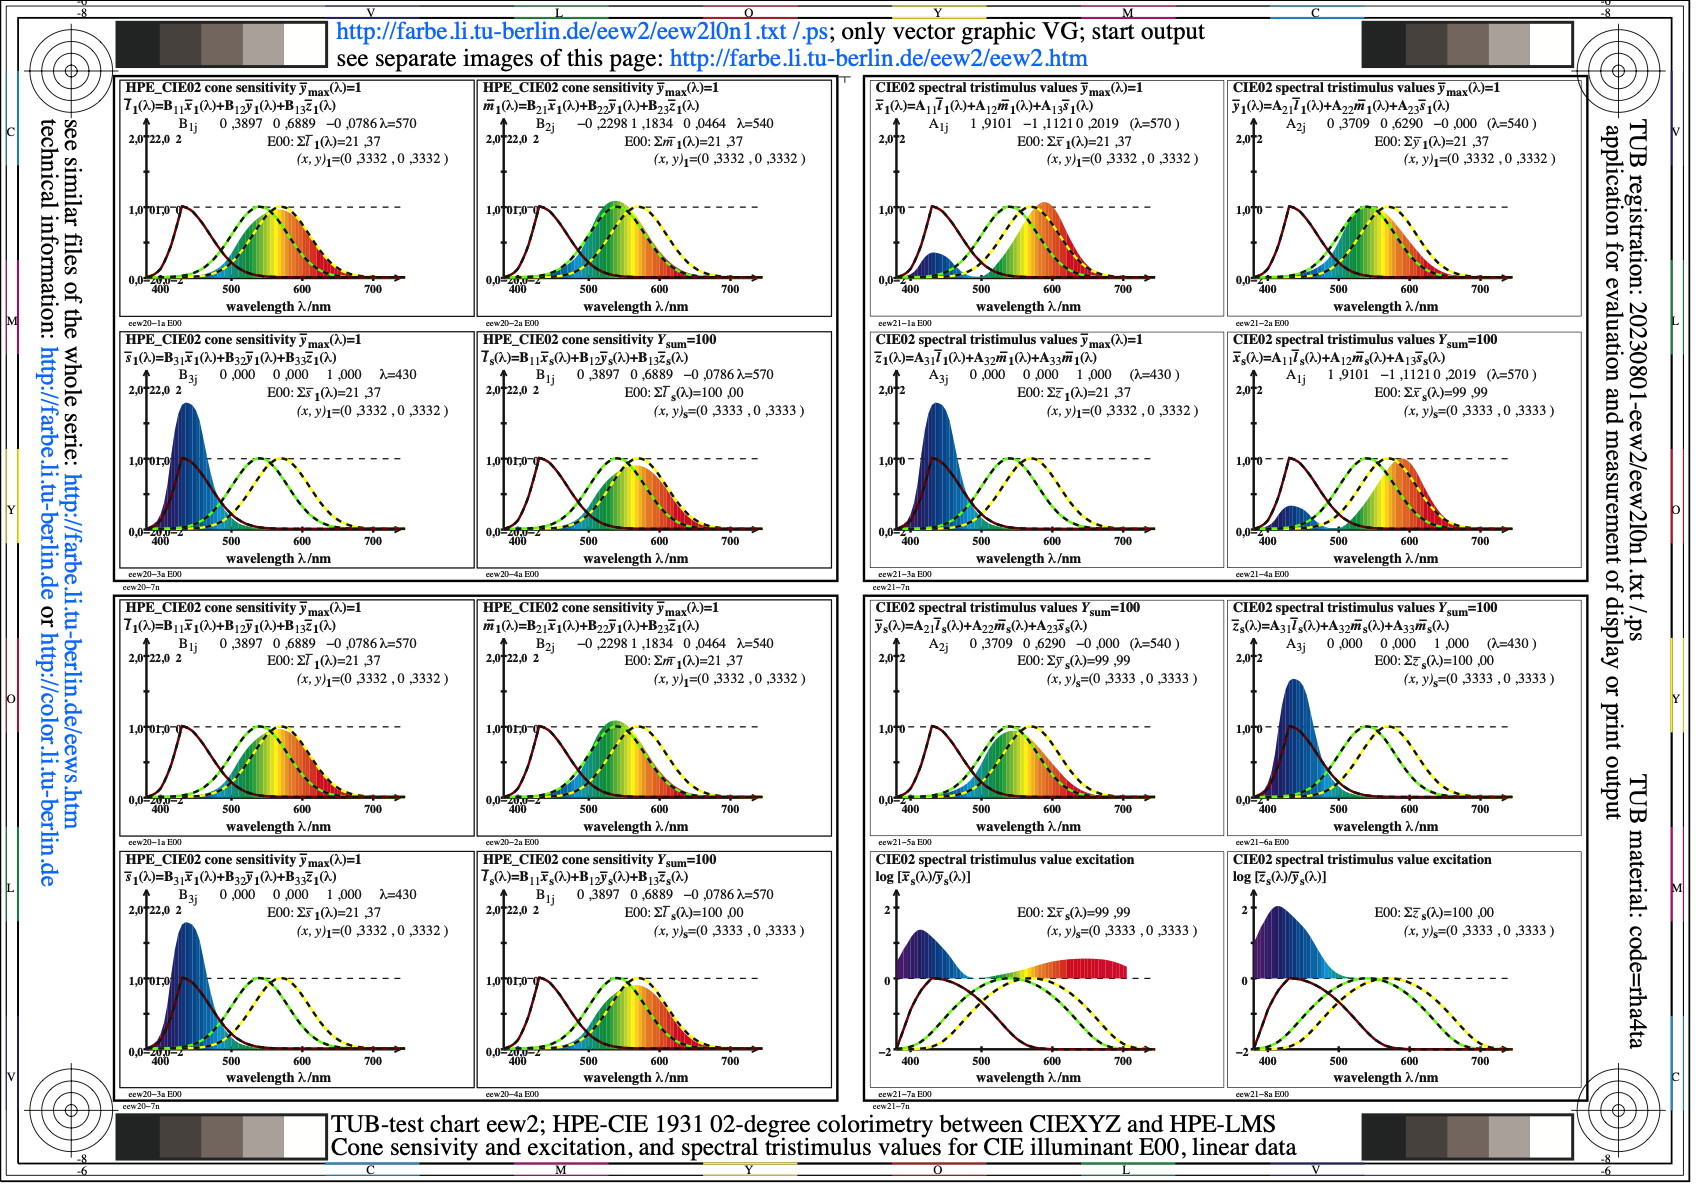
Figure eew2l0n1.jpg: Output in format A6 of the file
eew2l0np.pdf, see
eew2l0n1.
ps /
txt /
pdf /
jpg
eew2: TUB-test chart eew2; HPE-CIE 1931 02-degree colourimetry
between CIEXYZ and HPE-LMS cone sensitivity and
responce, spectral colour values for illuminant E, linear data
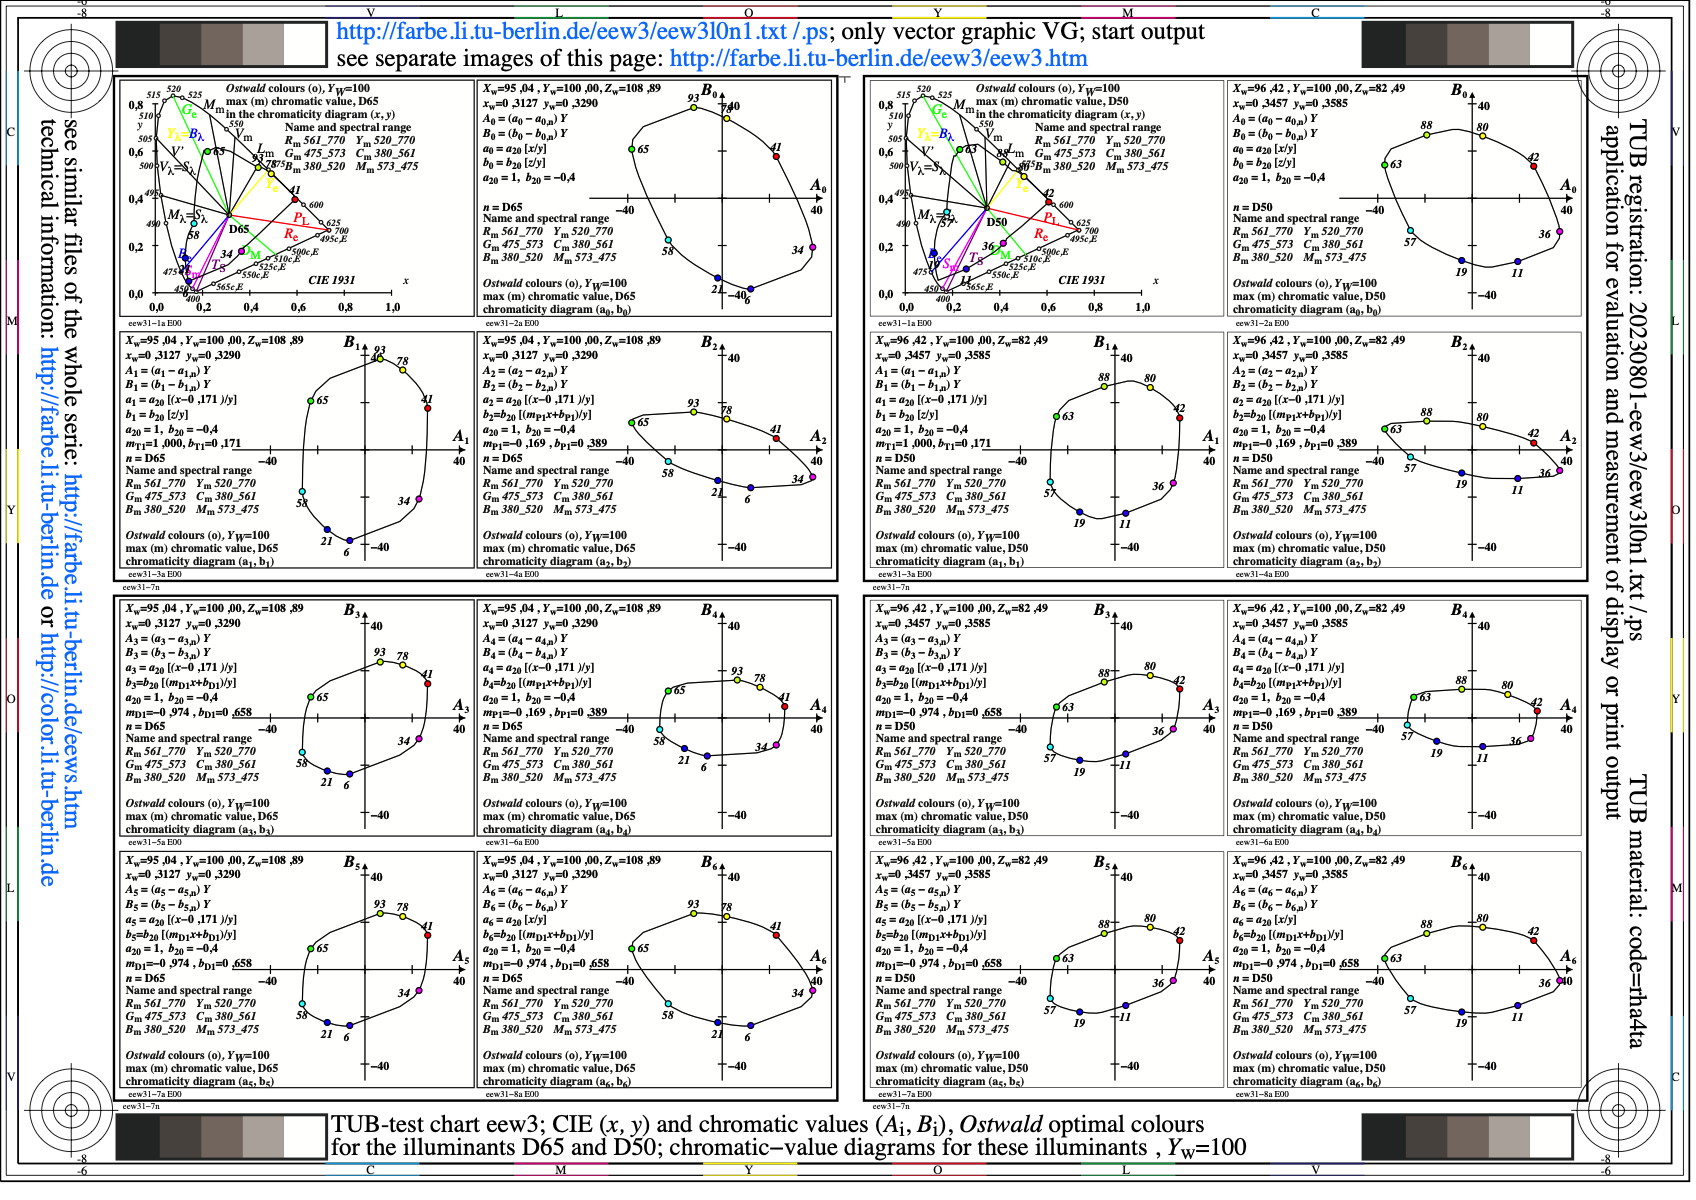
Figure eew3l0n1.jpg: Output in format A6 of the file
eew3l0np.pdf, see
eew3l0n1.
ps /
txt /
pdf /
jpg
eew3: TUB-test chart eew3; Ostwald-optimal colours in
chromaticity (x,y) and chromatic diagram (Ai, Bi)
for the standard illuminants D65 and D50, normalization Yw=100
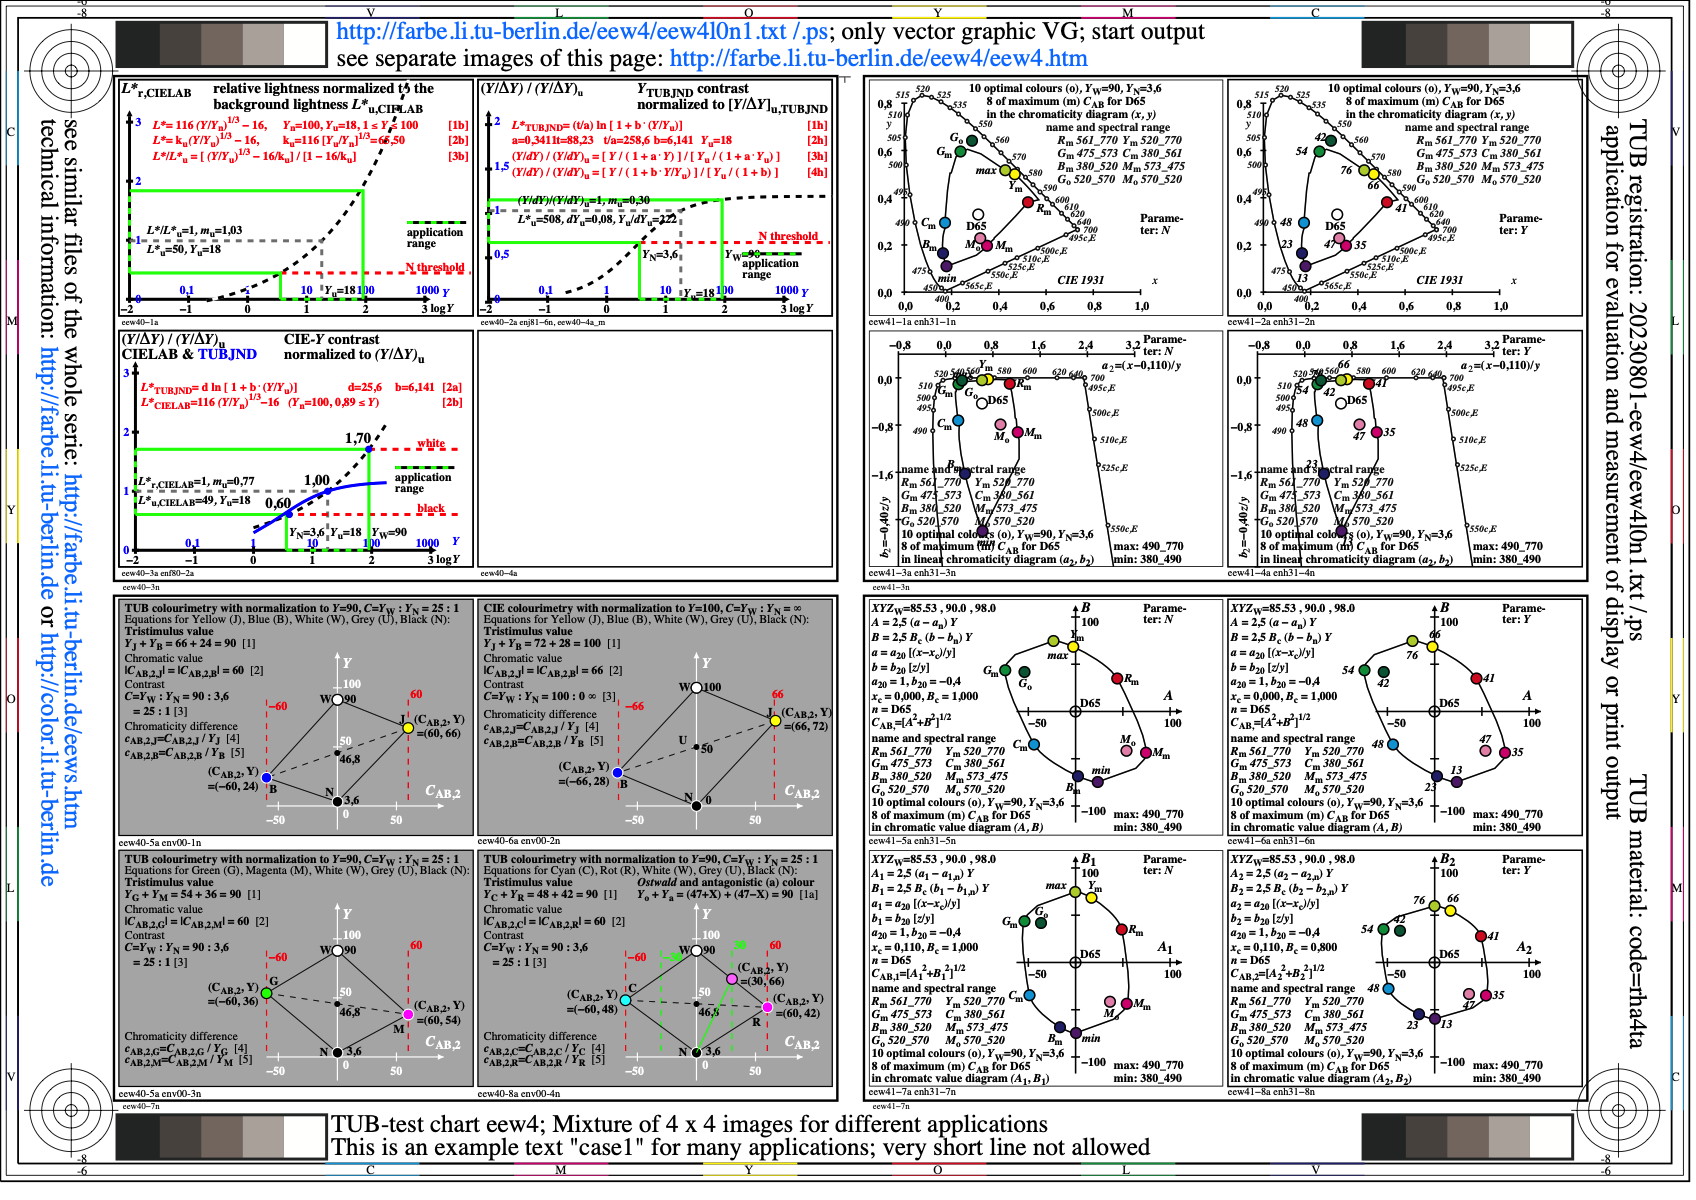
Figure eew4l0n1.jpg: Output in format A6 of the file
eew4l0np.pdf, see
eew4l0n1.
ps /
txt /
pdf /
jpg
eew4: TUB-test chart eew4; Relative lightness L*r and
threshold contrast (Y/dY)r, chromatic values of
complementary hues and of Ostwald-optimal colours
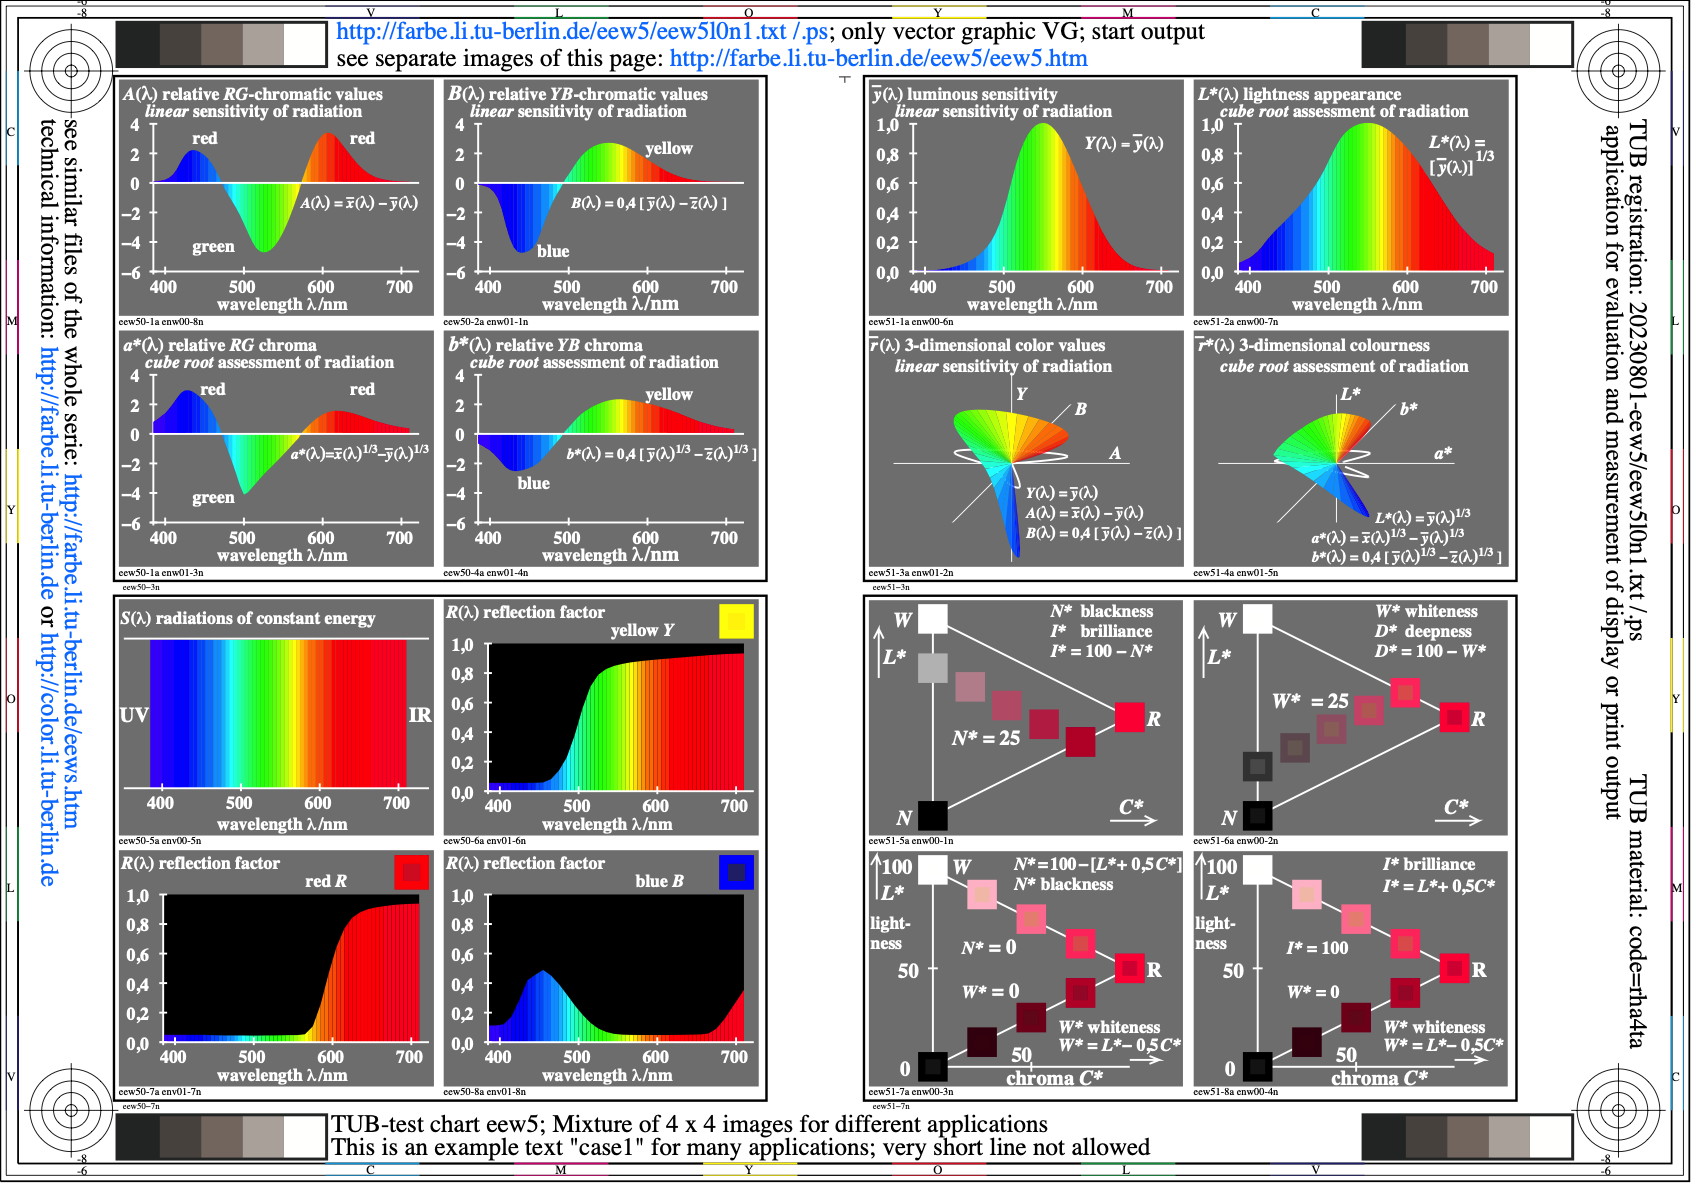
Figure eew5l0n1.jpg: Output in format A6 of the file
eew5l0np.pdf, see
eew5l0n1.
ps /
txt /
pdf /
jpg
eew5: TUB-test chart eew05; Basic properties of colourimetry,
Colour attributes in a hue plane, spectral luminous values,
spectral chroma, spectral reflection of surface colours
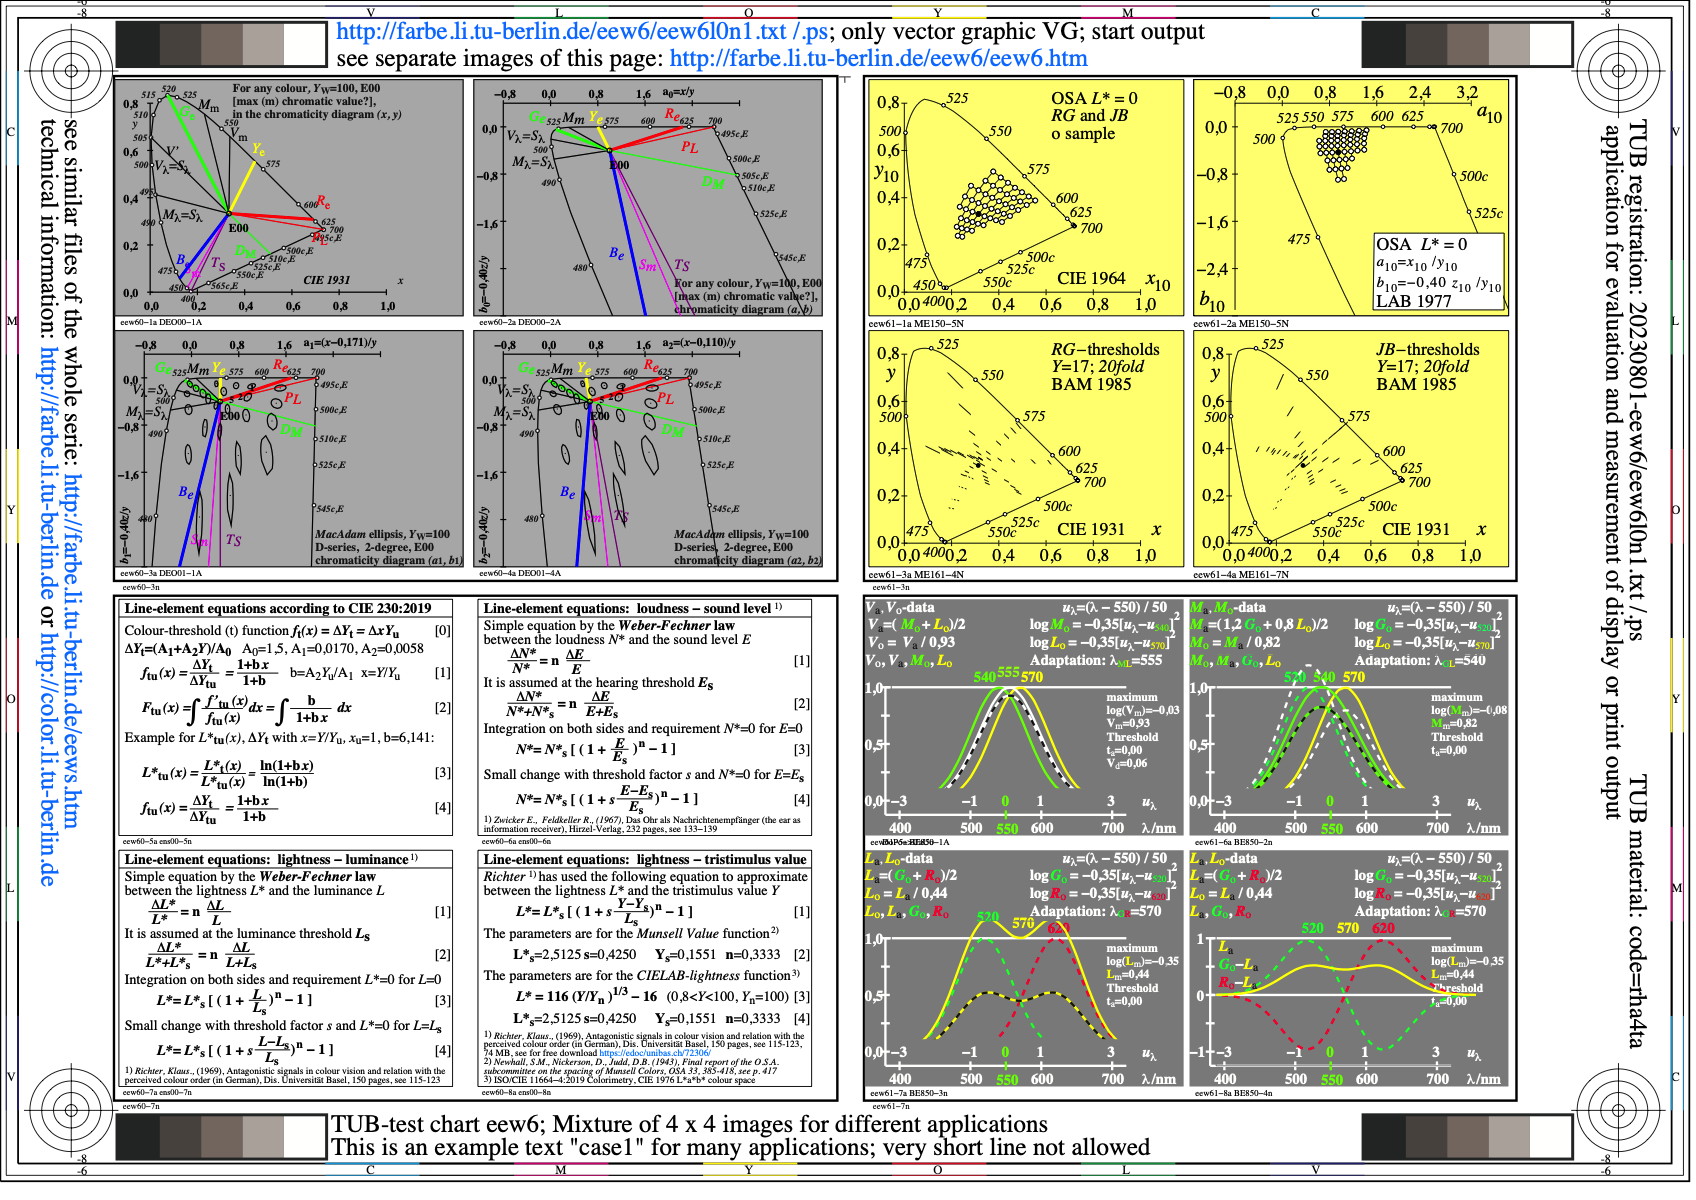
Figure eew6l0n1.jpg: Output in format A6 of the file
eew6l0np.pdf, see
eew6l0n1.
ps /
txt /
pdf /
jpg
eew6: TUB-test chart eew6; dominant wavelength of colour-vision
deficencies LMS (PDT), elementary colous (e)
line elements, OSA system and BAM-colour thresholds
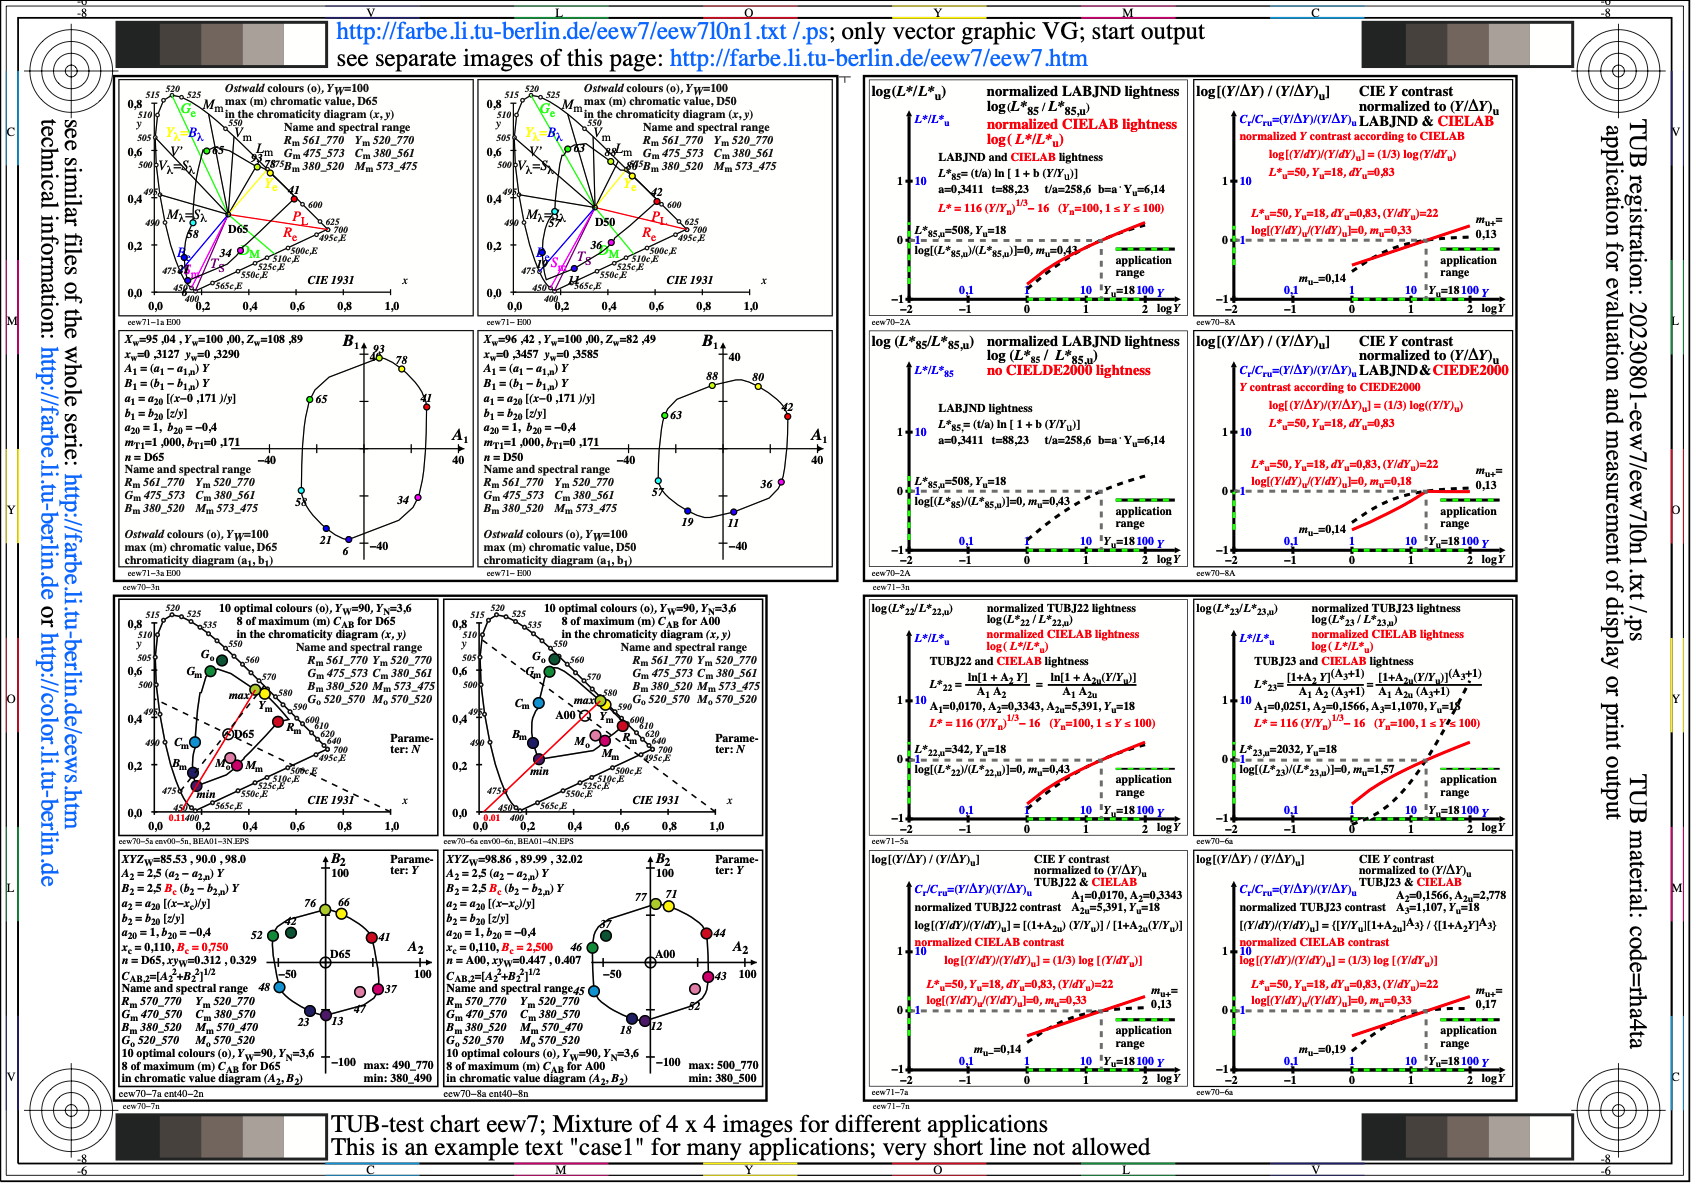
Figure eew7l0n1.jpg: Output in format A6 of the file
eew7l0np.pdf, see
eew7l0n1.
ps /
txt /
pdf /
jpg
eew7: TUB-test chart eew7; Tristimulus values Ymax and Ymin
for Ostwald colours in colour diagrams (Ai, Bi),
relative lightness L*r and relative contrast Cr
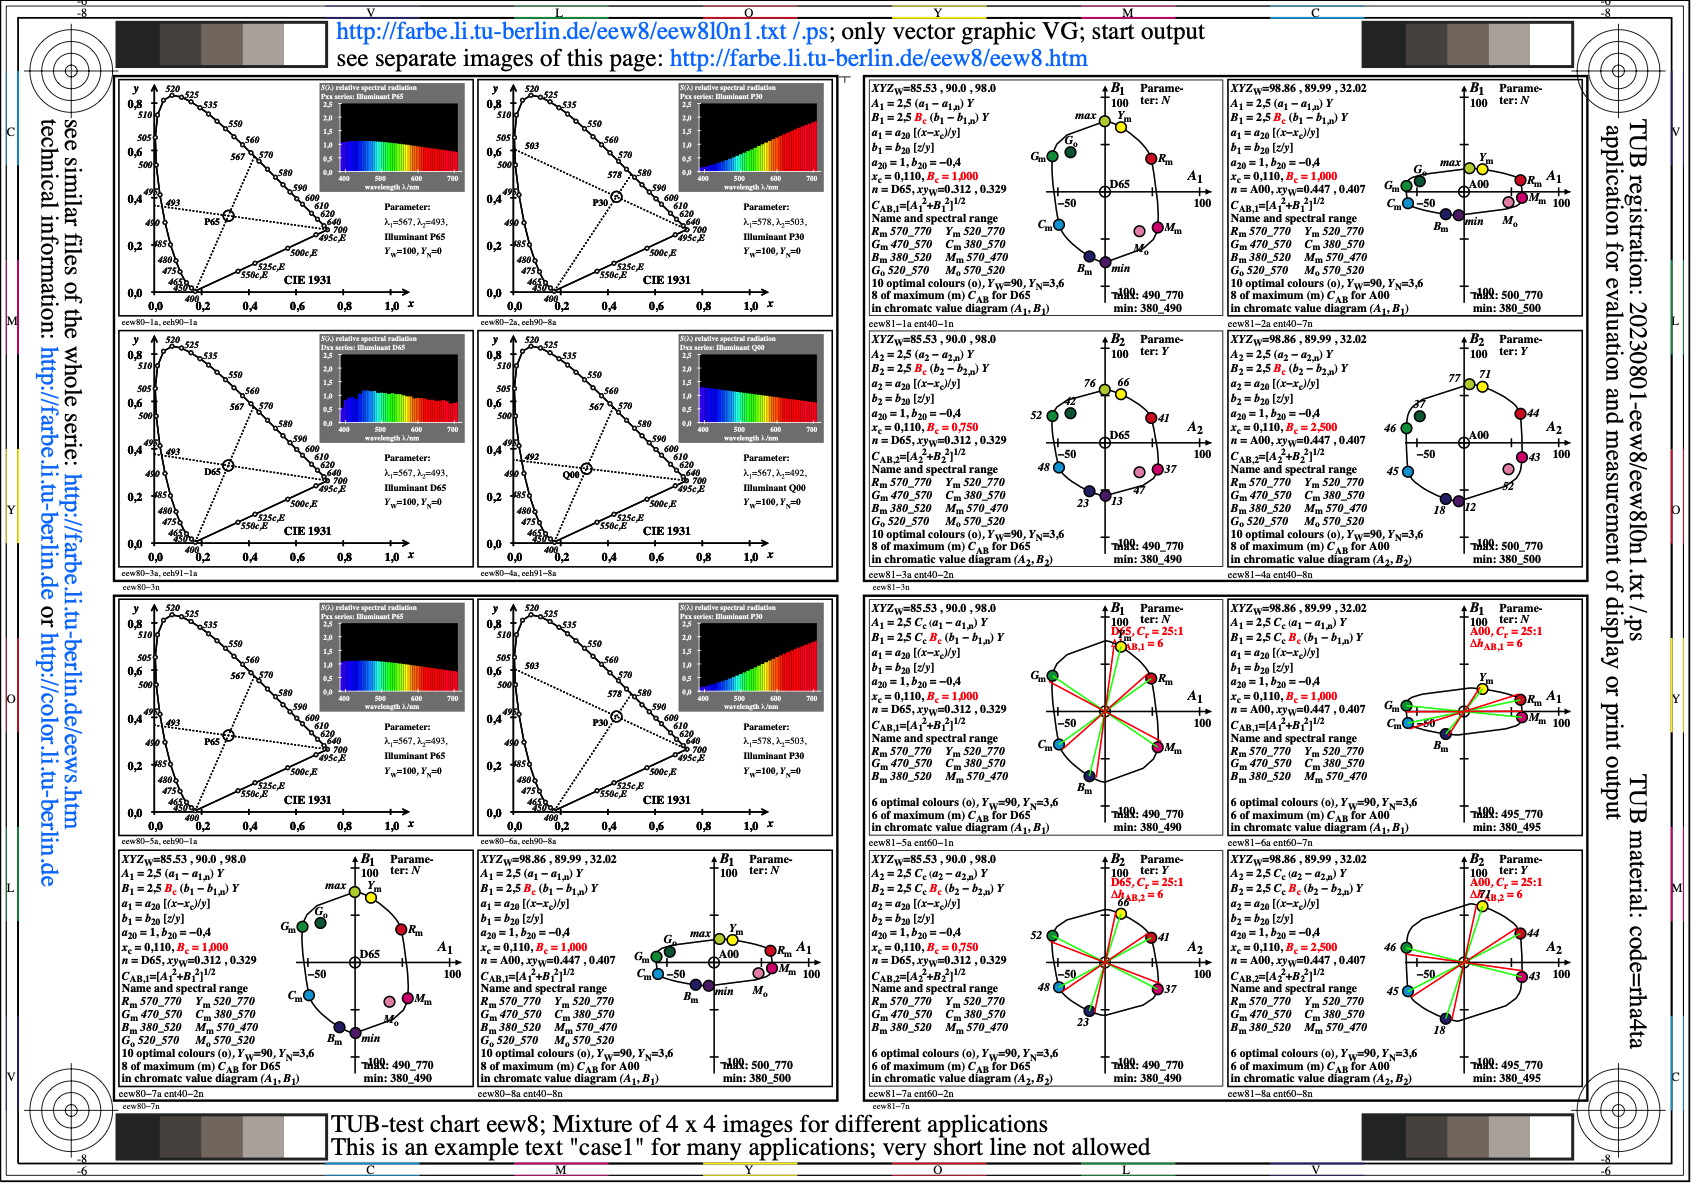
Figure eew8l0n1.jpg: Output in format A6 of the file
eew8l0np.pdf, see
eew8l0n1.
ps /
txt /
pdf /
jpg
eew8: TUB-test chart eew8; complementary wavelength
for illuminants P65, P30, D65, Q00 in chromaticity and
chromatic diagrams (Ai, Bi), normalization Yw=90
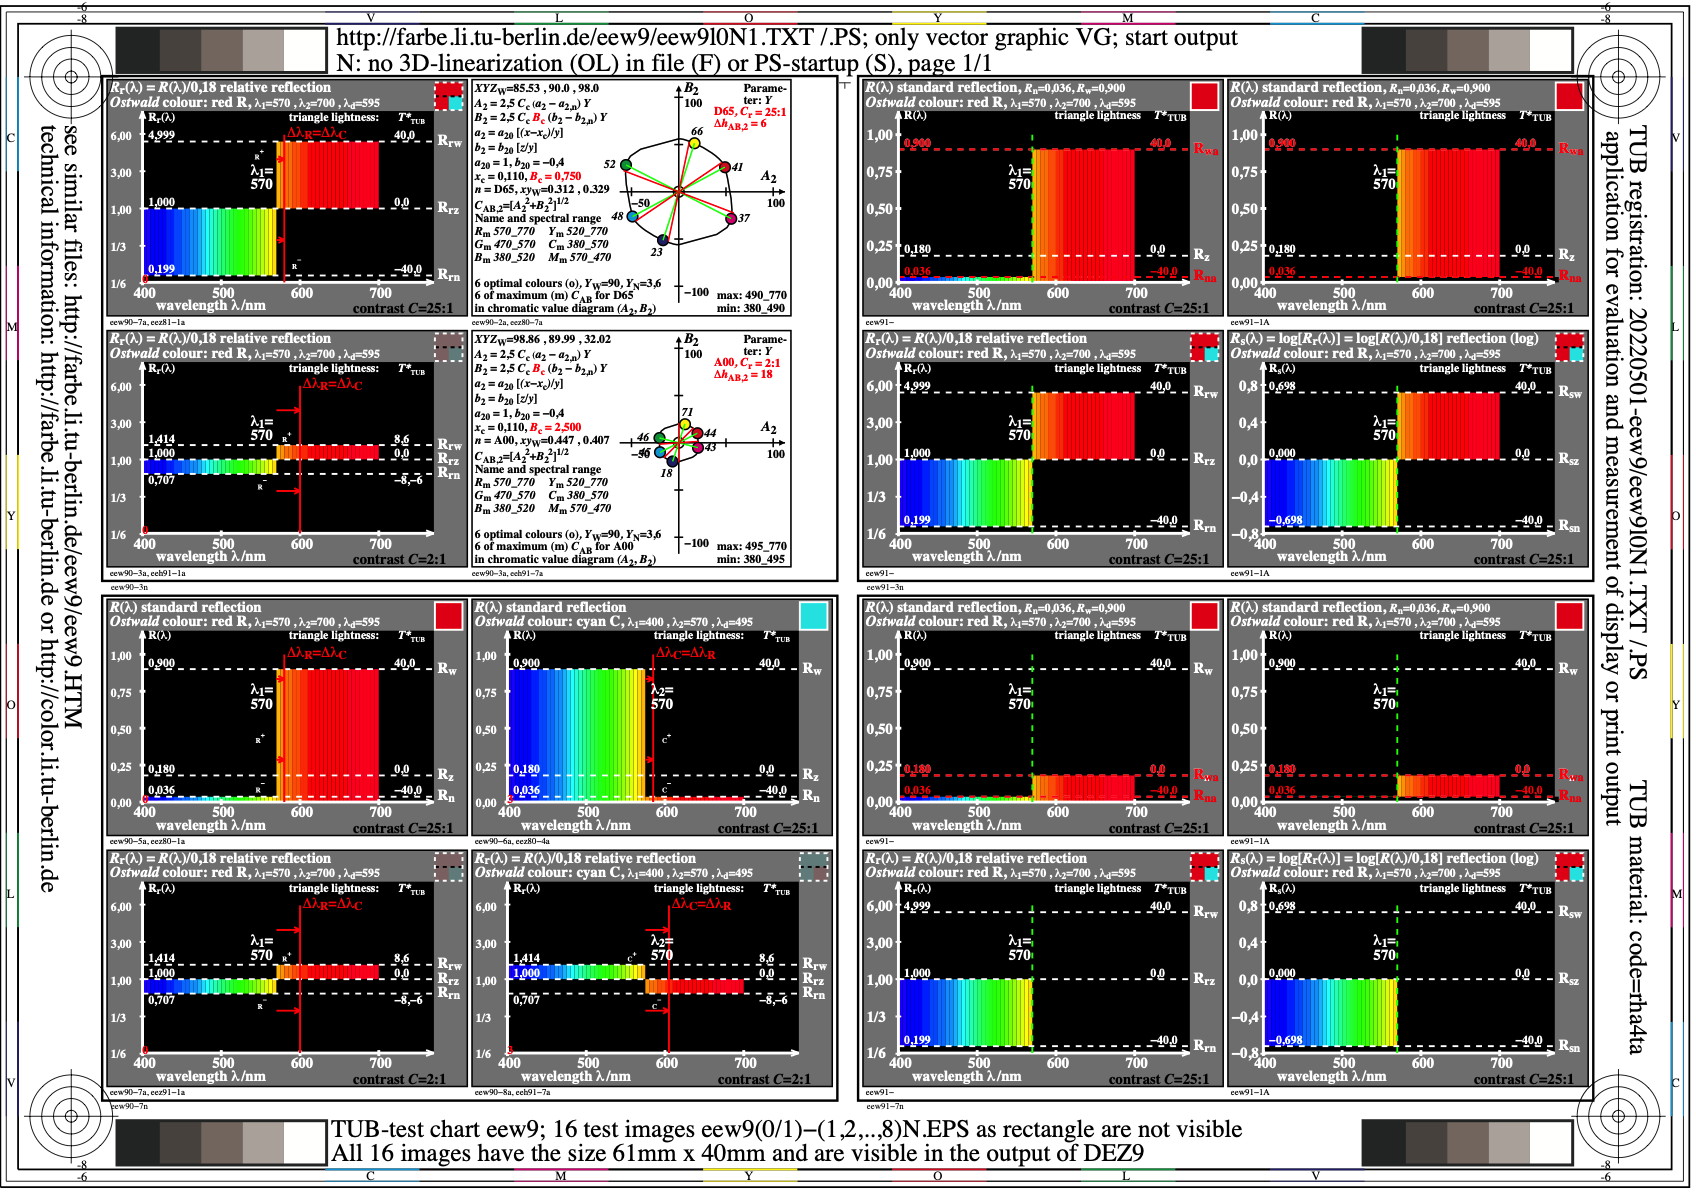
Figure eew9l0n1.jpg: Output in format A6 of the file
eew9l0np.pdf, see
eew9l0n1.
ps /
txt /
pdf /
jpg
eew9: TUB-test chart eew9; Relative reflection Rr=R/0,18
of complementary Ostwald-optimal colours red and cyan,
equal chromatic values and hue discrimination for 2 contrasts
-------
For the archive information (2000-2009) of the BAM server "www.ps.bam.de"
(2000-2018)
about colour test charts, colorimetric calculations,
standards, and publications, see
indexAE.html in English,
indexAG.html in German.
Back to the main page of this TUB web site (NOT archive), see
index.html in English,
indexDE.html in German.