
Figure iea0l0n1.jpg: Output in format A6 of the file iea0l0np.pdf, see
iea0l0n1. ps / txt / pdf / jpg
250201 1L2L0X0I_K2710.KTS/YEalHIN.KTS http://color.li.tu-berlin.de/ieas.htm or http://farbe.li.tu-berlin.de/ieas.htm
For links to the
Section 2, Chapter I
Output linearization of visual data for scaling and thresholds (2025b)
, under work, see
For this image page with 10 colour series, see
ieas in English,
igas in German.
For the previous image page, see
iezs in English,
igzs in German.
For the next image page, see
iebs in English,
igbs in German.
For the first image page of the previous chapter G, see
heas in English,
hgas in German.
For the first image page of the next chapter I (under work), see
jeas in English,
jgas in German.
Content list of chapter I (under work):
iea_i in English or
iga_i in German.
Summary of chapter I:
iea_s in English or
iga_s in German.
For the large image page of chapter I with 260 colour series, see
ie2s in English or
ig2s in German.
Section 2, Chapter I
Output linearization of visual data for scaling and thresholds (2025b),
Image part ieas
The following ten pages iea0 to iea9 of this chapter
show the content with links to the single figures
in up to six formats.
Figure iea0l0n1.jpg: Output in format A6 of the file
iea0l0np.pdf, see
iea0l0n1.
ps /
txt /
pdf /
jpg
iea0: TUB-test chart iea0; Receptor responses and lightness;
Lightness L*TUBLOG,W, L*CIELAB, L*IECsRGB;
theoretical and visual metric for SDR and HDR

Figure iea1l0n1.jpg: Output in format A6 of the file
iea1l0np.pdf, see
iea1l0n1.
ps /
txt /
pdf /
jpg
iea1: TUB-test chart iea1; CIELAB spaced 9 step grey scales
for four display reflections Yref=4, 1, 2, 100
L*N=23,7 or YN=4 and L*W=100 or YW=100, normalisation: white W

Figure iea2l0n1.jpg: Output in format A6 of the file
iea2l0np.pdf, see
iea2l0n1.
ps /
txt /
pdf /
jpg
iea2: TUB-test chart iea2; CIELAB spaced 9 step grey scales
for four display reflections Yref=4, 1, 2, 100
L*N=23,7 or YN=4 and L*W=100 or YW=100, normalisation: grey U
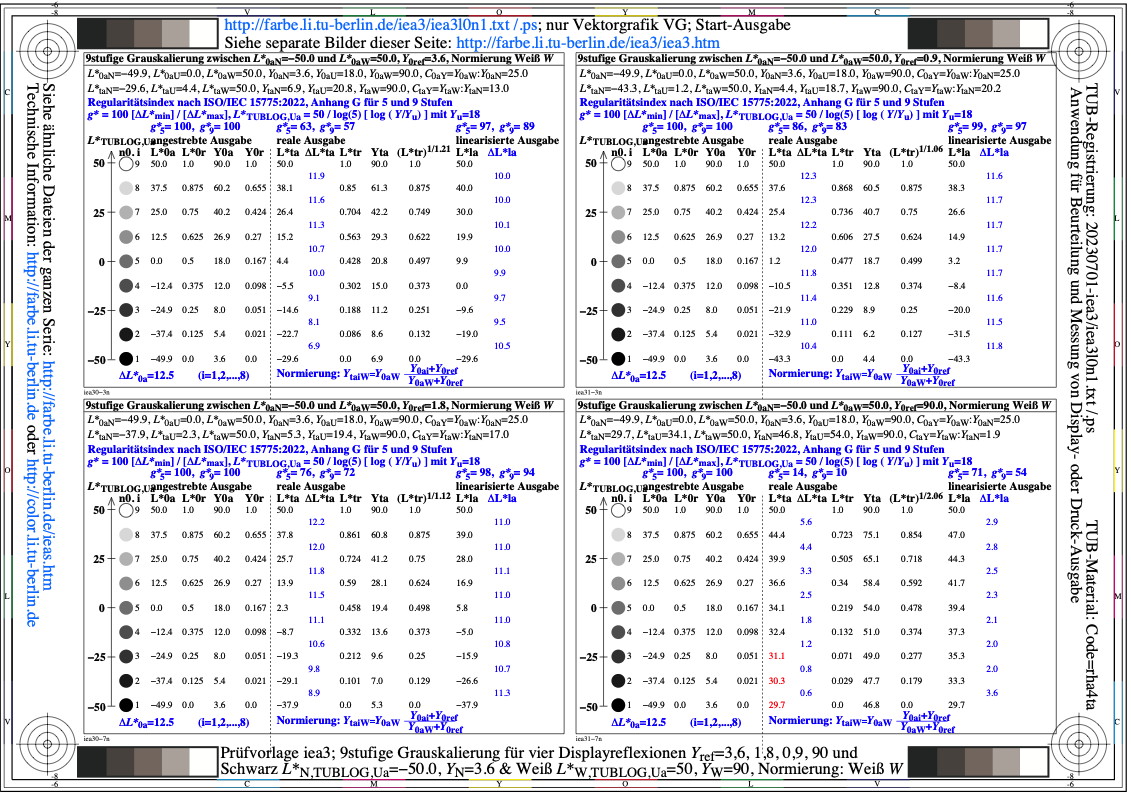
Figure iea3l0n1.jpg: Output in format A6 of the file
iea3l0np.pdf, see
iea3l0n1.
ps /
txt /
pdf /
jpg
iea3: TUB-test chart iea3; TUBLOG,Ua spaced 9 step grey scales
for four display reflections Yref=4, 1, 2, 100
L*N=-50 or YN=4 and L*W=50 or YW=100, normalisation: white W

Figure iea4l0n1.jpg: Output in format A6 of the file
iea4l0np.pdf, see
iea4l0n1.
ps /
txt /
pdf /
jpg
iea4: TUB-test chart iea4; TUBLOG,Ua spaced 9 step grey scales
for four display reflections Yref=4, 1, 2, 100
L*N=-50 or YN=4 and L*W=50 or YW=100, normalisation: grey U
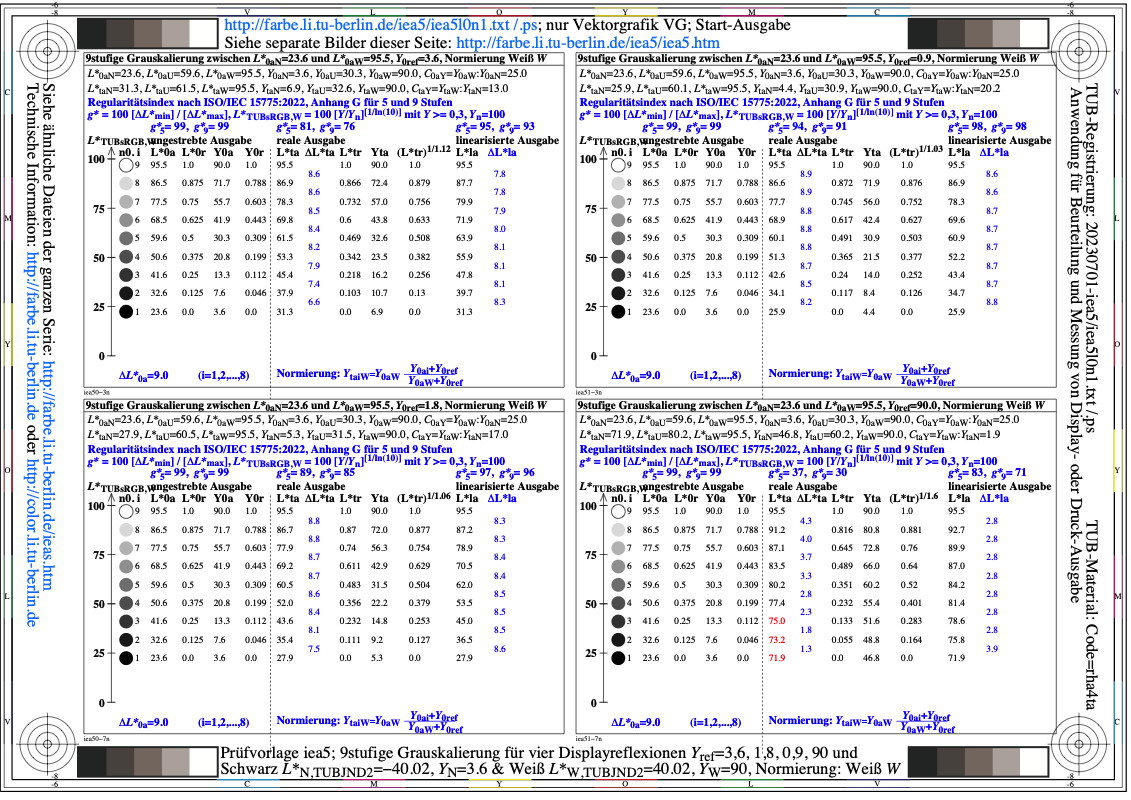
Figure iea5l0n1.jpg: Output in format A6 of the file
iea5l0np.pdf, see
iea5l0n1.
ps /
txt /
pdf /
jpg
iea5: TUB-test chart iea5; TUBsRGB,W spaced 9 step grey scales
for four display reflections Yref=4, 1, 2, 100
L*N=24,7 or YN=4 and L*W=100 or YW=100, normalisation: white W
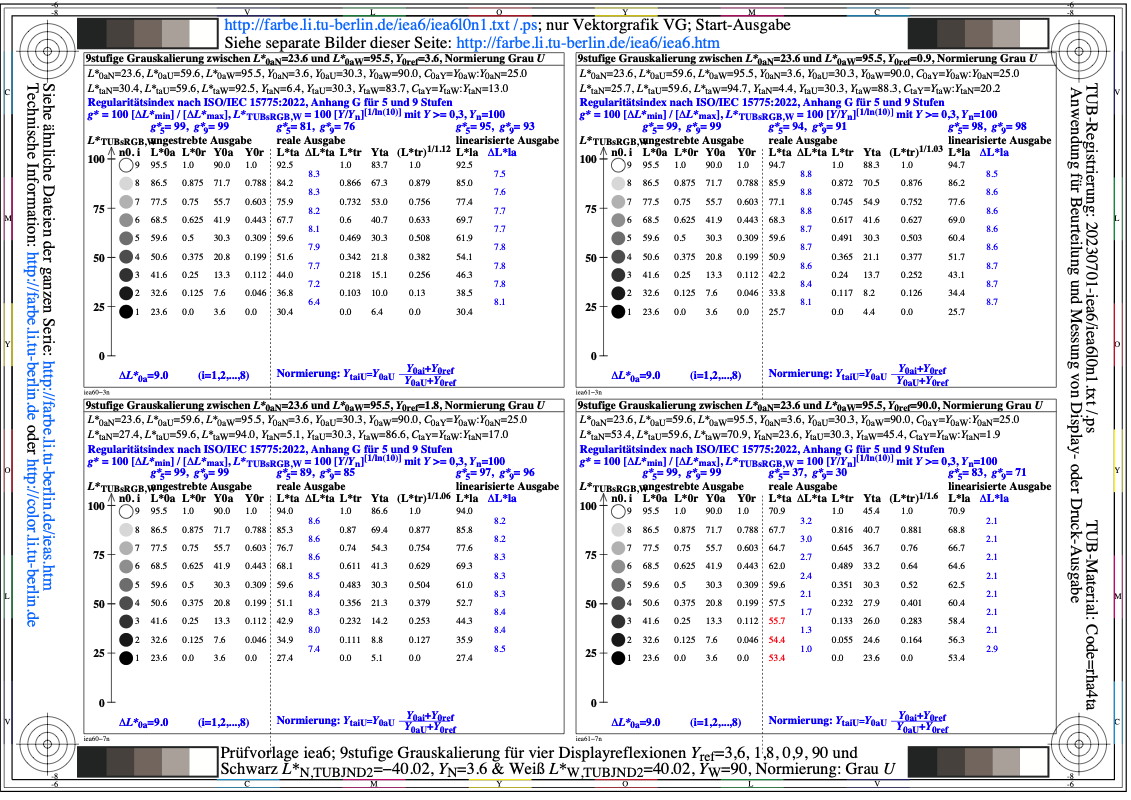
Figure iea6l0n1.jpg: Output in format A6 of the file
iea6l0np.pdf, see
iea6l0n1.
ps /
txt /
pdf /
jpg
iea6: TUB-test chart iea6; TUBsRGB,W spaced 9 step grey scales
for four display reflections Yref=4, 1, 2, 100
L*N=24,7 or YN=4 and L*W=100 or YW=100, normalisation: grey U

Figure iea7l0n1.jpg: Output in format A6 of the file
iea7l0np.pdf, see
iea7l0n1.
ps /
txt /
pdf /
jpg
iea7: TUB-test chart iea7; adjacent and separate grey colours
Evaluation (e) of scaling, g(rel)=0,67; output linearization
and threshold for colour series Black N - White W

Figure iea8l0n1.jpg: Output in format A6 of the file
iea8l0np.pdf, see
iea8l0n1.
ps /
txt /
pdf /
jpg
iea8: TUB-test chart iea8; 5&9&16 steps P2-W and W-N, with image,
Flower motif range W-N for SDR displays in pixel graphics,
display reflection according to ISO 9241-306, g_rel=1,000
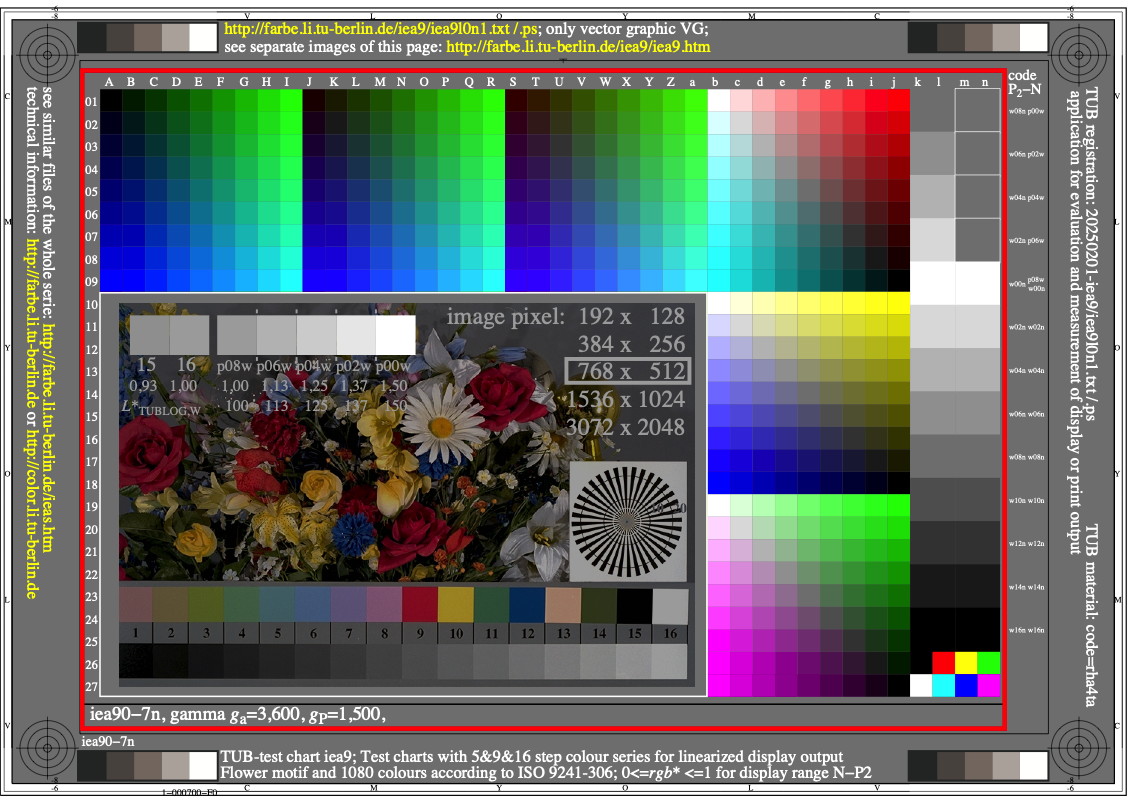
Figure iea9l0n1.jpg: Output in format A6 of the file
iea9l0np.pdf, see
iea9l0n1.
ps /
txt /
pdf /
jpg
iea9: TUB-test chart iea9; 5&9&16 steps P2-W and W-N, with image,
Flower image range P2_N for HDR displays in pixel graphics,
display reflection according to ISO 9241-306, g_rel=1,000
-------
For the archive information (2000-2009) of the BAM server "www.ps.bam.de"
(2000-2018)
about colour test charts, colorimetric calculations,
standards, and publications, see
indexAE.html in English,
indexAG.html in German.
Back to the main page of this TUB web site (NOT archive), see
index.html in English,
indexDE.html in German.