
Image iea0l0n1.jpg: Output in format A6 of the file iea0l0np.pdf, see
iea0l0n1. ps / txt / pdf / jpg
Section 2, Chapter I:
Output linearization of visual data for scaling and thresholds (2025b),
under work
This image page with 260 image series:
ie2s in English,
ig2s in German.
Previous image page:
he2s in English,
hg2s in German.
Next image page, see
je2s in English,
jg2s in German.
Introduction, content list and summary:
ieai,
iea_i,
iea_s in English or
igai,
iga_i,
iga_s in German.
Section 2: Colourimetry, Colour Vision and Applications for Colour
Image Technology (2019-2025), Image part ie2s
under development
Chapter I: Output linearization of visual data for scaling nd thresholds
(2025b), under work
The following 260 image series between iea0 and iez9
show the content with links to the single figures
in up to six formats.
Image iea0l0n1.jpg: Output in format A6 of the file
iea0l0np.pdf, see
iea0l0n1.
ps /
txt /
pdf /
jpg
iea0: TUB-test chart iea0; Receptor responses and lightness;
Lightness L*TUBLOG,W, L*CIELAB, L*IECsRGB;
theoretical and visual metric for SDR and HDR

Image iea1l0n1.jpg: Output in format A6 of the file
iea1l0np.pdf, see
iea1l0n1.
ps /
txt /
pdf /
jpg
iea1: TUB-test chart iea1; CIELAB spaced 9 step grey scales
for four display reflections Yref=4, 1, 2, 100
L*N=23,7 or YN=4 and L*W=100 or YW=100, normalisation: white W

Image iea2l0n1.jpg: Output in format A6 of the file
iea2l0np.pdf, see
iea2l0n1.
ps /
txt /
pdf /
jpg
iea2: TUB-test chart iea2; CIELAB spaced 9 step grey scales
for four display reflections Yref=4, 1, 2, 100
L*N=23,7 or YN=4 and L*W=100 or YW=100, normalisation: grey U
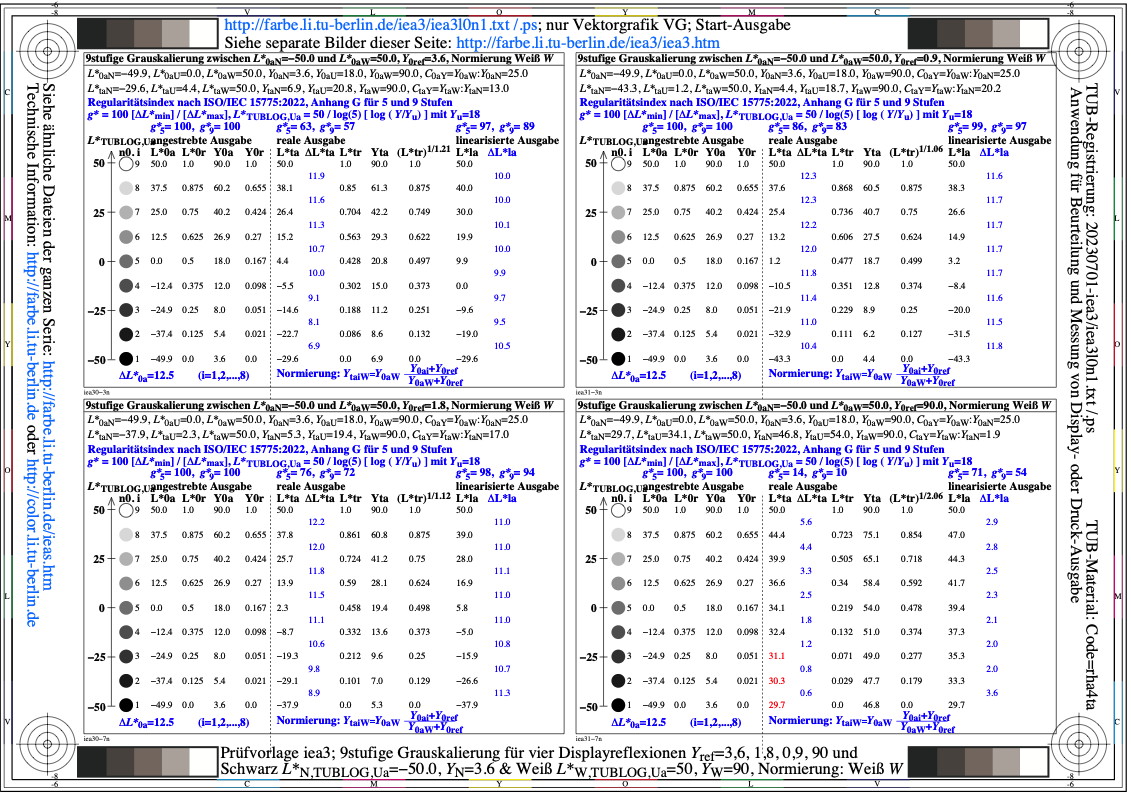
Image iea3l0n1.jpg: Output in format A6 of the file
iea3l0np.pdf, see
iea3l0n1.
ps /
txt /
pdf /
jpg
iea3: TUB-test chart iea3; TUBLOG,Ua spaced 9 step grey scales
for four display reflections Yref=4, 1, 2, 100
L*N=-50 or YN=4 and L*W=50 or YW=100, normalisation: white W

Image iea4l0n1.jpg: Output in format A6 of the file
iea4l0np.pdf, see
iea4l0n1.
ps /
txt /
pdf /
jpg
iea4: TUB-test chart iea4; TUBLOG,Ua spaced 9 step grey scales
for four display reflections Yref=4, 1, 2, 100
L*N=-50 or YN=4 and L*W=50 or YW=100, normalisation: grey U
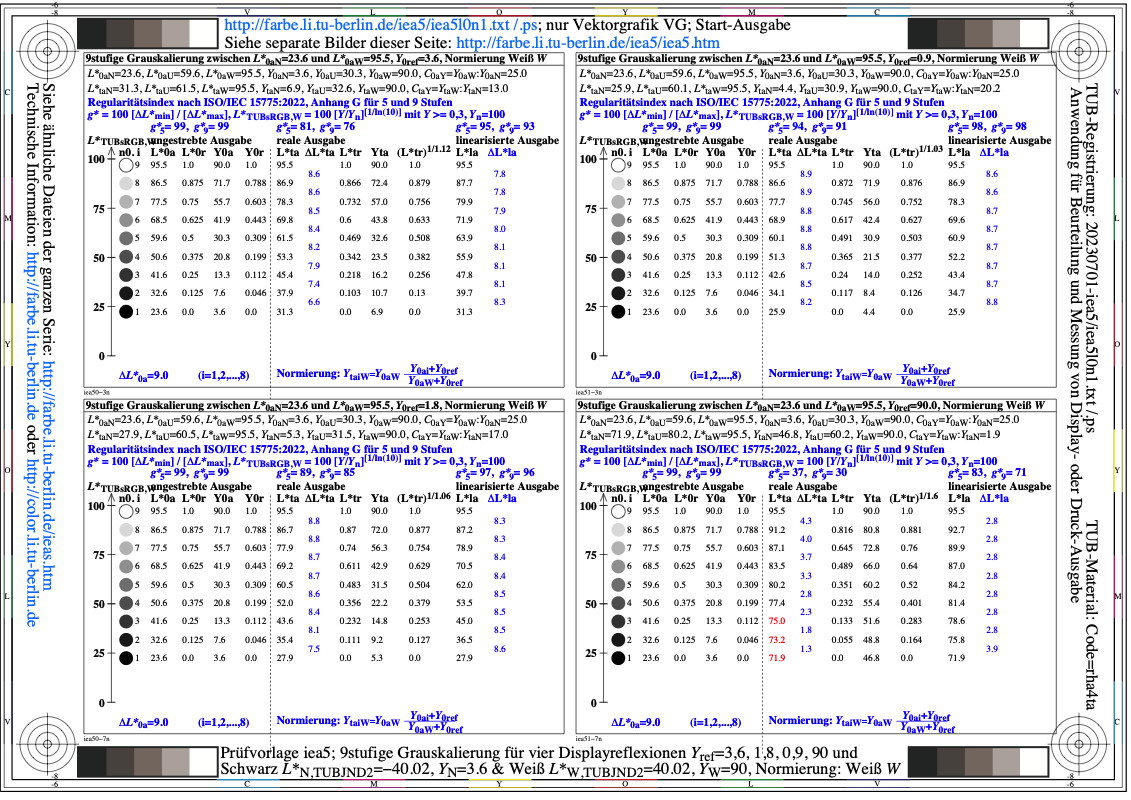
Image iea5l0n1.jpg: Output in format A6 of the file
iea5l0np.pdf, see
iea5l0n1.
ps /
txt /
pdf /
jpg
iea5: TUB-test chart iea5; TUBsRGB,W spaced 9 step grey scales
for four display reflections Yref=4, 1, 2, 100
L*N=24,7 or YN=4 and L*W=100 or YW=100, normalisation: white W
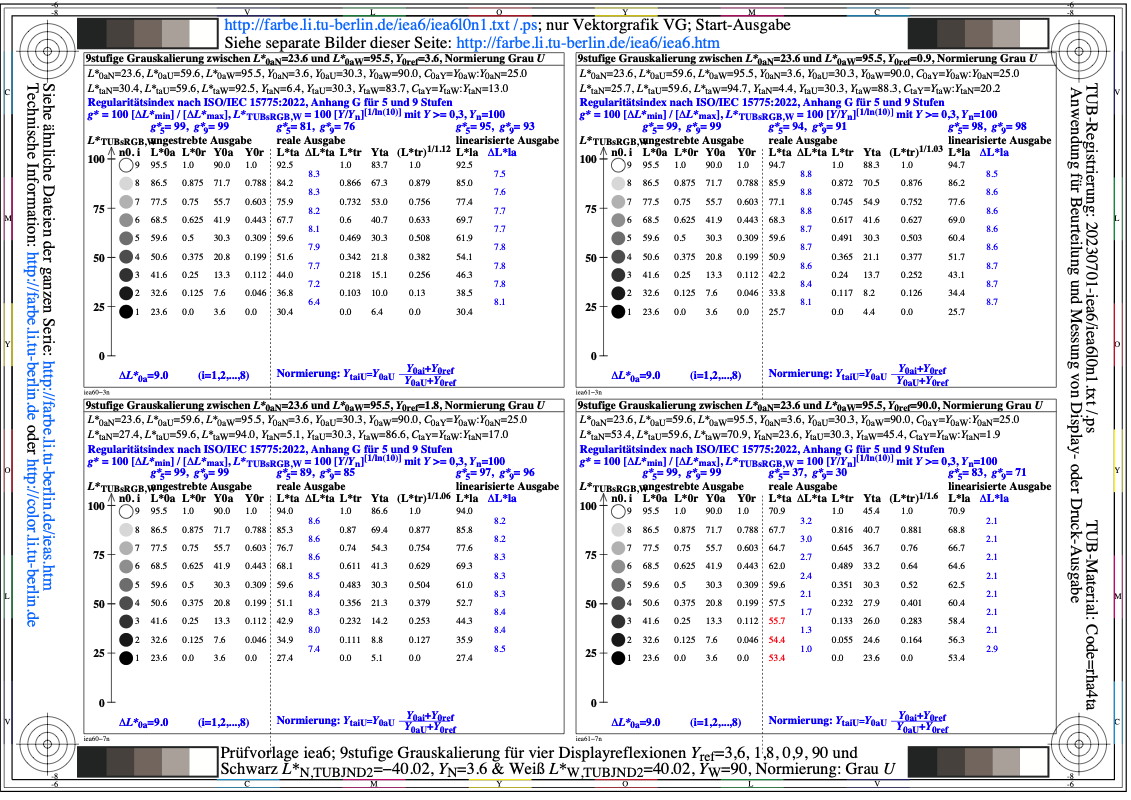
Image iea6l0n1.jpg: Output in format A6 of the file
iea6l0np.pdf, see
iea6l0n1.
ps /
txt /
pdf /
jpg
iea6: TUB-test chart iea6; TUBsRGB,W spaced 9 step grey scales
for four display reflections Yref=4, 1, 2, 100
L*N=24,7 or YN=4 and L*W=100 or YW=100, normalisation: grey U

Image iea7l0n1.jpg: Output in format A6 of the file
iea7l0np.pdf, see
iea7l0n1.
ps /
txt /
pdf /
jpg
iea7: TUB-test chart iea7; adjacent and separate grey colours
Evaluation (e) of scaling, g(rel)=0,67; output linearization
and threshold for colour series Black N - White W

Image iea8l0n1.jpg: Output in format A6 of the file
iea8l0np.pdf, see
iea8l0n1.
ps /
txt /
pdf /
jpg
iea8: TUB-test chart iea8; 5&9&16 steps P2-W and W-N, with image,
Flower motif range W-N for SDR displays in pixel graphics,
display reflection according to ISO 9241-306, g_rel=1,000
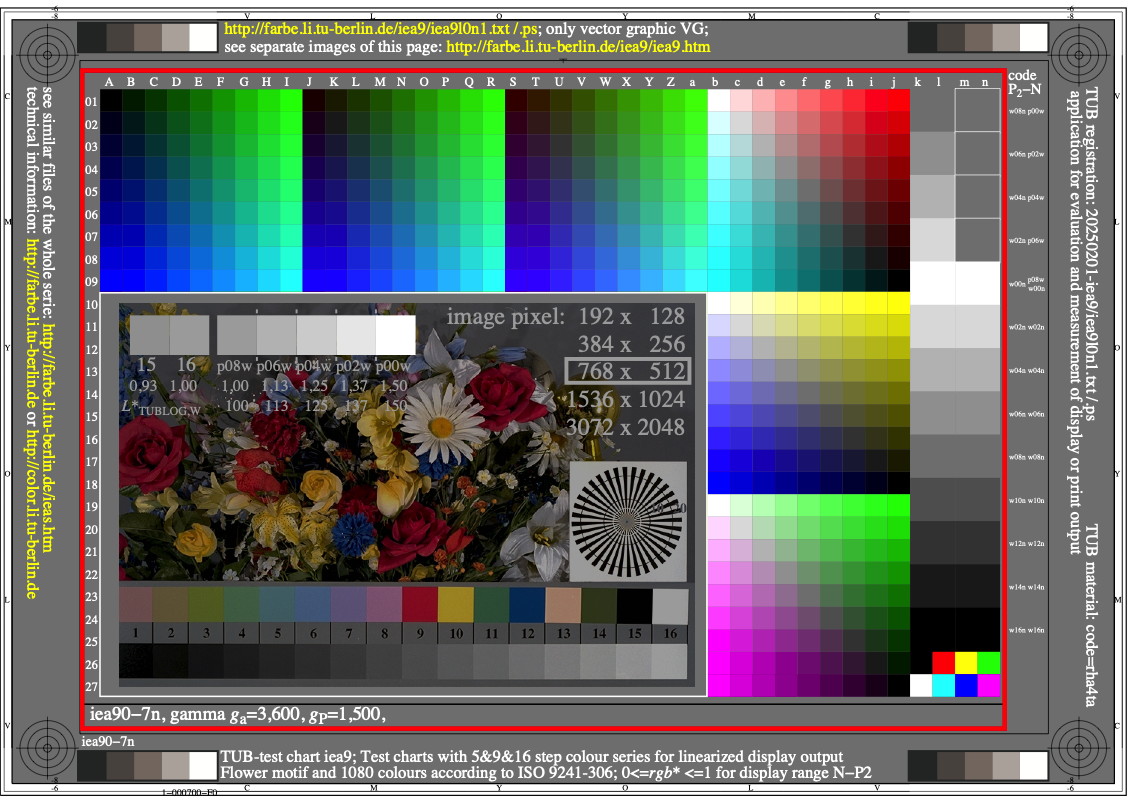
Image iea9l0n1.jpg: Output in format A6 of the file
iea9l0np.pdf, see
iea9l0n1.
ps /
txt /
pdf /
jpg
iea9: TUB-test chart iea9; 5&9&16 steps P2-W and W-N, with image,
Flower image range P2_N for HDR displays in pixel graphics,
display reflection according to ISO 9241-306, g_rel=1,000
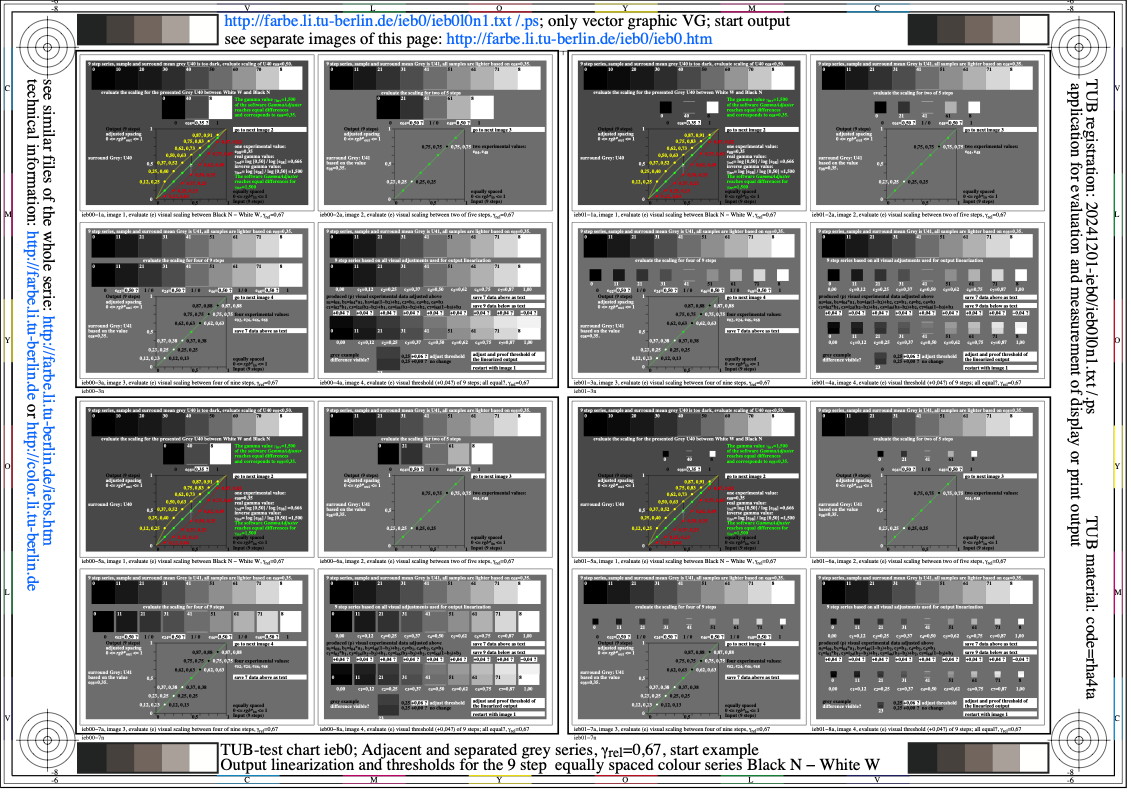
Image ieb0l0n1.jpg: Output in format A6 of the file
ieb0l0np.pdf, see
ieb0l0n1.
ps /
txt /
pdf /
jpg
ieb0: TUB-test chart ieb0; adjacent and separate grey colours
Evaluation (e) of scaling, g(rel)=0,67; output linearization
and threshold for colour series Black N - White W
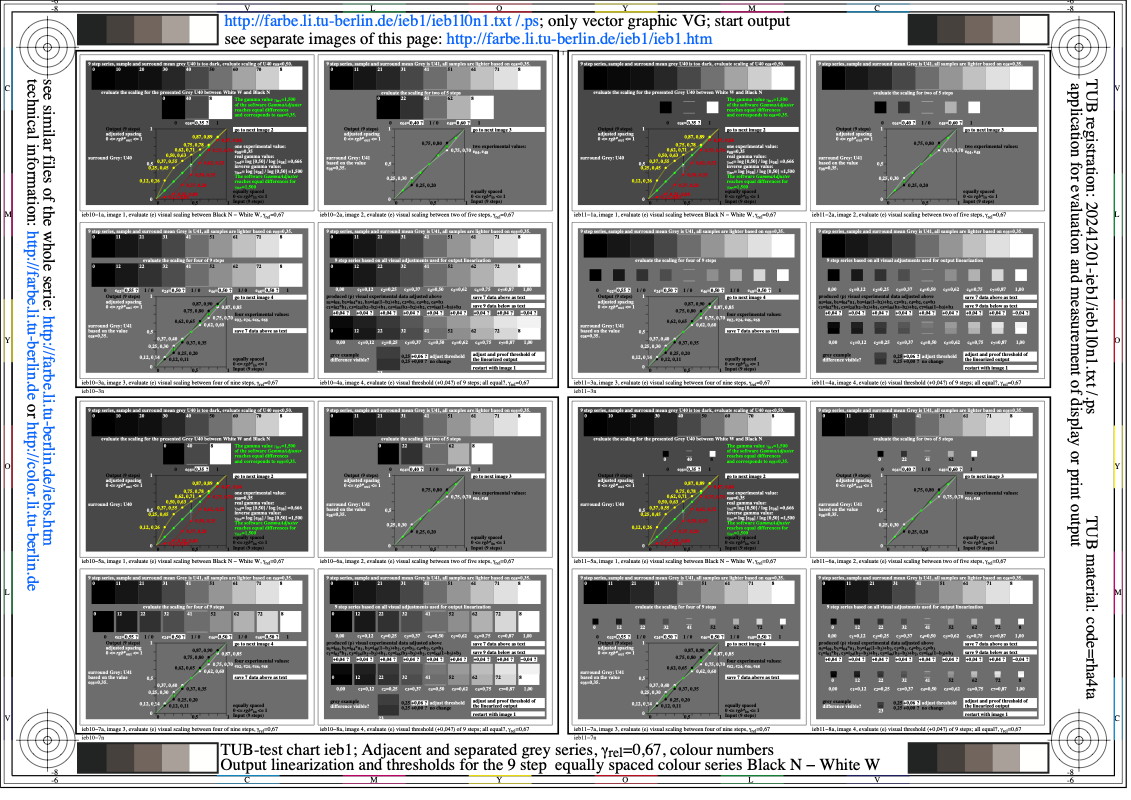
Image ieb1l0n1.jpg: Output in format A6 of the file
ieb1l0np.pdf, see
ieb1l0n1.
ps /
txt /
pdf /
jpg
ieb1: TUB-test chart ieb1; adjacent and separate grey colours
Evaluation (e) of scaling, g(rel)=0,67; output linearization
and threshold for colour series Black N - White W

Image ieb2l0n1.jpg: Output in format A6 of the file
ieb2l0np.pdf, see
ieb2l0n1.
ps /
txt /
pdf /
jpg
ieb2: TUB-test chart ieb2; adjacent and separate grey colours
Evaluation (e) of scaling, g(rel)=0,67; output linearization
and threshold for colour series Black N - White W

Image ieb3l0n1.jpg: Output in format A6 of the file
ieb3l0np.pdf, see
ieb3l0n1.
ps /
txt /
pdf /
jpg
ieb3: TUB-test chart ieb3; adjacent and separate grey colours
Evaluation (e) of scaling, g(rel)=0,75; output linearization
and threshold for colour series Black N - White W

Image ieb4l0n1.jpg: Output in format A6 of the file
ieb4l0np.pdf, see
ieb4l0n1.
ps /
txt /
pdf /
jpg
ieb4: TUB-test chart ieb4; adjacent and separate grey colours
Evaluation (e) of scaling, g(rel)=0,75; output linearization
and threshold for colour series Black N - White W

Image ieb5l0n1.jpg: Output in format A6 of the file
ieb5l0np.pdf, see
ieb5l0n1.
ps /
txt /
pdf /
jpg
ieb5: TUB-test chart ieb5; adjacent and separate grey colours
Evaluation (e) of scaling, g(rel)=0,75; output linearization
and threshold for colour series Black N - White W

Image ieb6l0n1.jpg: Output in format A6 of the file
ieb6l0np.pdf, see
ieb6l0n1.
ps /
txt /
pdf /
jpg
ieb6: TUB-test chart ieb6; adjacent and separate grey colours
Production (p) of scaling, g(rel)=0,67; output linearization
and threshold for colour series Black N - White W
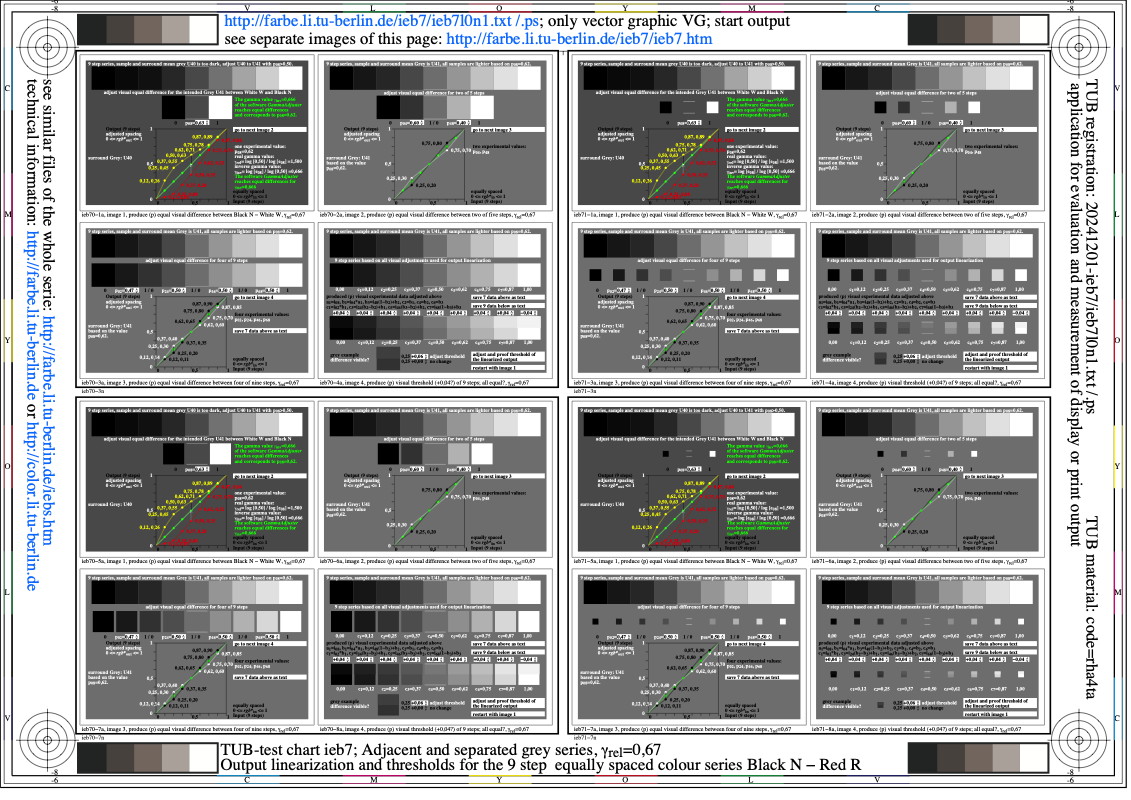
Image ieb7l0n1.jpg: Output in format A6 of the file
ieb7l0np.pdf, see
ieb7l0n1.
ps /
txt /
pdf /
jpg
ieb7: TUB-test chart ieb7; adjacent and separate grey colours
Production (p) of scaling, g(rel)=0,67; output linearization
and threshold for colour series Black N - White W
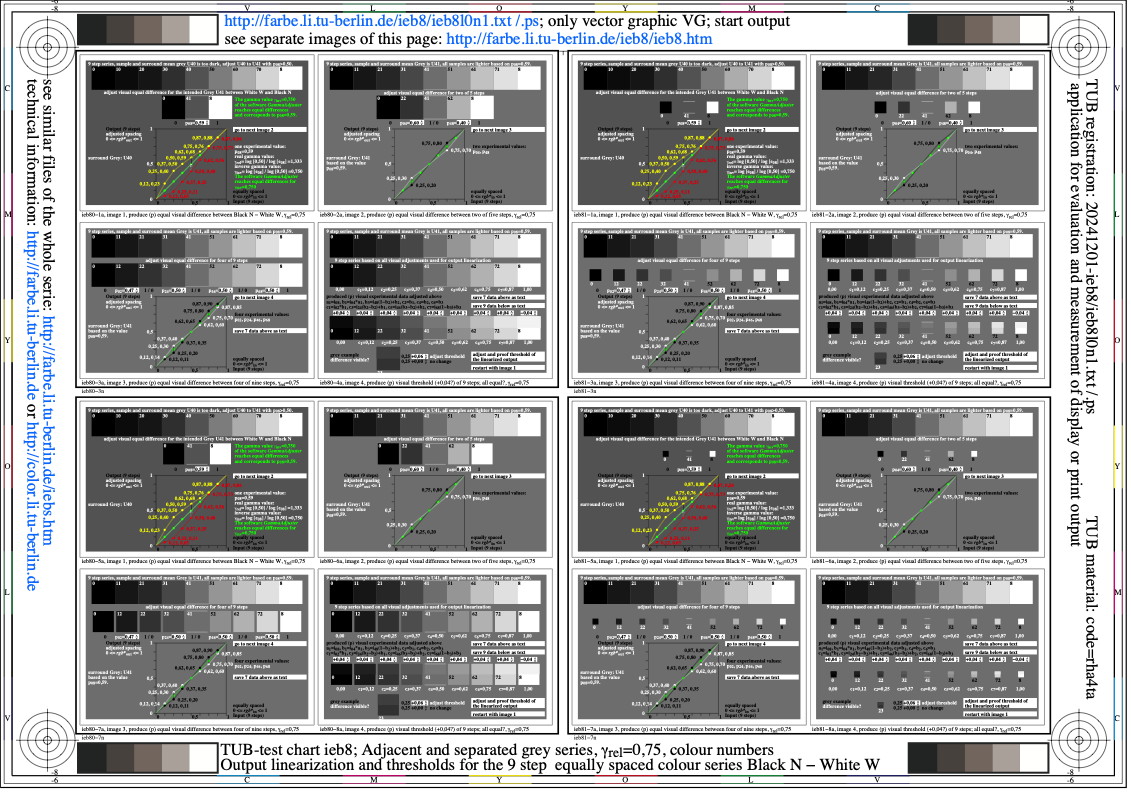
Image ieb8l0n1.jpg: Output in format A6 of the file
ieb8l0np.pdf, see
ieb8l0n1.
ps /
txt /
pdf /
jpg
ieb8: TUB-test chart ieb8; adjacent and separate grey colours
Production (p) of scaling, g(rel)=0,75; output linearization
and threshold for colour series Black N - White W

Image ieb9l0n1.jpg: Output in format A6 of the file
ieb9l0np.pdf, see
ieb9l0n1.
ps /
txt /
pdf /
jpg
ieb9: TUB-test chart ieb9; adjacent and separate grey colours
Production (p) of scaling, g(rel)=0,75; output linearization
and threshold for colour series Black N - White W

Image iec0l0n1.jpg: Output in format A6 of the file
iec0l0np.pdf, see
iec0l0n1.
ps /
txt /
pdf /
jpg
iec0: TUB-test chart iec0; CIELAB spaced 9 step grey scales
for four display reflections Yref=4, 1, 2, 100
L*N=23,7 or YN=4 and L*W=100 or YW=100, normalisation: white W

Image iec1l0n1.jpg: Output in format A6 of the file
iec1l0np.pdf, see
iec1l0n1.
ps /
txt /
pdf /
jpg
iec1: TUB-test chart iec1; CIELAB spaced 9 step grey scales
for four display reflections Yref=4, 1, 2, 100
L*N=23,7 or YN=4 and L*W=100 or YW=100, normalisation: grey U

Image iec2l0n1.jpg: Output in format A6 of the file
iec2l0np.pdf, see
iec2l0n1.
ps /
txt /
pdf /
jpg
iec2: TUB-test chart iec2; CIELAB spaced 9 step grey scales
for four display reflections Yref=4, 1, 2, 110
L*N=22,4 or YN=3,6 and L*W=103,7 or YW=110, normalisation: W
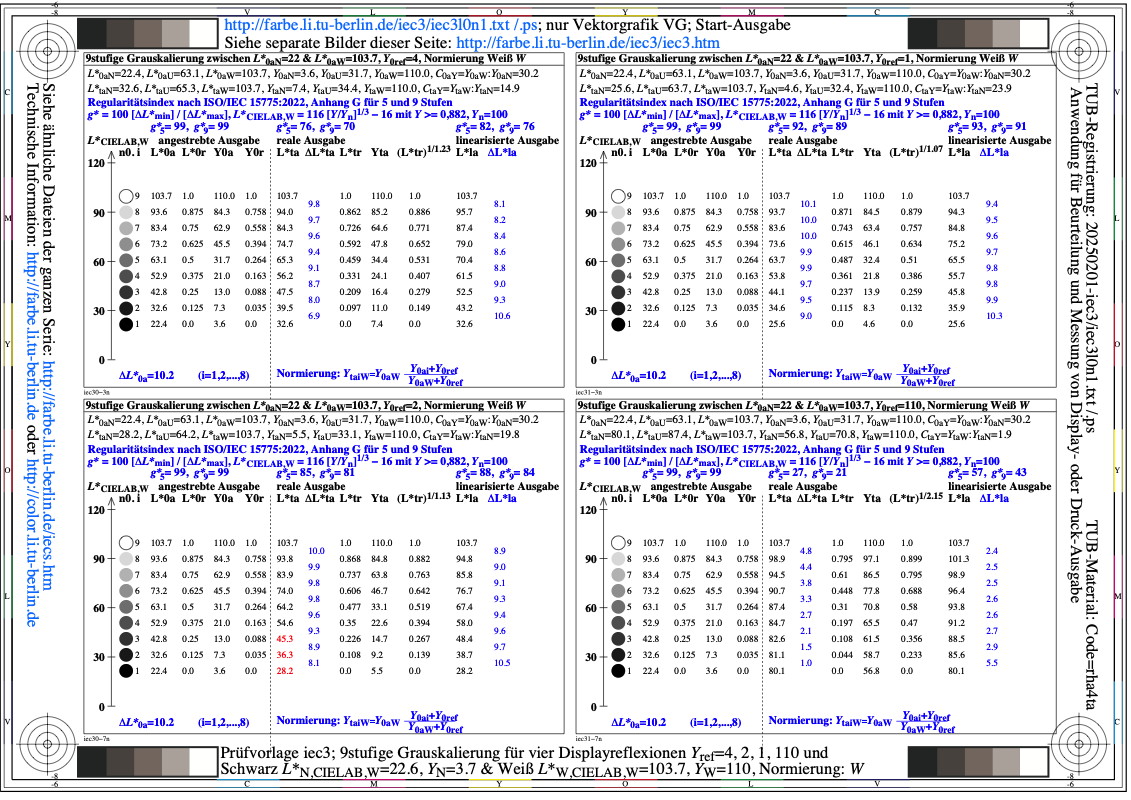
Image iec3l0n1.jpg: Output in format A6 of the file
iec3l0np.pdf, see
iec3l0n1.
ps /
txt /
pdf /
jpg
iec3: TUB-test chart iec3; CIELAB spaced 9 step grey scales
for four display reflections Yref=4, 1, 2, 110
L*N=22,4 or YN=3,6 and L*W=103,7 or YW=110, normalisation: U

Image iec4l0n1.jpg: Output in format A6 of the file
iec4l0np.pdf, see
iec4l0n1.
ps /
txt /
pdf /
jpg
iec4: TUB-test chart iec4; CIELAB spaced 9 step grey scales
for four display reflections Yref=4, 1, 2, 120
L*N=21,3 or YN=3,3, L*W=107,3 or YW=120, normalisation: white W

Image iec5l0n1.jpg: Output in format A6 of the file
iec5l0np.pdf, see
iec5l0n1.
ps /
txt /
pdf /
jpg
iec5: TUB-test chart iec5; CIELAB spaced 9 step grey scales
for four display reflections Yref=4, 1, 2, 120
L*N=21,3 or YN=3,3, L*W=107,3 or YW=120, normalisation: grey U

Image iec6l0n1.jpg: Output in format A6 of the file
iec6l0np.pdf, see
iec6l0n1.
ps /
txt /
pdf /
jpg
iec6: TUB-test chart iec6; CIELAB spaced 9 step grey scales
for four display reflections Yref=4, 1, 2, 200
L*N=15,5 or YN=2 and L*W=130,1 or YW=200, normalisation: white W

Image iec7l0n1.jpg: Output in format A6 of the file
iec7l0np.pdf, see
iec7l0n1.
ps /
txt /
pdf /
jpg
iec7: TUB-test chart iec7; CIELAB spaced 9 step grey scales
for four display reflections Yref=4, 1, 2, 200
L*N=15,5 or YN=2 and L*W=130,1 or YW=200, normalisation: grey U

Image iec8l0n1.jpg: Output in format A6 of the file
iec8l0np.pdf, see
iec8l0n1.
ps /
txt /
pdf /
jpg
iec8: TUB-test chart iec8; CIELAB spaced 9 step grey scales
for four display reflections Yref=4, 1, 2, 60
L*N=31,0 or YN=6,7 and L*W=81,8 or YW=60, normalisation: white W

Image iec9l0n1.jpg: Output in format A6 of the file
iec9l0np.pdf, see
iec9l0n1.
ps /
txt /
pdf /
jpg
iec9: TUB-test chart iec9; CIELAB spaced 9 step grey scales
for four display reflections Yref=4, 1, 2, 60
L*N=31,0 or YN=6,7 and L*W=81,8 or YW=60, normalisation: grey U

Image ied0l0n1.jpg: Output in format A6 of the file
ied0l0np.pdf, see
ied0l0n1.
ps /
txt /
pdf /
jpg
ied0: TUB-test chart ied0; TUBLOG,Ua spaced 9 step grey scales
for four display reflections Yref=4, 1, 2, 100
L*N=-50 or YN=4 and L*W=50 or YW=100, normalisation: white W

Image ied1l0n1.jpg: Output in format A6 of the file
ied1l0np.pdf, see
ied1l0n1.
ps /
txt /
pdf /
jpg
ied1: TUB-test chart ied1; TUBLOG,Ua spaced 9 step grey scales
for four display reflections Yref=4, 1, 2, 100
L*N=-50 or YN=4 and L*W=50 or YW=100, normalisation: grey U

Image ied2l0n1.jpg: Output in format A6 of the file
ied2l0np.pdf, see
ied2l0n1.
ps /
txt /
pdf /
jpg
ied2: TUB-test chart ied2; TUBLOG,Ua spaced 9 step grey scales
for four display reflections Yref=4, 1, 2, 110
L*N=-52,8 or YN=3,6 and L*W=53 or YW=110, normalisation: white W

Image ied3l0n1.jpg: Output in format A6 of the file
ied3l0np.pdf, see
ied3l0n1.
ps /
txt /
pdf /
jpg
ied3: TUB-test chart ied3; TUBLOG,Ua spaced 9 step grey scales
for four display reflections Yref=4, 1, 2, 110
L*N=-52,8 or YN=3,6 and L*W=53 or YW=110, normalisation: grey U

Image ied4l0n1.jpg: Output in format A6 of the file
ied4l0np.pdf, see
ied4l0n1.
ps /
txt /
pdf /
jpg
ied4: TUB-test chart ied4; TUBLOG,Ua spaced 9 step grey scales
for four display reflections Yref=4, 1, 2, 120
L*N=-55,6 or YN=3,3, L*W=55,7 or YW=120, normalisation: white W

Image ied5l0n1.jpg: Output in format A6 of the file
ied5l0np.pdf, see
ied5l0n1.
ps /
txt /
pdf /
jpg
ied5: TUB-test chart ied5; TUBLOG,Ua spaced 9 step grey scales
for four display reflections Yref=4, 1, 2, 120
L*N=-55,6 or YN=3,3, L*W=55,7 or YW=120, normalisation: grey U

Image ied6l0n1.jpg: Output in format A6 of the file
ied6l0np.pdf, see
ied6l0n1.
ps /
txt /
pdf /
jpg
ied6: TUB-test chart ied6; TUBLOG,Ua spaced 9 step grey scales
for four display reflections Yref=4, 1, 2, 200
L*N=-71,4 or YN=2 and L*W=71,5 or YW=200, normalisation: white W

Image ied7l0n1.jpg: Output in format A6 of the file
ied7l0np.pdf, see
ied7l0n1.
ps /
txt /
pdf /
jpg
ied7: TUB-test chart ied7; TUBLOG,Ua spaced 9 step grey scales
for four display reflections Yref=4, 1, 2, 200
L*N=-71,4 or YN=2 and L*W=71,5 or YW=200, normalisation: grey U

Image ied8l0n1.jpg: Output in format A6 of the file
ied8l0np.pdf, see
ied8l0n1.
ps /
txt /
pdf /
jpg
ied8: TUB-test chart ied8; TUBLOG,Ua spaced 9 step grey scales
for four display reflections Yref=4, 1, 2, 60
L*N=-34 or YN=6,7 and L*W=34,1 or YW=60, normalisation: white W

Image ied9l0n1.jpg: Output in format A6 of the file
ied9l0np.pdf, see
ied9l0n1.
ps /
txt /
pdf /
jpg
ied9: TUB-test chart ied9; TUBLOG,Ua spaced 9 step grey scales
for four display reflections Yref=4, 1, 2, 60
L*N=-34 or YN=6,7 and L*W=34,1 or YW=60, normalisation: grey U
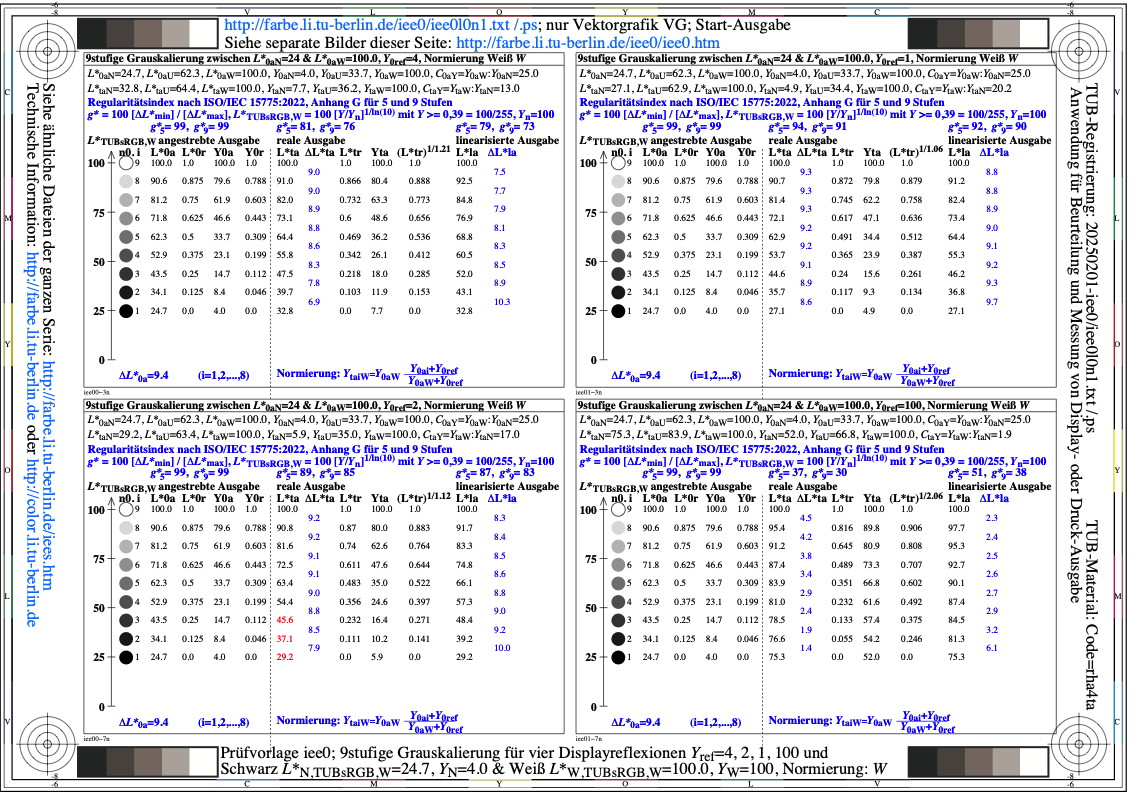
Image iee0l0n1.jpg: Output in format A6 of the file
iee0l0np.pdf, see
iee0l0n1.
ps /
txt /
pdf /
jpg
iee0: TUB-test chart iee0; TUBsRGB,W spaced 9 step grey scales
for four display reflections Yref=4, 1, 2, 100
L*N=24,7 or YN=4 and L*W=100 or YW=100, normalisation: white W

Image iee1l0n1.jpg: Output in format A6 of the file
iee1l0np.pdf, see
iee1l0n1.
ps /
txt /
pdf /
jpg
iee1: TUB-test chart iee1; TUBsRGB,W spaced 9 step grey scales
for four display reflections Yref=4, 1, 2, 100
L*N=24,7 or YN=4 and L*W=100 or YW=100, normalisation: grey U

Image iee2l0n1.jpg: Output in format A6 of the file
iee2l0np.pdf, see
iee2l0n1.
ps /
txt /
pdf /
jpg
iee2: TUB-test chart iee2; TUBsRGB,W spaced 9 step grey scales
for four display reflections Yref=4, 1, 2, 110
L*N=23,7 or YN=3,6 & L*W=104,2 or YW=110, normalisation: white W
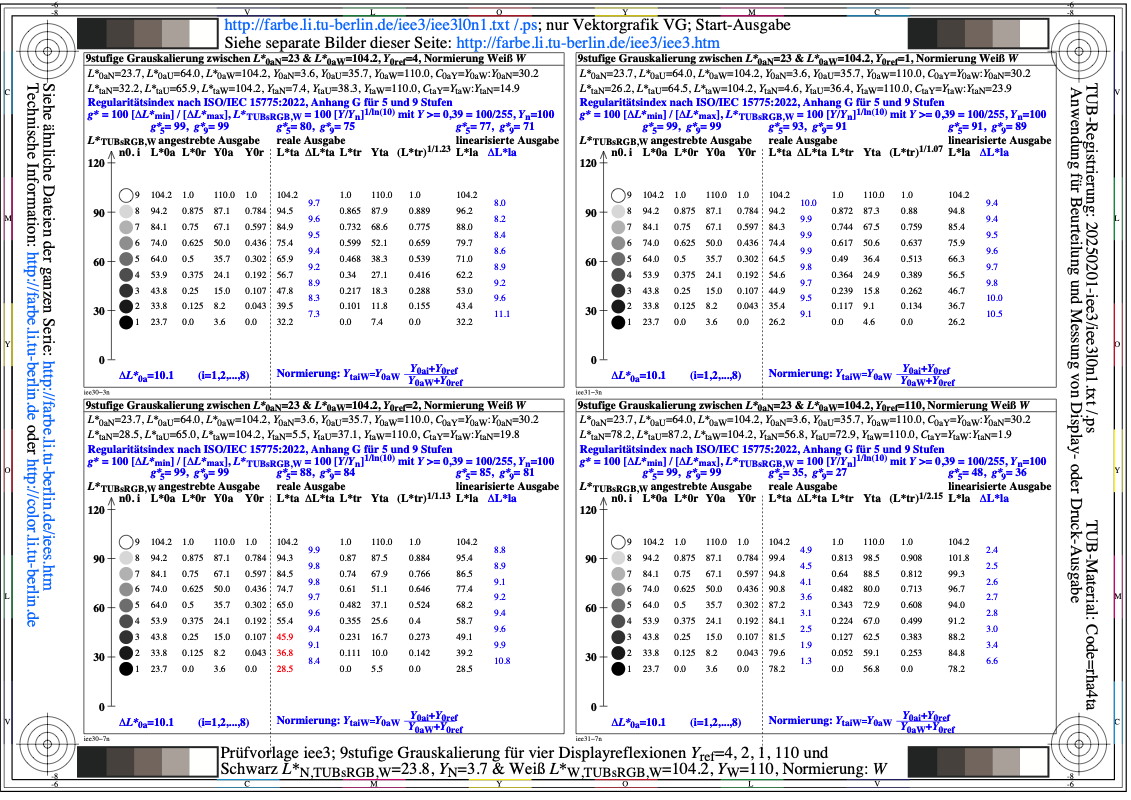
Image iee3l0n1.jpg: Output in format A6 of the file
iee3l0np.pdf, see
iee3l0n1.
ps /
txt /
pdf /
jpg
iee3: TUB-test chart iee3; TUBsRGB,W spaced 9 step grey scales
for four display reflections Yref=4, 1, 2, 110
L*N=23,7 or YN=3,6 & L*W=104,2 or YW=110, normalisation: grey U

Image iee4l0n1.jpg: Output in format A6 of the file
iee4l0np.pdf, see
iee4l0n1.
ps /
txt /
pdf /
jpg
iee4: TUB-test chart iee4; TUBsRGB,W spaced 9 step grey scales
for four display reflections Yref=4, 1, 2, 120
L*N=22,8 or YN=3,3, L*W=108,2 or YW=120, normalisation: white W

Image iee5l0n1.jpg: Output in format A6 of the file
iee5l0np.pdf, see
iee5l0n1.
ps /
txt /
pdf /
jpg
iee5: TUB-test chart iee5; TUBsRGB,W spaced 9 step grey scales
for four display reflections Yref=4, 1, 2, 120
L*N=22,8 or YN=3,3, L*W=108,2 or YW=120, normalisation: grey U

Image iee6l0n1.jpg: Output in format A6 of the file
iee6l0np.pdf, see
iee6l0n1.
ps /
txt /
pdf /
jpg
iee6: TUB-test chart iee6; TUBsRGB,W spaced 9 step grey scales
for four display reflections Yref=4, 1, 2, 200
L*N=18,3 or YN=2 and L*W=135,1 or YW=200, normalisation: white W

Image iee7l0n1.jpg: Output in format A6 of the file
iee7l0np.pdf, see
iee7l0n1.
ps /
txt /
pdf /
jpg
iee7: TUB-test chart iee7; TUBsRGB,W spaced 9 step grey scales
for four display reflections Yref=4, 1, 2, 200
L*N=18,3 or YN=2 and L*W=135,1 or YW=200, normalisation: grey U

Image iee8l0n1.jpg: Output in format A6 of the file
iee8l0np.pdf, see
iee8l0n1.
ps /
txt /
pdf /
jpg
iee8: TUB-test chart iee8; TUBsRGB,W spaced 9 step grey scales
for four display reflections Yref=4, 1, 2, 60
L*N=30,8 or YN=6,7 and L*W=80,1 or YW=60, normalisation: white W
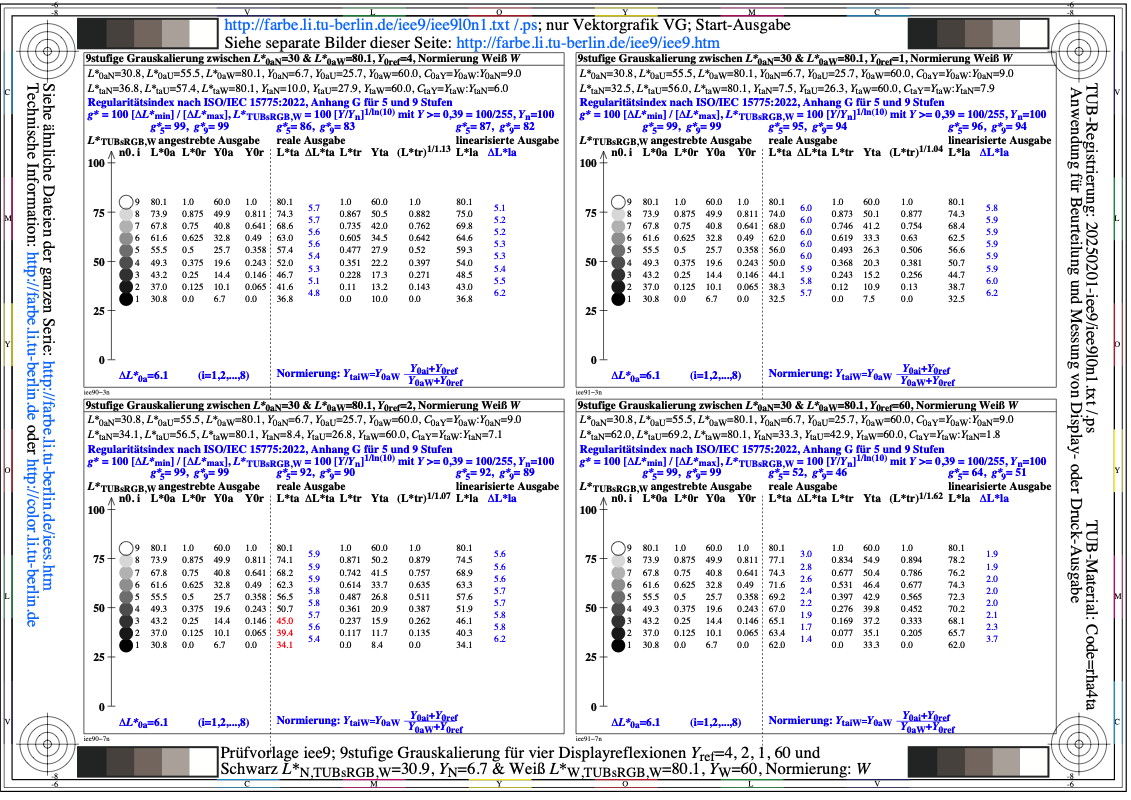
Image iee9l0n1.jpg: Output in format A6 of the file
iee9l0np.pdf, see
iee9l0n1.
ps /
txt /
pdf /
jpg
iee9: TUB-test chart iee9; TUBsRGB,W spaced 9 step grey scales
for four display reflections Yref=4, 1, 2, 60
L*N=30,8 or YN=6,7 and L*W=80,1 or YW=60, normalisation: grey U

Image ief0l0n1.jpg: Output in format A6 of the file
ief0l0np.pdf, see
ief0l0n1.
ps /
txt /
pdf /
jpg
ief0: TUB-test chart ief0; adjacent and separate grey colours
Evaluation (e) of scaling, g(rel)=0,66; output linearization
and threshold for colour series Black N - White W

Image ief1l0n1.jpg: Output in format A6 of the file
ief1l0np.pdf, see
ief1l0n1.
ps /
txt /
pdf /
jpg
ief1: TUB-test chart ief1; adjacent and separate grey colours
Evaluation (e) of scaling, g(rel)=0,66; output linearization
and threshold for colour series Black N - White W

Image ief2l0n1.jpg: Output in format A6 of the file
ief2l0np.pdf, see
ief2l0n1.
ps /
txt /
pdf /
jpg
ief2: TUB-test chart ief2; adjacent and separate grey colours
Evaluation (e) of scaling, g(rel)=0,75; output linearization
and threshold for colour series Black N - White W

Image ief3l0n1.jpg: Output in format A6 of the file
ief3l0np.pdf, see
ief3l0n1.
ps /
txt /
pdf /
jpg
ief3: TUB-test chart ief3; adjacent and separate grey colours
Evaluation (e) of scaling, g(rel)=0,75; output linearization
and threshold for colour series Black N - White W

Image ief4l0n1.jpg: Output in format A6 of the file
ief4l0np.pdf, see
ief4l0n1.
ps /
txt /
pdf /
jpg
ief4: TUB-test chart ief4; adjacent and separate grey colours
Production (p) of scaling, g(rel)=0,66; output linearization
and threshold for colour series Black N - White W

Image ief5l0n1.jpg: Output in format A6 of the file
ief5l0np.pdf, see
ief5l0n1.
ps /
txt /
pdf /
jpg
ief5: TUB-test chart ief5; adjacent and separate grey colours
Production (p) of scaling, g(rel)=0,66; output linearization
and threshold for colour series Black N - White W

Image ief6l0n1.jpg: Output in format A6 of the file
ief6l0np.pdf, see
ief6l0n1.
ps /
txt /
pdf /
jpg
ief6: TUB-test chart ief6; adjacent and separate grey colours
Production (p) of scaling, g(rel)=0,75; output linearization
and threshold for colour series Black N - White W

Image ief7l0n1.jpg: Output in format A6 of the file
ief7l0np.pdf, see
ief7l0n1.
ps /
txt /
pdf /
jpg
ief7: TUB-test chart ief7; adjacent and separate grey colours
Production (p) of scaling, g(rel)=0,75; output linearization
and threshold for colour series Black N - White W

Image ief8l0n1.jpg: Output in format A6 of the file
ief8l0np.pdf, see
ief8l0n1.
ps /
txt /
pdf /
jpg
ief8: TUB-test chart ief8; adjacent and separate grey colours
Evaluating (e) of scaling, g(rel)=0,66; output linearization
and threshold for colour series Black N - White W

Image ief9l0n1.jpg: Output in format A6 of the file
ief9l0np.pdf, see
ief9l0n1.
ps /
txt /
pdf /
jpg
ief9: TUB-test chart ief9; adjacent and separate grey colours
Production (p) of scaling, g(rel)=0,75; output linearization
and threshold for colour series Black N - White W

Image ieg0l0n1.jpg: Output in format A6 of the file
ieg0l0np.pdf, see
ieg0l0n1.
ps /
txt /
pdf /
jpg
ieg0: TUB-test chart ieg0; adjacent and separate grey colours
Evaluation (e) scaling, 0,5<=g(rel)<=2, 4 images, linearization
and threshold for colour series Black N - White W

Image ieg1l0n1.jpg: Output in format A6 of the file
ieg1l0np.pdf, see
ieg1l0n1.
ps /
txt /
pdf /
jpg
ieg1: TUB-test chart ieg1; adjacent and separate grey colours
Evaluation (e) scaling, 0,5<=g(rel)<=2, image 1, linearization
and threshold for colour series Black N - White W

Image ieg2l0n1.jpg: Output in format A6 of the file
ieg2l0np.pdf, see
ieg2l0n1.
ps /
txt /
pdf /
jpg
ieg2: TUB-test chart ieg2; adjacent and separate grey colours
Evaluation (e) scaling, 0,5<=g(rel)<=2, image 2, linearization
and threshold for colour series Black N - White W

Image ieg3l0n1.jpg: Output in format A6 of the file
ieg3l0np.pdf, see
ieg3l0n1.
ps /
txt /
pdf /
jpg
ieg3: TUB-test chart ieg3; adjacent and separate grey colours
Evaluation (e) scaling, 0,5<=g(rel)<=2, image 3, linearization
and threshold for colour series Black N - White W

Image ieg4l0n1.jpg: Output in format A6 of the file
ieg4l0np.pdf, see
ieg4l0n1.
ps /
txt /
pdf /
jpg
ieg4: TUB-test chart ieg4; adjacent and separate grey colours
Production (p) scaling, 0,5<=g(rel)<=2, image 4, linearization
and threshold for colour series Black N - White W

Image ieg5l0n1.jpg: Output in format A6 of the file
ieg5l0np.pdf, see
ieg5l0n1.
ps /
txt /
pdf /
jpg
ieg5: TUB-test chart ieg5; adjacent and separate grey colours
Production (p) scaling, 0,5<=g(rel)<=2, 4 images, linearization
and threshold for colour series Black N - White W

Image ieg6l0n1.jpg: Output in format A6 of the file
ieg6l0np.pdf, see
ieg6l0n1.
ps /
txt /
pdf /
jpg
ieg6: TUB-test chart ieg6; adjacent and separate grey colours
Production (p) scaling, 0,5<=g(rel)<=2, image 1, linearization
and threshold for colour series Black N - White W

Image ieg7l0n1.jpg: Output in format A6 of the file
ieg7l0np.pdf, see
ieg7l0n1.
ps /
txt /
pdf /
jpg
ieg7: TUB-test chart ieg7; adjacent and separate grey colours
Production (p) scaling, 0,5<=g(rel)<=2, image 2, linearization
and threshold for colour series Black N - White W

Image ieg8l0n1.jpg: Output in format A6 of the file
ieg8l0np.pdf, see
ieg8l0n1.
ps /
txt /
pdf /
jpg
ieg8: TUB-test chart ieg8; adjacent and separate grey colours
Evaluating (e) scaling, 0,5<=g(rel)<=2, image 3, linearization
and threshold for colour series Black N - White W

Image ieg9l0n1.jpg: Output in format A6 of the file
ieg9l0np.pdf, see
ieg9l0n1.
ps /
txt /
pdf /
jpg
ieg9: TUB-test chart ieg9; adjacent and separate grey colours
Production (p) scaling, 0,5<=g(rel)<=2, image 4, linearization
and threshold for colour series Black N - White W

Image ieh0l0n1.jpg: Output in format A6 of the file
ieh0l0np.pdf, see
ieh0l0n1.
ps /
txt /
pdf /
jpg
ieh0: TUB-test chart ieh0; Achromatic thresholds, 5 Lu & Lm on Y
thresholds delta_L (0,4s), contrast and lightness; experi-
mental data of Lingelbach and Richter with adaptation

Image ieh1l0n1.jpg: Output in format A6 of the file
ieh1l0np.pdf, see
ieh1l0n1.
ps /
txt /
pdf /
jpg
ieh1: TUB-test chart ieh1; N-WYRGB luminance thresholds
Cr=L/delta_L (0,1 & 26s) as function of L; experiments
Avramopoulos, 3 luminances Lu=Lw/5=6, 63, 630cd/m^2

Image ieh2l0n1.jpg: Output in format A6 of the file
ieh2l0np.pdf, see
ieh2l0n1.
ps /
txt /
pdf /
jpg
ieh2: TUB-test chart ieh2; N-WYRGB luminance thresholds
delta_L, L/delta_L (26s) as function of L; experiments
Avramopoulos, 3 luminances Lu=Lw/5=6, 63, 630cd/m^2

Image ieh3l0n1.jpg: Output in format A6 of the file
ieh3l0np.pdf, see
ieh3l0n1.
ps /
txt /
pdf /
jpg
ieh3: TUB-test chart ieh3; Achromatic receptor responses
and derivation; 2 antagonistic responses (W,N) and sum;
different constants; a1,b1 of process W, and a2,b2 of process N

Image ieh4l0n1.jpg: Output in format A6 of the file
ieh4l0np.pdf, see
ieh4l0n1.
ps /
txt /
pdf /
jpg
ieh4: TUB-test chart ieh4; Achromatic receptor responses
and derivation; 2 antagonistic responses (W,N) and sum;
different constants; a1,b1 of process W, and a2,b2 of process N

Image ieh5l0n1.jpg: Output in format A6 of the file
ieh5l0np.pdf, see
ieh5l0n1.
ps /
txt /
pdf /
jpg
ieh5: TUB-test chart ieh5; Achromatic receptor responses
and derivation; 2 antagonistic responses (W,N) and sum;
different constants; a1,b1,c1 of W, and a2,b2,c2 of N

Image ieh6l0n1.jpg: Output in format A6 of the file
ieh6l0np.pdf, see
ieh6l0n1.
ps /
txt /
pdf /
jpg
ieh6: TUB-test chart ieh6; Achromatic receptor responses
and derivation; 2 antagonistic responses (W,N) and sum;
different constants; a1,b1,c1 of W, and a2,b2,c2 of N

Image ieh7l0n1.jpg: Output in format A6 of the file
ieh7l0np.pdf, see
ieh7l0n1.
ps /
txt /
pdf /
jpg
ieh7: TUB-test chart ieh7; Achromatic receptor responses
and derivation; 2 antagonistic responses (W,N) and sum;
different constants; a1,b1,c1 of W, and a2,b2,c2 of N

Image ieh8l0n1.jpg: Output in format A6 of the file
ieh8l0np.pdf, see
ieh8l0n1.
ps /
txt /
pdf /
jpg
ieh8: TUB-test chart ieh8; Achromatic receptor responses
and derivation; 2 antagonistic responses (W,N) and sum;
different constants; a1,b1,c1 of W, and a2,b2,c2 of N

Image ieh9l0n1.jpg: Output in format A6 of the file
ieh9l0np.pdf, see
ieh9l0n1.
ps /
txt /
pdf /
jpg
ieh9: TUB-test chart ieh9; N-WYRGB luminance thresholds
delta_L & L/delta_L (26s) as function of L; experiments
Avramopoulos, 3 luminances Lu=Lw/5=6, 63, 630cd/m^2

Image iei0l0n1.jpg: Output in format A6 of the file
iei0l0np.pdf, see
iei0l0n1.
ps /
txt /
pdf /
jpg
iei0: TUB-test chart iei0; Fab/cb(xr) models for receptor responses;
Fab/cb(xr) with hyberbel functions e^(xr/a) and e^(xr/c);
derivation F'ab/cb(xr) for contrast and discrimination

Image iei1l0n1.jpg: Output in format A6 of the file
iei1l0np.pdf, see
iei1l0n1.
ps /
txt /
pdf /
jpg
iei1: TUB-test chart iei1; Fab/cb(Lr) models for receptor responses;
Fab/cb(Lr) with Lr=L/Lu and power functions Lr^m and Lr^n;
derivations F'ab/cb(Lr) for contrast and discrimination

Image iei2l0n1.jpg: Output in format A6 of the file
iei2l0np.pdf, see
iei2l0n1.
ps /
txt /
pdf /
jpg
iei2: TUB-test chart iei2; Single and dupple-line elements;
responses and discrimination; antagonistic response functions;
thresholds and scaling for achromatic and chromatic colours

Image iei3l0n1.jpg: Output in format A6 of the file
iei3l0np.pdf, see
iei3l0n1.
ps /
txt /
pdf /
jpg
iei3: TUB-test chart iei3; Fab(xr) and F'ab(xr) as function of a;
contrast L/delta_L for example presentation time 0,4s;
Lingelbach and Richter data for 5 Lu adaptations

Image iei4l0n1.jpg: Output in format A6 of the file
iei4l0np.pdf, see
iei4l0n1.
ps /
txt /
pdf /
jpg
iei4: TUB-test chart iei4; Q/Fab(xr) responses and derivation;
mathematical calculation of derivation with quotient rule;
calculation of contrast L/delta_L and discrimination delta_L

Image iei5l0n1.jpg: Output in format A6 of the file
iei5l0np.pdf, see
iei5l0n1.
ps /
txt /
pdf /
jpg
iei5: TUB-test chart iei5; Fa/b/ab(xr) responses and derivation;
mathematical calculation of derivation with quotient rule;
contrast (L/delta_L)a/b/ab and discrimination (delta_L)a/b/ab

Image iei6l0n1.jpg: Output in format A6 of the file
iei6l0np.pdf, see
iei6l0n1.
ps /
txt /
pdf /
jpg
iei6: TUB-test chart iei6; Reflection of surface colours RYGB;
CIELAB and (A2,B2) chroma of display colours RYGCBM;
Ostwald, sRGB, and WCGa colours with rgb* values

Image iei7l0n1.jpg: Output in format A6 of the file
iei7l0np.pdf, see
iei7l0n1.
ps /
txt /
pdf /
jpg
iei7: TUB-test chart iei7; Ostwald colours and colour halfes;
equal chroma (A2,B2) for antichromatic colour pairs
R-C, Y-B, G-M for the CIE illuminants D65, D50, and A

Image iei8l0n1.jpg: Output in format A6 of the file
iei8l0np.pdf, see
iei8l0n1.
ps /
txt /
pdf /
jpg
iei8: TUB-test chart iei8; Contrast L/delta_L and spectrum;
spectrum and discrimination of 6 Ostwald colours;
spectral mixture to Ostwald colours and TV colours

Image iei9l0n1.jpg: Output in format A6 of the file
iei9l0np.pdf, see
iei9l0n1.
ps /
txt /
pdf /
jpg
iei9: TUB-test chart iei9; Ligthness L* in colour metrics
with CIELAB, ITUsRGB and TUBLOG. L* in sRGB & HDR range;
luminances according to ISO 22028-5 for SDR and HDR colours

Image iej0l0n1.jpg: Output in format A6 of the file
iej0l0np.pdf, see
iej0l0n1.
ps /
txt /
pdf /
jpg
iej0: TUB-test chart iej0; Threshold experiments;
description of the experimental threshold delta Y;
formulae for the calculation of the lightness F*(Y)

Image iej1l0n1.jpg: Output in format A6 of the file
iej1l0np.pdf, see
iej1l0n1.
ps /
txt /
pdf /
jpg
iej1: TUB-test chart iej1; CIE Y and lightness L*
for surface colours and emissive displays;
BAM-NW-achromatic thresholds delta_Y as function of Y

Image iej2l0n1.jpg: Output in format A6 of the file
iej2l0np.pdf, see
iej2l0n1.
ps /
txt /
pdf /
jpg
iej2: TUB-test chart iej2; Comparison of Qab(xr) and Fab(xr);
line elements as integral and derivation of Qab(xr) and Fab(xr);
Qab(xr) with a=0,5 and b=1, Fab(xr) with a=1 and b=1

Image iej3l0n1.jpg: Output in format A6 of the file
iej3l0np.pdf, see
iej3l0n1.
ps /
txt /
pdf /
jpg
iej3: TUB-test chart iej3; Q/Fab(xr)-models for visual responses;
Q/Fab(xr) with hyperbel functions e^(xr/a) and 10^(xr/a')
with contants a'=a ln(10); a=0,5 and 1 for Qab(xr) and Fab(xr)

Image iej4l0n1.jpg: Output in format A6 of the file
iej4l0np.pdf, see
iej4l0n1.
ps /
txt /
pdf /
jpg
iej4: TUB-test chart iej4; Normalized models Fab(xr) & F'ab(xr);
mathematical calculation of the derivation F'ab(xr) and
of the contrast L/delta_L and the discrimination delta_L

Image iej5l0n1.jpg: Output in format A6 of the file
iej5l0np.pdf, see
iej5l0n1.
ps /
txt /
pdf /
jpg
iej5: TUB-test chart iej5; Fab(xr)-model for visual responses;
F'ab(xr) response derivation; tanh(xr) with e^xr/a and 10^xr/a';
a'=a ln(10); a=1 & -0,66, b=1 & 2; 16 and 4x4 images

Image iej6l0n1.jpg: Output in format A6 of the file
iej6l0np.pdf, see
iej6l0n1.
ps /
txt /
pdf /
jpg
iej6: TUB-test chart iej6; Fab(xr)-model for visual responses;
F'ab(xr) response derivation; tanh(xr) with e^xr/a and 10^xr/a';
a'=a ln(10); a=1 & -0,71; b=1 & 2, 16 and 4x4 images

Image iej7l0n1.jpg: Output in format A6 of the file
iej7l0np.pdf, see
iej7l0n1.
ps /
txt /
pdf /
jpg
iej7: TUB-test chart iej7; Fab(xr)-model for visual responses;
F'ab(xr) response derivation; tanh(xr) with e^xr/a and 10^xr/a';
a'=a ln(10); a=1 & -0,76; b=1 & 2, 16 and 4x4 images

Image iej8l0n1.jpg: Output in format A6 of the file
iej8l0np.pdf, see
iej8l0n1.
ps /
txt /
pdf /
jpg
iej8: TUB-test chart iej8; Fab(xr)-model for visual responses;
F'ab(xr) response derivation; tanh(xr) with e^xr/a and 10^xr/a';
a'=a ln(10); a=1 & -0,66; b=1 & 2, 16 and 4x4 images

Image iej9l0n1.jpg: Output in format A6 of the file
iej9l0np.pdf, see
iej9l0n1.
ps /
txt /
pdf /
jpg
iej9: TUB-test chart iej9; Fab(xr)-model for visual responses;
F'ab(xr) response derivation; tanh(xr) with e^xr/a and 10^xr/a';
a'=a ln(10); a=1 & 0,71, b=1 & 2; 16 and 4x4 images

Image iek0l0n1.jpg: Output in format A6 of the file
iek0l0np.pdf, see
iek0l0n1.
ps /
txt /
pdf /
jpg
iek0: TUB-test chart iek0; 5&9&16 steps P2-W and W-N, with image;
Flower motif range W-N for SDR displays in pixel graphics;
display reflection according to ISO 9241-306, g_rel=1,000

Image iek1l0n1.jpg: Output in format A6 of the file
iek1l0np.pdf, see
iek1l0n1.
ps /
txt /
pdf /
jpg
iek1: TUB-test chart iek1; 5&9&16 steps P2-W and W-N, with image;
Flower image range P2_N for HDR displays in pixel graphics;
display reflection according to ISO 9241-306, g_rel=1,000

Image iek2l0n1.jpg: Output in format A6 of the file
iek2l0np.pdf, see
iek2l0n1.
ps /
txt /
pdf /
jpg
iek2: TUB-test chart iek2; Colour glow and whiteness decreas;
see http:/standards.iso.org/9241/306/ed-2/AE49/AE49L0NP.PDF;
Luminance decrease of gey series and new white luminous colours

Image iek3l0n1.jpg: Output in format A6 of the file
iek3l0np.pdf, see
iek3l0n1.
ps /
txt /
pdf /
jpg
iek3: TUB-test chart iek3; Colour-display systems, sRGB according
to IEC 61966-2-1, and WCGa according to ISO 22028-5;
3 basic and mixture colours: CIEXYZ and CIELAB, Yw=100

Image iek4l0n1.jpg: Output in format A6 of the file
iek4l0np.pdf, see
iek4l0n1.
ps /
txt /
pdf /
jpg
iek4: TUB-test chart iek4; Wavelength ranges Ostwald colours;
normalized reflection log[R/0,2] and model relation
to the different antagonistic visual signals

Image iek5l0n1.jpg: Output in format A6 of the file
iek5l0np.pdf, see
iek5l0n1.
ps /
txt /
pdf /
jpg
iek5: TUB-test chart iek5; TUBJND model, lightness Fabc, Fabc,r;
receptor responses Fab (R+), Fcb (G-), Fab+Fcb (Y+) (left),
and relative (right) for equal parameters a and b

Image iek6l0n1.jpg: Output in format A6 of the file
iek6l0np.pdf, see
iek6l0n1.
ps /
txt /
pdf /
jpg
iek6: TUB-test chart iek6; TUBJND model, lightness Fabc, Fabc,r;
receptor responses Fab (R+), Fcb (G-), Fab+Fcb (Y+) (left),
and relative (right) for parameters a=1 and different b

Image iek7l0n1.jpg: Output in format A6 of the file
iek7l0np.pdf, see
iek7l0n1.
ps /
txt /
pdf /
jpg
iek7: TUB-test chart iek7; TUBJND model, lightness Fabc, Fabc,r;
receptor responses Fab (R+), Fcb (G-), Fab+Fcb (Y+) (left),
and relative (right) for different parameters a and b

Image iek8l0n1.jpg: Output in format A6 of the file
iek8l0np.pdf, see
iek8l0n1.
ps /
txt /
pdf /
jpg
iek8: TUB-test chart iek8; TUBJND model, lightness Fabc, Fabc,r;
receptor responses Fab(R+), Fcb(G-), Fab+Fcb(Y+) (left & right);
2 amplitude modulations of chromatic responses (left & right)

Image iek9l0n1.jpg: Output in format A6 of the file
iek9l0np.pdf, see
iek9l0n1.
ps /
txt /
pdf /
jpg
iek9: TUB-test chart iek9; TUBJND model, lightness Fabc, Fabc,r;
receptor responses Fab(R+), Fcb(G-), Fab+Fcb(Y+) (left & right);
4 derivations F'ab (R'+), F'cb (G'-), F'ab (Y'+), F'cb (Y'-)
Section 2, Chapter I:
Output linearization of visual data for scaling and thresholds (2025b),
under work
This image page with 260 image series:
ie2s in English,
ig2s in German.
Previous image page:
he2s in English,
hg2s in German.
Next image page, see
je2s in English,
jg2s in German.
Introduction, content list and summary:
ieai,
iea_i,
iea_s in English or
igai,
iga_i,
iga_s in German.
-------
Für Archiv-Information (2000-2009) des BAM servers "www.ps.bam.de"
(2000-2018)
über Prüfvorlagen,
farbmetrische Berechnungen, Normen und Veröffentlichungen, siehe
indexAE.html in englisch,
indexAG.html in deutsch.
Zurück zur TUB-Hauptseite (NICHT Archiv), siehe
index.html in englisch,
indexDE.html. in deutsch.