Image hea0l0n1.jpg: Output in format A6 of the file hea0l0np.pdf, see
hea0l0n1. ps / txt / pdf / jpg
Section 2, Chapter H:
SDR and HDR-colour metric for optimal colour-image quality (2025)
This image page with 260 image series:
he2s in English,
hg2s in German.
Previous image page:
ge2s in English,
gg2s in German.
Next image page, see
ie2s in English,
ig2s in German.
Introduction, content list and summary:
heai,
hea_i,
hea_s in English or
hgai,
hga_i,
hga_s in German.
Section 2: Colourimetry, Colour Vision and Applications for Colour
Image Technology (2019-2025), Image part he2s
Chapter H: SDR and HDR-colour metrics for optimal colour-image quality
(2025)
The following 260 image series between hea0 and hez9
show the content with links to the single figures
in up to six formats.
Image hea0l0n1.jpg: Output in format A6 of the file
hea0l0np.pdf, see
hea0l0n1.
ps /
txt /
pdf /
jpg
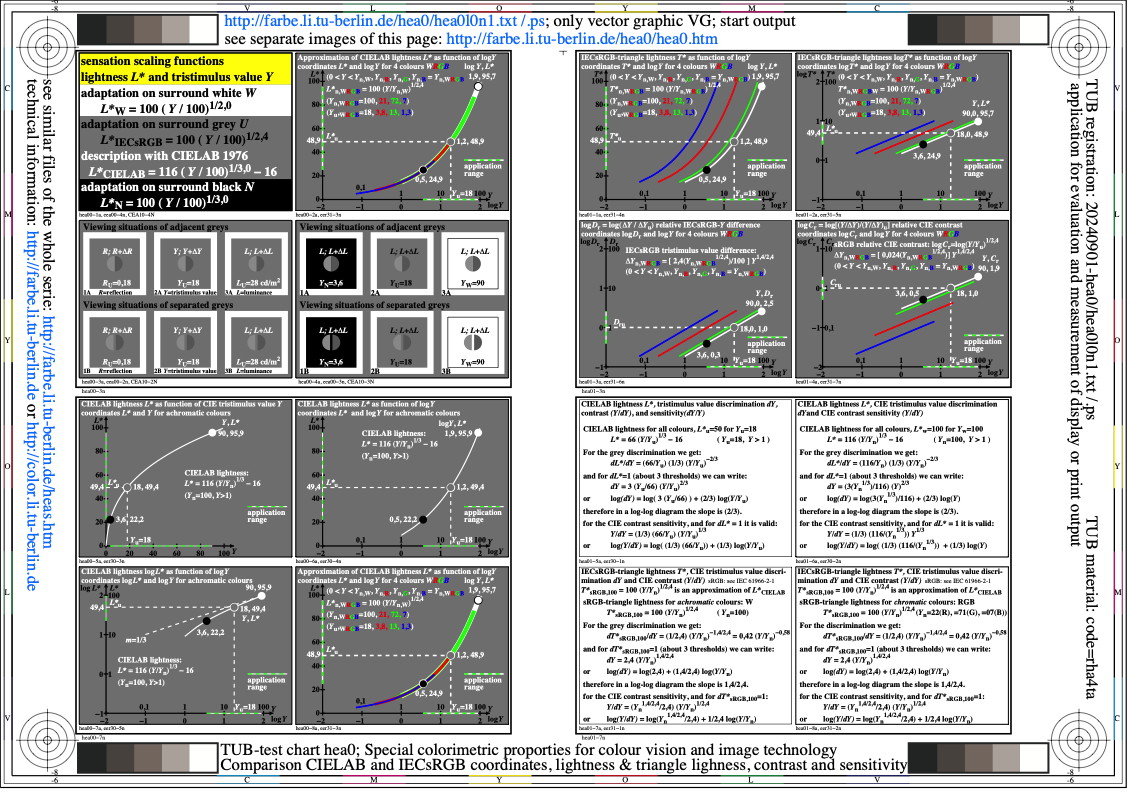
hea0: TUB-test chart hea0; Special colourimetric properties
of colour vision and image technology; Comparison of CIELAB and
IECsRGB: triangle lightness, contrast and sensitivity

Image hea1l0n1.jpg: Output in format A6 of the file
hea1l0np.pdf, see
hea1l0n1.
ps /
txt /
pdf /
jpg
hea1: TUB-test chart hea1; adjacent and separate grey
samples for visual interval scaling, evaluation of series
N-W with 3, 5, and 9 steps, output (rgb*)^1, surround U=N08w

Image hea2l0n1.jpg: Output in format A6 of the file
hea2l0np.pdf, see
hea2l0n1.
ps /
txt /
pdf /
jpg
hea2: TUB-test chart hea2; adjacent and separate grey
samples for visual interval scaling, evaluation of series
N-W with 3, 5, and 9 steps, output (rgb*)^0,5, surround U=N08w

Image hea3l0n1.jpg: Output in format A6 of the file
hea3l0np.pdf, see
hea3l0n1.
ps /
txt /
pdf /
jpg
hea3: TUB-test chart hea3; adjacent grey samples
for visual interval scaling, evaluation of N-W with
3, 5, and 9 steps, output (rgb*)^1,0 & inverse, surround U=N08w
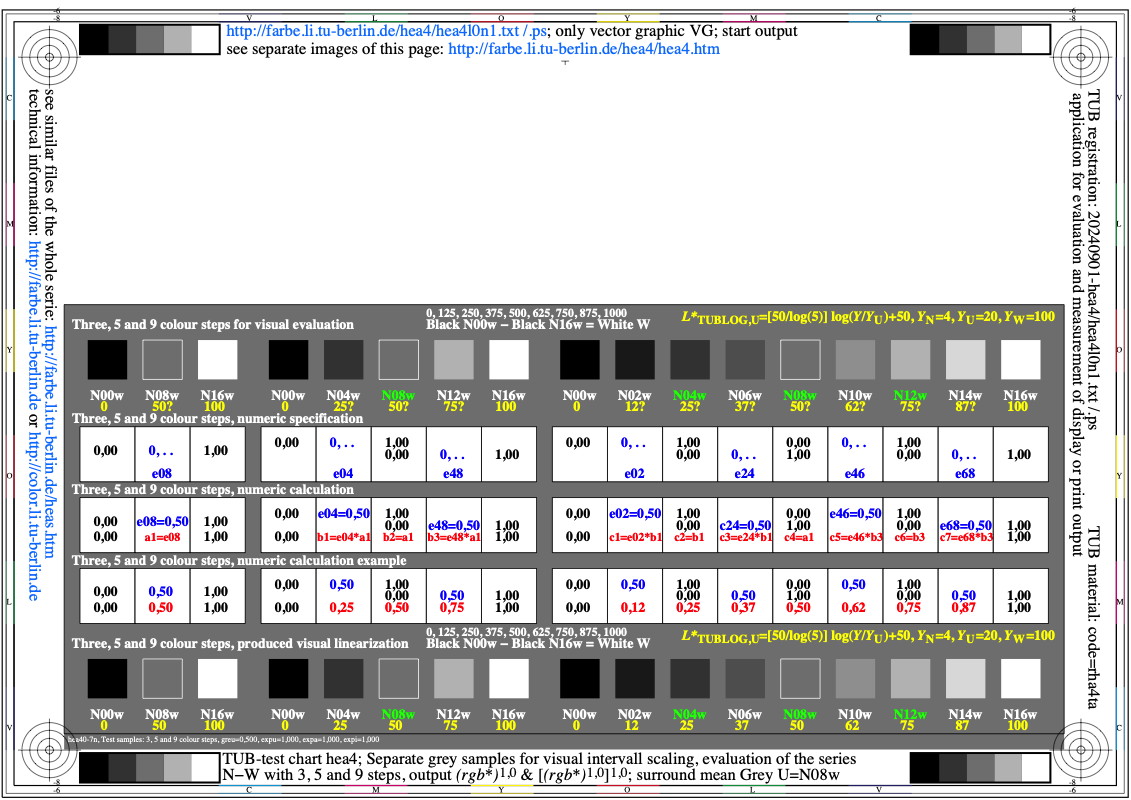
Image hea4l0n1.jpg: Output in format A6 of the file
hea4l0np.pdf, see
hea4l0n1.
ps /
txt /
pdf /
jpg
hea4: TUB-test chart hea4; separate grey samples
for visual interval scaling, evaluation of N-W with
3, 5, and 9 steps, output (rgb*)^1,0 & inverse, surround U=N08w

Image hea5l0n1.jpg: Output in format A6 of the file
hea5l0np.pdf, see
hea5l0n1.
ps /
txt /
pdf /
jpg
hea5: TUB-test chart hea5; adjacent grey samples
for visual interval scaling, evaluation of N-W with
3, 5, and 9 steps, output (rgb*)^1,0 & inverse, surround U=N08w

Image hea6l0n1.jpg: Output in format A6 of the file
hea6l0np.pdf, see
hea6l0n1.
ps /
txt /
pdf /
jpg
hea6: TUB-test chart hea6; separate grey samples
for visual interval scaling, evaluation of N-W with
3, 5, and 9 steps, output (rgb*)^0,75 & inverse, surround U=N08w

Image hea7l0n1.jpg: Output in format A6 of the file
hea7l0np.pdf, see
hea7l0n1.
ps /
txt /
pdf /
jpg
hea7: TUB-test chart hea7; adjacent grey samples
for visual interval scaling, evaluation of N-W with
3, 5, and 9 steps, output (rgb*)^0,75 & inverse, surround U=N08w

Image hea8l0n1.jpg: Output in format A6 of the file
hea8l0np.pdf, see
hea8l0n1.
ps /
txt /
pdf /
jpg
hea8: TUB-test chart hea8; separate grey samples
for visual interval scaling, evaluation of N-W with
3, 5, and 9 steps, output (rgb*)^0,5 & inverse, surround U=N08w

Image hea9l0n1.jpg: Output in format A6 of the file
hea9l0np.pdf, see
hea9l0n1.
ps /
txt /
pdf /
jpg
hea9: TUB-test chart hea9; adjacent grey samples
for visual interval scaling, evaluation of N-W with
3, 5, and 9 steps, output (rgb*)^0,5 & inverse, surround U=N08w

Image heb0l0n1.jpg: Output in format A6 of the file
heb0l0np.pdf, see
heb0l0n1.
ps /
txt /
pdf /
jpg
heb0: TUB-test chart heb0; Q/Fab(xr)-models for visual responses
Q/Fab(xr) with hyperbel functions e^(xr/a) and 10^(xr/a')
with contants a'=a ln(10) and a^n = a^1,0

Image heb1l0n1.jpg: Output in format A6 of the file
heb1l0np.pdf, see
heb1l0n1.
ps /
txt /
pdf /
jpg
heb1: TUB-test chart heb1; Fab(xr)-model for visual responses
Application of hyperbel function tanh on receptor responses
Presentation of the functions and derivation for discrimination

Image heb2l0n1.jpg: Output in format A6 of the file
heb2l0np.pdf, see
heb2l0n1.
ps /
txt /
pdf /
jpg
heb2: TUB-test chart heb2; Q/Fab(xr)-models for visual responses
Q/Fab(xr) with hyperbel functions e^(xr/a) and 10^(xr/a')
with contants a'=a ln(10) and a^n = a^1,0

Image heb3l0n1.jpg: Output in format A6 of the file
heb3l0np.pdf, see
heb3l0n1.
ps /
txt /
pdf /
jpg
heb3: TUB-test chart heb3; Special colourimetric properties
of colour vision and image technology; Comparison of CIELAB and
IECsRGB: triangle lightness, contrast and sensitivity
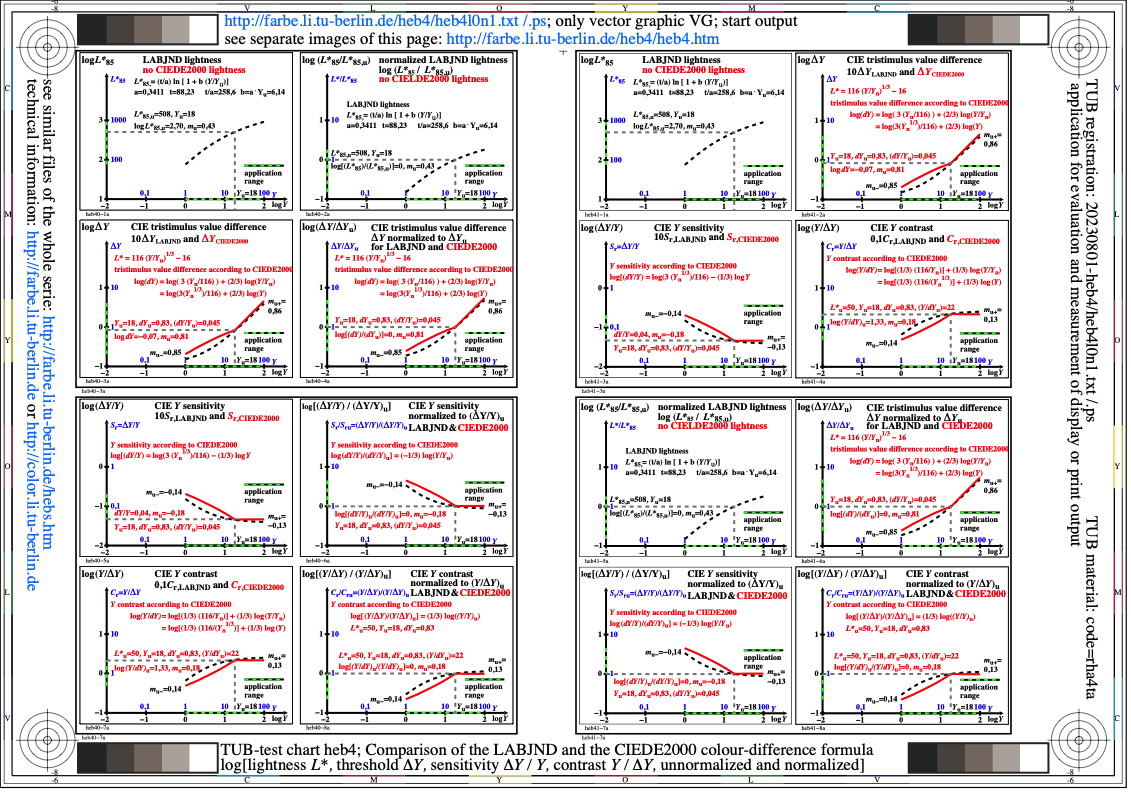
Image heb4l0n1.jpg: Output in format A6 of the file
heb4l0np.pdf, see
heb4l0n1.
ps /
txt /
pdf /
jpg
heb4: TUB-test chart heb4; Comparison of the CIELAB and
the CIEDE2000 colour difference formula; log[lightness L*,
threshold delta_Y, sensitivity delta_Y/Y, contrast Y/delta_Y]

Image heb5l0n1.jpg: Output in format A6 of the file
heb5l0np.pdf, see
heb5l0n1.
ps /
txt /
pdf /
jpg
heb5: TUB-test chart heb5; Comparison of the CIELAB and
the CIEDE2000 colour difference formula; log[lightness L*,
threshold delta_Y, sensitivity delta_Y/Y, contrast Y/delta_Y]

Image heb6l0n1.jpg: Output in format A6 of the file
heb6l0np.pdf, see
heb6l0n1.
ps /
txt /
pdf /
jpg
heb6: TUB-test chart heb6; Calculations for the CIELAB colour-
difference formula, see ISO/CIE 11664-4, log[lightness L*,
threshold delta_Y, sensitivity delta_Y/Y, contrast Y/delta_Y]

Image heb7l0n1.jpg: Output in format A6 of the file
heb7l0np.pdf, see
heb7l0n1.
ps /
txt /
pdf /
jpg
heb7: TUB-test chart heb7; Calculations for the LABJND colour-
difference formula, see CIE 230:2019, log[lightness L*,
threshold delta_Y, sensitivity delta_Y/Y, contrast Y/delta_Y]

Image heb8l0n1.jpg: Output in format A6 of the file
heb8l0np.pdf, see
heb8l0n1.
ps /
txt /
pdf /
jpg
heb8: TUB-test chart heb8; Calculations for the CIELAB colour-
difference formula, see ISO/CIE 11664-4, linear[lightness L*,
threshold delta_Y, sensitivity delta_Y/Y, contrast Y/delta_Y]

Image heb9l0n1.jpg: Output in format A6 of the file
heb9l0np.pdf, see
heb9l0n1.
ps /
txt /
pdf /
jpg
heb9: TUB-test chart heb9; Calculations for the LABJND colour-
difference formula, see CIE 230:2019, linear[lightness L*,
threshold delta_Y, sensitivity delta_Y/Y, contrast Y/delta_Y]

Image hec0l0n1.jpg: Output in format A6 of the file
hec0l0np.pdf, see
hec0l0n1.
ps /
txt /
pdf /
jpg
hec0: TUB-test chart hec0; EPS-example code of
EPS images, see EPS code FLVGL and FLVLF in
http://color.li.tu-berlin.de/hec0/hec0l0np.txt and /hecs.htm

Image hec1l0n1.jpg: Output in format A6 of the file
hec1l0np.pdf, see
hec1l0n1.
ps /
txt /
pdf /
jpg
hec1: TUB-test chart hec1; EPS-example code of
EPS images, see EPS code FLVGL in
http://color.li.tu-berlin.de/hec0/hec0l0np.txt and /hecs.htm

Image hec2l0n1.jpg: Output in format A6 of the file
hec2l0np.pdf, see
hec2l0n1.
ps /
txt /
pdf /
jpg
hec2: TUB-test chart hec2; EPS-example code of
EPS images, see EPS code FLVGL in
http://color.li.tu-berlin.de/hec0/hec0l0np.txt and /hecs.htm

Image hec3l0n1.jpg: Output in format A6 of the file
hec3l0np.pdf, see
hec3l0n1.
ps /
txt /
pdf /
jpg
hec3: TUB-test chart hec3; EPS-example code of
EPS images, see EPS code FLVLF in
http://color.li.tu-berlin.de/hec0/hec0l0np.txt and /hecs.htm

Image hec4l0n1.jpg: Output in format A6 of the file
hec4l0np.pdf, see
hec4l0n1.
ps /
txt /
pdf /
jpg
hec4: TUB-test chart hec4; EPS-example code of
EPS images, see EPS code FLVLF in
http://color.li.tu-berlin.de/hec0/hec0l0np.txt and /hecs.htm

Image hec5l0n1.jpg: Output in format A6 of the file
hec5l0np.pdf, see
hec5l0n1.
ps /
txt /
pdf /
jpg
hec5: TUB-test chart hec5; CIELAB & TUBsRGB-colour difference
see ISO/CIE 11664-4 & TUBsRGB, ln, log and lin[lightness L*,
threshold deltaY, sensitivity deltaY/Y, contrast Y/deltaY]

Image hec6l0n1.jpg: Output in format A6 of the file
hec6l0np.pdf, see
hec6l0n1.
ps /
txt /
pdf /
jpg
hec6: TUB-test chart hec6; LABJND & CIELAB-colour difference
see CIE 230:2019 & ISO/CIE 11664-4, log and lin[lightness L*,
threshold deltaY, sensitivity deltaY/Y, contrast Y/deltaY]

Image hec7l0n1.jpg: Output in format A6 of the file
hec7l0np.pdf, see
hec7l0n1.
ps /
txt /
pdf /
jpg
hec7: TUB-test chart hec7; LABJND & IECsRGB-colour difference
see CIE 230:2019 & IECsRGB, log and lin[lightness L*,
threshold deltaY, sensitivity deltaY/Y, contrast Y/deltaY]

Image hec8l0n1.jpg: Output in format A6 of the file
hec8l0np.pdf, see
hec8l0n1.
ps /
txt /
pdf /
jpg
hec8: TUB-test chart hec8; CIELAB & IECsRGB-colour difference
see ISO/CIE 11664-4 & IEC 61966-2-1, log and lin[lightness L*,
threshold deltaY, sensitivity deltaY/Y, contrast Y/deltaY]

Image hec9l0n1.jpg: Output in format A6 of the file
hec9l0np.pdf, see
hec9l0n1.
ps /
txt /
pdf /
jpg
hec9: TUB-test chart hec9; IECsRGB & TUBsRGB-colour difference
see IEC 61966-2-1 & TUBsRGB, log and lin[lightness L*,
threshold deltaY, sensitivity deltaY/Y, contrast Y/deltaY]

Image hed0l0n1.jpg: Output in format A6 of the file
hed0l0np.pdf, see
hed0l0n1.
ps /
txt /
pdf /
jpg
hed0: TUB-test chart hed0; adjacent grey samples
for visual interval scaling, evaluation of N-W with
3, 5, and 9 steps, output (rgb*)^0,5 & manuel, surround U=N08w

Image hed1l0n1.jpg: Output in format A6 of the file
hed1l0np.pdf, see
hed1l0n1.
ps /
txt /
pdf /
jpg
hed1: TUB-test chart hed1; separate grey samples
for visual interval scaling, evaluation of N-W with
3, 5, and 9 steps, output (rgb*)^0,5 & manuel, surround U=N08w

Image hed2l0n1.jpg: Output in format A6 of the file
hed2l0np.pdf, see
hed2l0n1.
ps /
txt /
pdf /
jpg
hed2: TUB-test chart hed2; adjacent grey samples
for visual interval scaling, evaluation of N-W with
3, 5, and 9 steps, output (rgb*)^0,5 & manuel, surround U=N08w

Image hed3l0n1.jpg: Output in format A6 of the file
hed3l0np.pdf, see
hed3l0n1.
ps /
txt /
pdf /
jpg
hed3: TUB-test chart hed3; separate grey samples
for visual interval scaling, evaluation of N-W with
3, 5, and 9 steps, output (rgb*)^0,5 & manuel, surround U=N08w

Image hed4l0n1.jpg: Output in format A6 of the file
hed4l0np.pdf, see
hed4l0n1.
ps /
txt /
pdf /
jpg
hed4: TUB-test chart hed4; adjacent grey samples
for visual interval scaling, evaluation of N-W with
3, 5, and 9 steps, output (rgb*)^1,0 & manuel, surround U=N08w

Image hed5l0n1.jpg: Output in format A6 of the file
hed5l0np.pdf, see
hed5l0n1.
ps /
txt /
pdf /
jpg
hed5: TUB-test chart hed5; separate grey samples
for visual interval scaling, evaluation of N-W with
3, 5, and 9 steps, output (rgb*)^1,0 & manuel, surround U=N08w

Image hed6l0n1.jpg: Output in format A6 of the file
hed6l0np.pdf, see
hed6l0n1.
ps /
txt /
pdf /
jpg
hed6: TUB-test chart hed6; adjacent grey samples
for visual interval scaling, evaluation of N-W with
3, 5, and 9 steps, output (rgb*)^0,75 & manuel, surround U=N08w

Image hed7l0n1.jpg: Output in format A6 of the file
hed7l0np.pdf, see
hed7l0n1.
ps /
txt /
pdf /
jpg
hed7: TUB-test chart hed7; separate grey samples
for visual interval scaling, evaluation of N-W with
3, 5, and 9 steps, output (rgb*)^0,75 & manuel, surround U=N08w

Image hed8l0n1.jpg: Output in format A6 of the file
hed8l0np.pdf, see
hed8l0n1.
ps /
txt /
pdf /
jpg
hed8: TUB-test chart hed8; adjacent grey samples
for visual interval scaling, evaluation of N-W with
3, 5, and 9 steps, output (rgb*)^0,5 & manuel, surround U=N08w

Image hed9l0n1.jpg: Output in format A6 of the file
hed9l0np.pdf, see
hed9l0n1.
ps /
txt /
pdf /
jpg
hed9: TUB-test chart hed9; separate grey samples
for visual interval scaling, evaluation of N-W with
3, 5, and 9 steps, output (rgb*)^0,5 & manuel, surround U=N08w

Image hee0l0n1.jpg: Output in format A6 of the file
hee0l0np.pdf, see
hee0l0n1.
ps /
txt /
pdf /
jpg
hee0: TUB-test chart hee0; adjacent grey samples
for visual interval scaling, evaluation of N-W with
3, 5, and 9 steps, output (rgb*)^0,5 & manuel, surround U=N08w

Image hee1l0n1.jpg: Output in format A6 of the file
hee1l0np.pdf, see
hee1l0n1.
ps /
txt /
pdf /
jpg
hee1: TUB-test chart hee1; separate grey samples
for visual interval scaling, evaluation of N-W with
3, 5, and 9 steps, output (rgb*)^0,5 & manuel, surround U=N08w

Image hee2l0n1.jpg: Output in format A6 of the file
hee2l0np.pdf, see
hee2l0n1.
ps /
txt /
pdf /
jpg
hee2: TUB-test chart hee2; adjacent grey samples
for visual interval scaling, evaluation of N-W with
3, 5, and 9 steps, output (rgb*)^0,5 & manuel, surround U=N08w

Image hee3l0n1.jpg: Output in format A6 of the file
hee3l0np.pdf, see
hee3l0n1.
ps /
txt /
pdf /
jpg
hee3: TUB-test chart hee3; separate grey samples
for visual interval scaling, evaluation of N-W with
3, 5, and 9 steps, output (rgb*)^0,5 & manuel, surround U=N08w

Image hee4l0n1.jpg: Output in format A6 of the file
hee4l0np.pdf, see
hee4l0n1.
ps /
txt /
pdf /
jpg
hee4: TUB-test chart hee4; adjacent grey samples
for visual interval scaling, evaluation of N-W with
3, 5, and 9 steps, output (rgb*)^1,0 & manuel, surround U=N08w

Image hee5l0n1.jpg: Output in format A6 of the file
hee5l0np.pdf, see
hee5l0n1.
ps /
txt /
pdf /
jpg
hee5: TUB-test chart hee5; separate grey samples
for visual interval scaling, evaluation of N-W with
3, 5, and 9 steps, output (rgb*)^1,0 & manuel, surround U=N08w

Image hee6l0n1.jpg: Output in format A6 of the file
hee6l0np.pdf, see
hee6l0n1.
ps /
txt /
pdf /
jpg
hee6: TUB-test chart hee6; adjacent grey samples
for visual interval scaling, evaluation of N-W with
3, 5, and 9 steps, output (rgb*)^0,75 & manuel, surround U=N08w

Image hee7l0n1.jpg: Output in format A6 of the file
hee7l0np.pdf, see
hee7l0n1.
ps /
txt /
pdf /
jpg
hee7: TUB-test chart hee7; separate grey samples
for visual interval scaling, evaluation of N-W with
3, 5, and 9 steps, output (rgb*)^0,75 & manuel, surround U=N08w
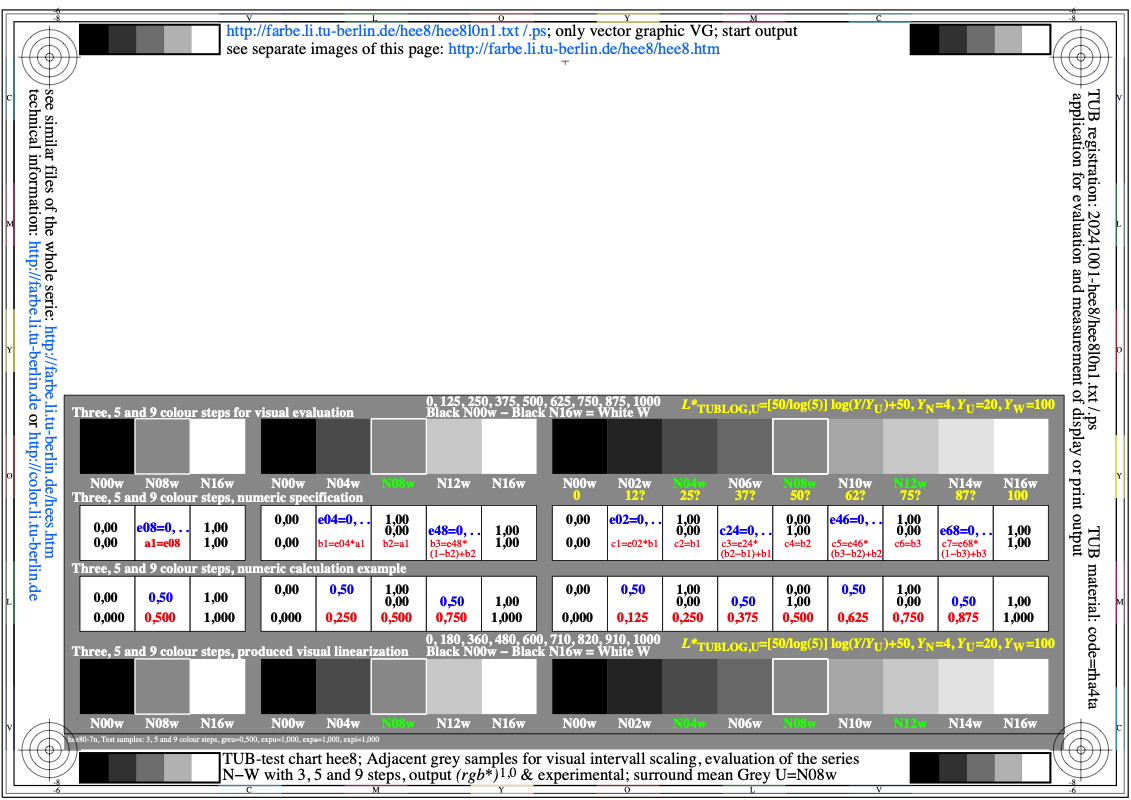
Image hee8l0n1.jpg: Output in format A6 of the file
hee8l0np.pdf, see
hee8l0n1.
ps /
txt /
pdf /
jpg
hee8: TUB-test chart hee8; adjacent grey samples
for visual interval scaling, evaluation of N-W with
3, 5, and 9 steps, output (rgb*)^0,5 & manuel, surround U=N08w

Image hee9l0n1.jpg: Output in format A6 of the file
hee9l0np.pdf, see
hee9l0n1.
ps /
txt /
pdf /
jpg
hee9: TUB-test chart hee9; separate grey samples
for visual interval scaling, evaluation of N-W with
3, 5, and 9 steps, output (rgb*)^0,5 & manuel, surround U=N08w

Image hef0l0n1.jpg: Output in format A6 of the file
hef0l0np.pdf, see
hef0l0n1.
ps /
txt /
pdf /
jpg
hef0: TUB-test chart hef0; adjacent grey samples
for visual interval scaling, evaluation of N-W with
3, 5, and 9 steps, data (rgb*)^1 & manu_a1, surround U=N08w

Image hef1l0n1.jpg: Output in format A6 of the file
hef1l0np.pdf, see
hef1l0n1.
ps /
txt /
pdf /
jpg
hef1: TUB-test chart hef1; separate grey samples
for visual interval scaling, evaluation of N-W with
3, 5, and 9 steps, data (rgb*)^1 & manu_s1, surround U=N08w
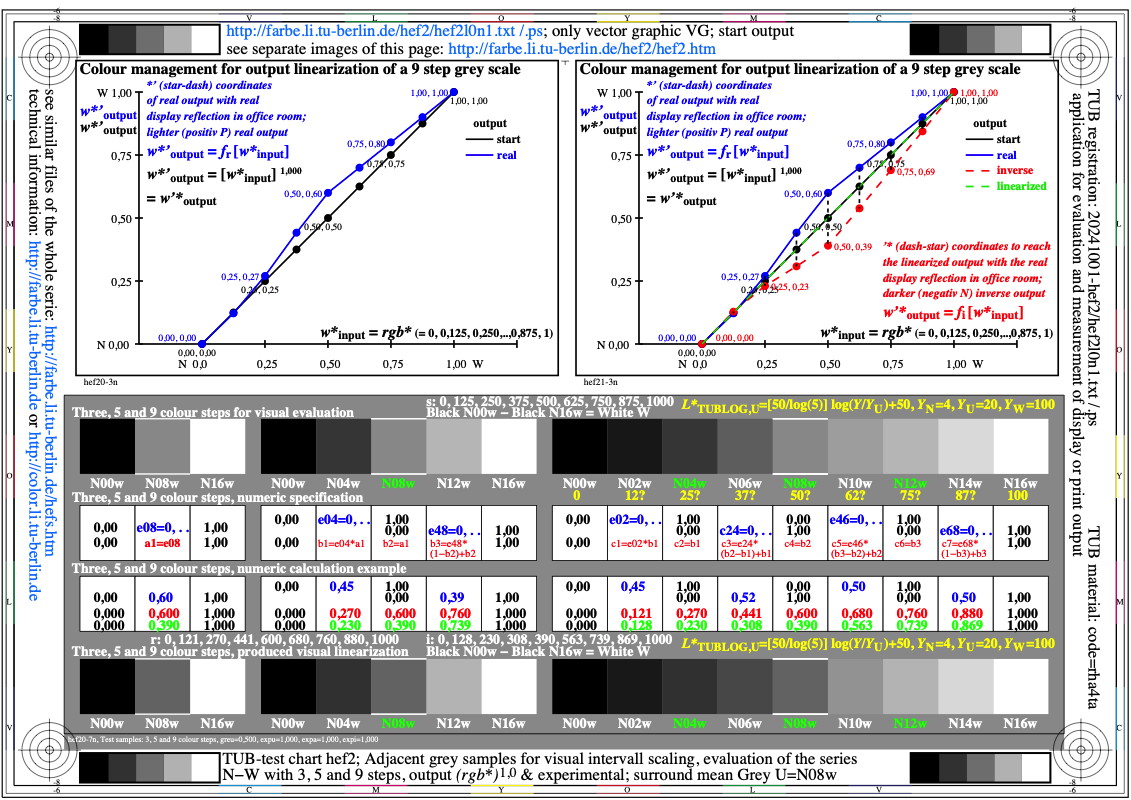
Image hef2l0n1.jpg: Output in format A6 of the file
hef2l0np.pdf, see
hef2l0n1.
ps /
txt /
pdf /
jpg
hef2: TUB-test chart hef2; adjacent grey samples
for visual interval scaling, evaluation of N-W with
3, 5, and 9 steps, out1 (rgb*)^1 & manu_a1, surround U=N08w

Image hef3l0n1.jpg: Output in format A6 of the file
hef3l0np.pdf, see
hef3l0n1.
ps /
txt /
pdf /
jpg
hef3: TUB-test chart hef3; separate grey samples
for visual interval scaling, evaluation of N-W with
3, 5, and 9 steps, out1 (rgb*)^1 & manu_s1, surround U=N08w

Image hef4l0n1.jpg: Output in format A6 of the file
hef4l0np.pdf, see
hef4l0n1.
ps /
txt /
pdf /
jpg
hef4: TUB-test chart hef4; adjacent grey samples
for visual interval scaling, evaluation of N-W with
3, 5, and 9 steps, data1 (rgb*)^1 & manu_a1, surround U=N08w

Image hef5l0n1.jpg: Output in format A6 of the file
hef5l0np.pdf, see
hef5l0n1.
ps /
txt /
pdf /
jpg
hef5: TUB-test chart hef5; separate grey samples
for visual interval scaling, evaluation of N-W with
3, 5, and 9 steps, data1 (rgb*)^1 & manu_s1, surround U=N08w

Image hef6l0n1.jpg: Output in format A6 of the file
hef6l0np.pdf, see
hef6l0n1.
ps /
txt /
pdf /
jpg
hef6: TUB-test chart hef6; adjacent grey samples
for visual interval scaling, evaluation of N-W with
3, 5, and 9 steps, out1 (rgb*)^1 & manu_a1, surround U=N08w

Image hef7l0n1.jpg: Output in format A6 of the file
hef7l0np.pdf, see
hef7l0n1.
ps /
txt /
pdf /
jpg
hef7: TUB-test chart hef7; separate grey samples
for visual interval scaling, evaluation of N-W with
3, 5, and 9 steps, out1 (rgb*)^1 & manu_s1, surround U=N08w

Image hef8l0n1.jpg: Output in format A6 of the file
hef8l0np.pdf, see
hef8l0n1.
ps /
txt /
pdf /
jpg
hef8: TUB-test chart hef8; adjacent grey samples
for visual interval scaling, evaluation of N-W with
3, 5, and 9 steps, out2 (rgb*)^1 & manu_a2, surround U=N08w

Image hef9l0n1.jpg: Output in format A6 of the file
hef9l0np.pdf, see
hef9l0n1.
ps /
txt /
pdf /
jpg
hef9: TUB-test chart hef9; separate grey samples
for visual interval scaling, evaluation of N-W with
3, 5, and 9 steps, out2 (rgb*)^1 & manu_s2, surround U=N08w

Image heg0l0n1.jpg: Output in format A6 of the file
heg0l0np.pdf, see
heg0l0n1.
ps /
txt /
pdf /
jpg
heg0: TUB-test chart heg0; adjacent (a) and separate (s) samples
N-W for visual interval scaling of 3, 5, and 9 steps
output without data a&s, (rgb*)^1 & manuel, surround U=N08w

Image heg1l0n1.jpg: Output in format A6 of the file
heg1l0np.pdf, see
heg1l0n1.
ps /
txt /
pdf /
jpg
heg1: TUB-test chart heg1; adjacent (a) and separate (s) samples
N-W for visual interval scaling of 3, 5, and 9 steps
output with data a&s, (rgb*)^1 & manuel, surround U=N08w

Image heg2l0n1.jpg: Output in format A6 of the file
heg2l0np.pdf, see
heg2l0n1.
ps /
txt /
pdf /
jpg
heg2: TUB-test chart heg2; adjacent (a) samples
N-W for visual interval scaling of 3, 5, and 9 steps
with data & graphic a, (rgb*)^1 & manuel, surround U=N08w

Image heg3l0n1.jpg: Output in format A6 of the file
heg3l0np.pdf, see
heg3l0n1.
ps /
txt /
pdf /
jpg
heg3: TUB-test chart heg3; adjacent (a) samples
N-W for visual interval scaling of 3, 5, and 9 steps
with graphic a, (rgb*)^1 & manuel, surround U=N08w

Image heg4l0n1.jpg: Output in format A6 of the file
heg4l0np.pdf, see
heg4l0n1.
ps /
txt /
pdf /
jpg
heg4: TUB-test chart heg4; separate (s) samples
N-W for visual interval scaling of 3, 5, and 9 steps
with graphic s, (rgb*)^1 & manuel, surround U=N08w

Image heg5l0n1.jpg: Output in format A6 of the file
heg5l0np.pdf, see
heg5l0n1.
ps /
txt /
pdf /
jpg
heg5: TUB-test chart heg5; separate grey samples
for visual interval scaling, evaluation of N-W with
3, 5, and 9 steps, data1 (rgb*)^1 & manu_s1, surround U=N08w

Image heg6l0n1.jpg: Output in format A6 of the file
heg6l0np.pdf, see
heg6l0n1.
ps /
txt /
pdf /
jpg
heg6: TUB-test chart heg6; adjacent grey samples
for visual interval scaling, evaluation of N-W with
3, 5, and 9 steps, out1 (rgb*)^1 & manu_a1, surround U=N08w

Image heg7l0n1.jpg: Output in format A6 of the file
heg7l0np.pdf, see
heg7l0n1.
ps /
txt /
pdf /
jpg
heg7: TUB-test chart heg7; separate grey samples
for visual interval scaling, evaluation of N-W with
3, 5, and 9 steps, out1 (rgb*)^1 & manu_s1, surround U=N08w

Image heg8l0n1.jpg: Output in format A6 of the file
heg8l0np.pdf, see
heg8l0n1.
ps /
txt /
pdf /
jpg
heg8: TUB-test chart heg8; adjacent grey samples
for visual interval scaling, evaluation of N-W with
3, 5, and 9 steps, out2 (rgb*)^1 & manu_a2, surround U=N08w
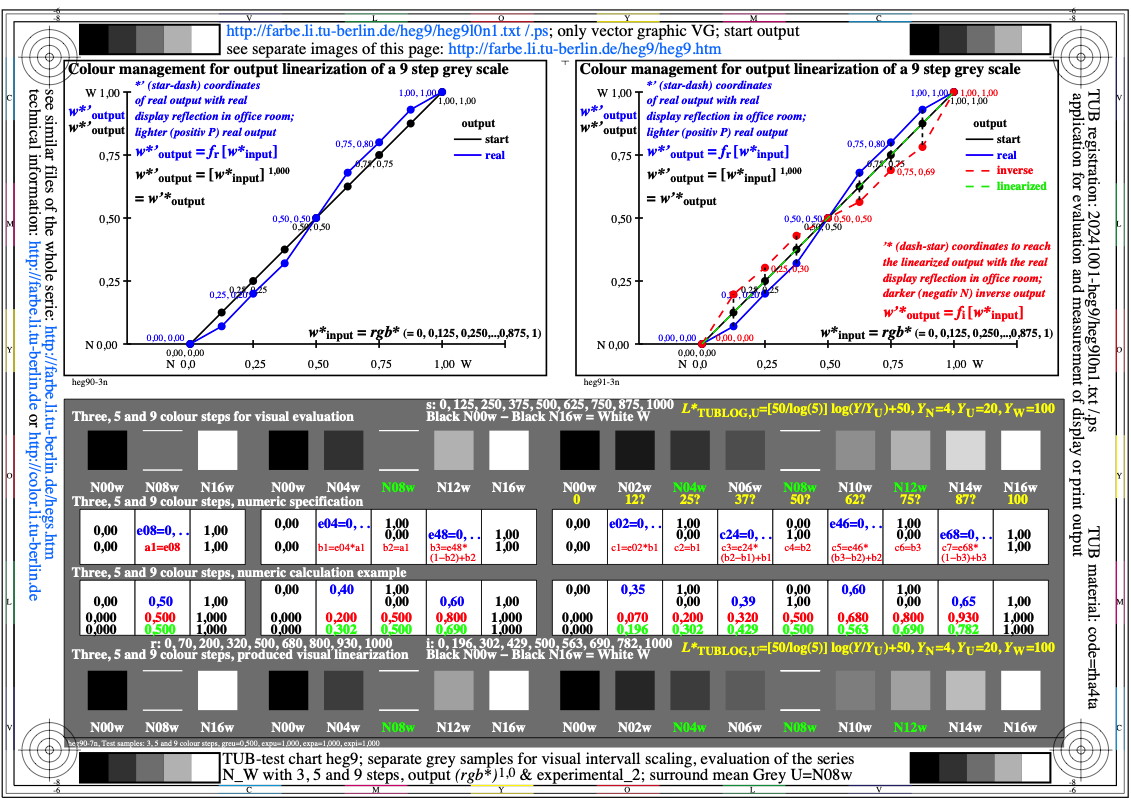
Image heg9l0n1.jpg: Output in format A6 of the file
heg9l0np.pdf, see
heg9l0n1.
ps /
txt /
pdf /
jpg
heg9: TUB-test chart heg9; separate grey samples
for visual interval scaling, evaluation of N-W with
3, 5, and 9 steps, out2 (rgb*)^1 & manu_s2, surround U=N08w

Image heh0l0n1.jpg: Output in format A6 of the file
heh0l0np.pdf, see
heh0l0n1.
ps /
txt /
pdf /
jpg
heh0: TUB-test chart heh0; adjacent (a) and separate (s) samples
N-R for visual interval scaling of 3, 5, and 9 steps
output without data a&s, (rgb*)^1 & manuel, surround U=N08w

Image heh1l0n1.jpg: Output in format A6 of the file
heh1l0np.pdf, see
heh1l0n1.
ps /
txt /
pdf /
jpg
heh1: TUB-test chart heh1; adjacent (a) and separate (s) samples
N-R for visual interval scaling of 3, 5, and 9 steps
output with data a&s, (rgb*)^1 & manuel, surround U=N08w

Image heh2l0n1.jpg: Output in format A6 of the file
heh2l0np.pdf, see
heh2l0n1.
ps /
txt /
pdf /
jpg
heh2: TUB-test chart heh2; adjacent (a) samples
N-R for visual interval scaling of 3, 5, and 9 steps
with data & graphic a, (rgb*)^1 & manuel, surround U=N08w

Image heh3l0n1.jpg: Output in format A6 of the file
heh3l0np.pdf, see
heh3l0n1.
ps /
txt /
pdf /
jpg
heh3: TUB-test chart heh3; adjacent (a) samples
N-R for visual interval scaling of 3, 5, and 9 steps
with graphic a, (rgb*)^1 & manuel, surround U=N08w

Image heh4l0n1.jpg: Output in format A6 of the file
heh4l0np.pdf, see
heh4l0n1.
ps /
txt /
pdf /
jpg
heh4: TUB-test chart heh4; separate (s) samples
N-R for visual interval scaling of 3, 5, and 9 steps
with graphic s, (rgb*)^1 & manuel, surround U=N08w

Image heh5l0n1.jpg: Output in format A6 of the file
heh5l0np.pdf, see
heh5l0n1.
ps /
txt /
pdf /
jpg
heh5: TUB-test chart heh5; adjacent (a) and separate (s) samples
N-G for visual interval scaling of 3, 5, and 9 steps
output without data a&s, (rgb*)^1 & manuel, surround U=N08w

Image heh6l0n1.jpg: Output in format A6 of the file
heh6l0np.pdf, see
heh6l0n1.
ps /
txt /
pdf /
jpg
heh6: TUB-test chart heh6; adjacent (a) and separate (s) samples
N-G for visual interval scaling of 3, 5, and 9 steps
output with data a&s, (rgb*)^1 & manuel, surround U=N08w

Image heh7l0n1.jpg: Output in format A6 of the file
heh7l0np.pdf, see
heh7l0n1.
ps /
txt /
pdf /
jpg
heh7: TUB-test chart heh7; adjacent (a) samples
N-G for visual interval scaling of 3, 5, and 9 steps
with data & graphic a, (rgb*)^1 & manuel, surround U=N08w

Image heh8l0n1.jpg: Output in format A6 of the file
heh8l0np.pdf, see
heh8l0n1.
ps /
txt /
pdf /
jpg
heh8: TUB-test chart heh8; adjacent (a) samples
N-G for visual interval scaling of 3, 5, and 9 steps
with graphic a, (rgb*)^1 & manuel, surround U=N08w

Image heh9l0n1.jpg: Output in format A6 of the file
heh9l0np.pdf, see
heh9l0n1.
ps /
txt /
pdf /
jpg
heh9: TUB-test chart heh9; separate (s) samples
N-G for visual interval scaling of 3, 5, and 9 steps
with graphic s, (rgb*)^1 & manuel, surround U=N08w

Image hei0l0n1.jpg: Output in format A6 of the file
hei0l0np.pdf, see
hei0l0n1.
ps /
txt /
pdf /
jpg
hei0: TUB-test chart hei0; adjacent (a) and separate (s) samples
N-B for visual interval scaling of 3, 5, and 9 steps
output without data a&s, (rgb*)^1 & manuel, surround U=N08w

Image hei1l0n1.jpg: Output in format A6 of the file
hei1l0np.pdf, see
hei1l0n1.
ps /
txt /
pdf /
jpg
hei1: TUB-test chart hei1; adjacent (a) and separate (s) samples
N-B for visual interval scaling of 3, 5, and 9 steps
output with data a&s, (rgb*)^1 & manuel, surround U=N08w

Image hei2l0n1.jpg: Output in format A6 of the file
hei2l0np.pdf, see
hei2l0n1.
ps /
txt /
pdf /
jpg
hei2: TUB-test chart hei2; adjacent (a) samples
N-B for visual interval scaling of 3, 5, and 9 steps
with data & graphic a, (rgb*)^1 & manuel, surround U=N08w

Image hei3l0n1.jpg: Output in format A6 of the file
hei3l0np.pdf, see
hei3l0n1.
ps /
txt /
pdf /
jpg
hei3: TUB-test chart hei3; adjacent (a) samples
N-B for visual interval scaling of 3, 5, and 9 steps
with graphic a, (rgb*)^1 & manuel, surround U=N08w

Image hei4l0n1.jpg: Output in format A6 of the file
hei4l0np.pdf, see
hei4l0n1.
ps /
txt /
pdf /
jpg
hei4: TUB-test chart hei4; separate (s) samples
N-B for visual interval scaling of 3, 5, and 9 steps
with graphic s, (rgb*)^1 & manuel, surround U=N08w

Image hei5l0n1.jpg: Output in format A6 of the file
hei5l0np.pdf, see
hei5l0n1.
ps /
txt /
pdf /
jpg
hei5: TUB-test chart hei5; adjacent (a) and separate (s) samples
N-C for visual interval scaling of 3, 5, and 9 steps
output without data a&s, (rgb*)^1 & manuel, surround U=N08w

Image hei6l0n1.jpg: Output in format A6 of the file
hei6l0np.pdf, see
hei6l0n1.
ps /
txt /
pdf /
jpg
hei6: TUB-test chart hei6; adjacent (a) and separate (s) samples
N-C for visual interval scaling of 3, 5, and 9 steps
output with data a&s, (rgb*)^1 & manuel, surround U=N08w

Image hei7l0n1.jpg: Output in format A6 of the file
hei7l0np.pdf, see
hei7l0n1.
ps /
txt /
pdf /
jpg
hei7: TUB-test chart hei7; adjacent (a) samples
N-C for visual interval scaling of 3, 5, and 9 steps
with data & graphic a, (rgb*)^1 & manuel, surround U=N08w

Image hei8l0n1.jpg: Output in format A6 of the file
hei8l0np.pdf, see
hei8l0n1.
ps /
txt /
pdf /
jpg
hei8: TUB-test chart hei8; adjacent (a) samples
N-C for visual interval scaling of 3, 5, and 9 steps
with graphic a, (rgb*)^1 & manuel, surround U=N08w

Image hei9l0n1.jpg: Output in format A6 of the file
hei9l0np.pdf, see
hei9l0n1.
ps /
txt /
pdf /
jpg
hei9: TUB-test chart hei9; separate (s) samples
N-C for visual interval scaling of 3, 5, and 9 steps
with graphic s, (rgb*)^1 & manuel, surround U=N08w

Image hej0l0n1.jpg: Output in format A6 of the file
hej0l0np.pdf, see
hej0l0n1.
ps /
txt /
pdf /
jpg
hej0: TUB-test chart hej0; adjacent (a) and separate (s) samples
N-M for visual interval scaling of 3, 5, and 9 steps
output without data a&s, (rgb*)^1 & manuel, surround U=N08w

Image hej1l0n1.jpg: Output in format A6 of the file
hej1l0np.pdf, see
hej1l0n1.
ps /
txt /
pdf /
jpg
hej1: TUB-test chart hej1; adjacent (a) and separate (s) samples
N-M for visual interval scaling of 3, 5, and 9 steps
output with data a&s, (rgb*)^1 & manuel, surround U=N08w

Image hej2l0n1.jpg: Output in format A6 of the file
hej2l0np.pdf, see
hej2l0n1.
ps /
txt /
pdf /
jpg
hej2: TUB-test chart hej2; adjacent (a) samples
N-M for visual interval scaling of 3, 5, and 9 steps
with data & graphic a, (rgb*)^1 & manuel, surround U=N08w

Image hej3l0n1.jpg: Output in format A6 of the file
hej3l0np.pdf, see
hej3l0n1.
ps /
txt /
pdf /
jpg
hej3: TUB-test chart hej3; adjacent (a) samples
N-M for visual interval scaling of 3, 5, and 9 steps
with graphic a, (rgb*)^1 & manuel, surround U=N08w

Image hej4l0n1.jpg: Output in format A6 of the file
hej4l0np.pdf, see
hej4l0n1.
ps /
txt /
pdf /
jpg
hej4: TUB-test chart hej4; separate (s) samples
N-M for visual interval scaling of 3, 5, and 9 steps
with graphic s, (rgb*)^1 & manuel, surround U=N08w

Image hej5l0n1.jpg: Output in format A6 of the file
hej5l0np.pdf, see
hej5l0n1.
ps /
txt /
pdf /
jpg
hej5: TUB-test chart hej5; adjacent (a) and separate (s) samples
N-Y for visual interval scaling of 3, 5, and 9 steps
output without data a&s, (rgb*)^1 & manuel, surround U=N08w

Image hej6l0n1.jpg: Output in format A6 of the file
hej6l0np.pdf, see
hej6l0n1.
ps /
txt /
pdf /
jpg
hej6: TUB-test chart hej6; adjacent (a) and separate (s) samples
N-Y for visual interval scaling of 3, 5, and 9 steps
output with data a&s, (rgb*)^1 & manuel, surround U=N08w

Image hej7l0n1.jpg: Output in format A6 of the file
hej7l0np.pdf, see
hej7l0n1.
ps /
txt /
pdf /
jpg
hej7: TUB-test chart hej7; adjacent (a) samples
N-Y for visual interval scaling of 3, 5, and 9 steps
with data & graphic a, (rgb*)^1 & manuel, surround U=N08w

Image hej8l0n1.jpg: Output in format A6 of the file
hej8l0np.pdf, see
hej8l0n1.
ps /
txt /
pdf /
jpg
hej8: TUB-test chart hej8; adjacent (a) samples
N-Y for visual interval scaling of 3, 5, and 9 steps
with graphic a, (rgb*)^1 & manuel, surround U=N08w

Image hej9l0n1.jpg: Output in format A6 of the file
hej9l0np.pdf, see
hej9l0n1.
ps /
txt /
pdf /
jpg
hej9: TUB-test chart hej9; separate (s) samples
N-Y for visual interval scaling of 3, 5, and 9 steps
with graphic s, (rgb*)^1 & manuel, surround U=N08w

Image hek0l0n1.jpg: Output in format A6 of the file
hek0l0np.pdf, see
hek0l0n1.
ps /
txt /
pdf /
jpg
hek0: TUB-test chart hek0; adjacent (a) and separate (s) samples
R-W for visual interval scaling of 3, 5, and 9 steps
output without data a&s, (rgb*)^1 & manuel, surround U=N08w

Image hek1l0n1.jpg: Output in format A6 of the file
hek1l0np.pdf, see
hek1l0n1.
ps /
txt /
pdf /
jpg
hek1: TUB-test chart hek1; adjacent (a) and separate (s) samples
R-W for visual interval scaling of 3, 5, and 9 steps
output with data a&s, (rgb*)^1 & manuel, surround U=N08w

Image hek2l0n1.jpg: Output in format A6 of the file
hek2l0np.pdf, see
hek2l0n1.
ps /
txt /
pdf /
jpg
hek2: TUB-test chart hek2; adjacent (a) samples
R-W for visual interval scaling of 3, 5, and 9 steps
with data & graphic a, (rgb*)^1 & manuel, surround U=N08w
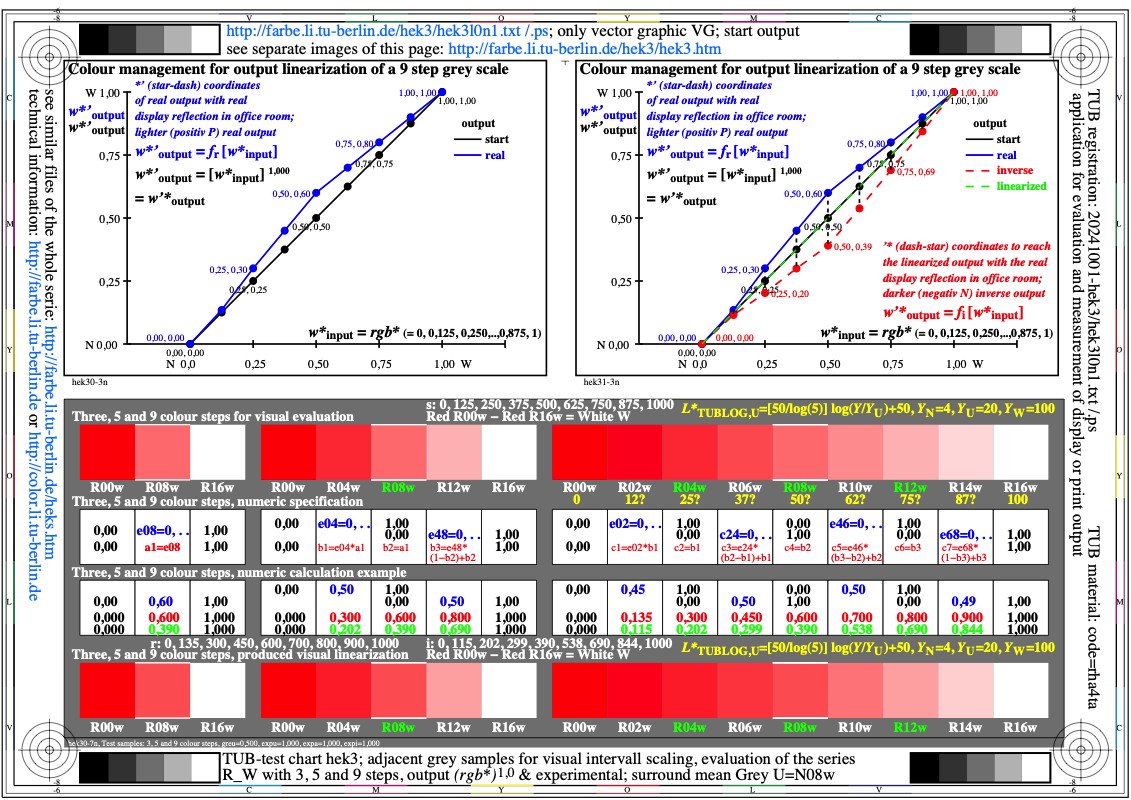
Image hek3l0n1.jpg: Output in format A6 of the file
hek3l0np.pdf, see
hek3l0n1.
ps /
txt /
pdf /
jpg
hek3: TUB-test chart hek3; adjacent (a) samples
R-W for visual interval scaling of 3, 5, and 9 steps
with graphic a, (rgb*)^1 & manuel, surround U=N08w

Image hek4l0n1.jpg: Output in format A6 of the file
hek4l0np.pdf, see
hek4l0n1.
ps /
txt /
pdf /
jpg
hek4: TUB-test chart hek4; separate (s) samples
R-W for visual interval scaling of 3, 5, and 9 steps
with graphic s, (rgb*)^1 & manuel, surround U=N08w
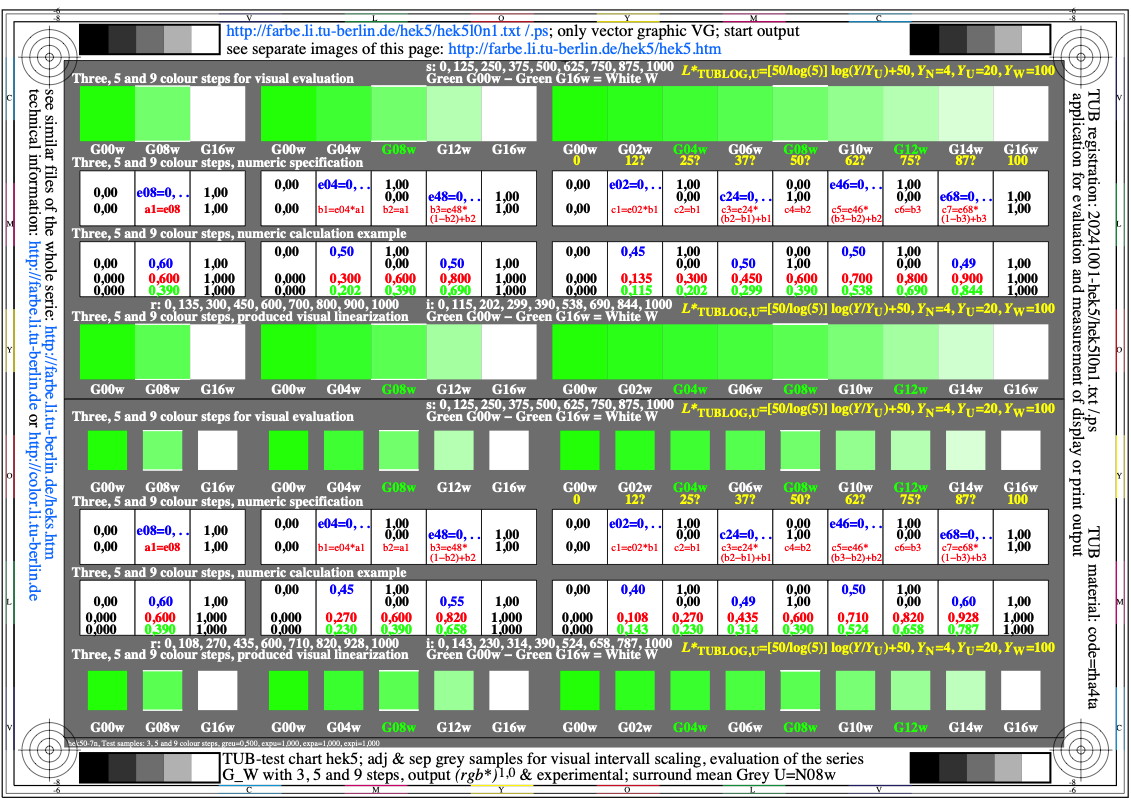
Image hek5l0n1.jpg: Output in format A6 of the file
hek5l0np.pdf, see
hek5l0n1.
ps /
txt /
pdf /
jpg
hek5: TUB-test chart hek5; adjacent (a) and separate (s) samples
G-W for visual interval scaling of 3, 5, and 9 steps
output without data a&s, (rgb*)^1 & manuel, surround U=N08w

Image hek6l0n1.jpg: Output in format A6 of the file
hek6l0np.pdf, see
hek6l0n1.
ps /
txt /
pdf /
jpg
hek6: TUB-test chart hek6; adjacent (a) and separate (s) samples
G-W for visual interval scaling of 3, 5, and 9 steps
output with data a&s, (rgb*)^1 & manuel, surround U=N08w

Image hek7l0n1.jpg: Output in format A6 of the file
hek7l0np.pdf, see
hek7l0n1.
ps /
txt /
pdf /
jpg
hek7: TUB-test chart hek7; adjacent (a) samples
G-W for visual interval scaling of 3, 5, and 9 steps
with data & graphic a, (rgb*)^1 & manuel, surround U=N08w

Image hek8l0n1.jpg: Output in format A6 of the file
hek8l0np.pdf, see
hek8l0n1.
ps /
txt /
pdf /
jpg
hek8: TUB-test chart hek8; adjacent (a) samples
G-W for visual interval scaling of 3, 5, and 9 steps
with graphic a, (rgb*)^1 & manuel, surround U=N08w

Image hek9l0n1.jpg: Output in format A6 of the file
hek9l0np.pdf, see
hek9l0n1.
ps /
txt /
pdf /
jpg
hek9: TUB-test chart hek9; separate (s) samples
G-W for visual interval scaling of 3, 5, and 9 steps
with graphic s, (rgb*)^1 & manuel, surround U=N08w

Image hel0l0n1.jpg: Output in format A6 of the file
hel0l0np.pdf, see
hel0l0n1.
ps /
txt /
pdf /
jpg
hel0: TUB-test chart hel0; adjacent (a) and separate (s) samples
B-W for visual interval scaling of 3, 5, and 9 steps
output without data a&s, (rgb*)^1 & manuel, surround U=N08w

Image hel1l0n1.jpg: Output in format A6 of the file
hel1l0np.pdf, see
hel1l0n1.
ps /
txt /
pdf /
jpg
hel1: TUB-test chart hel1; adjacent (a) and separate (s) samples
B-W for visual interval scaling of 3, 5, and 9 steps
output with data a&s, (rgb*)^1 & manuel, surround U=N08w

Image hel2l0n1.jpg: Output in format A6 of the file
hel2l0np.pdf, see
hel2l0n1.
ps /
txt /
pdf /
jpg
hel2: TUB-test chart hel2; adjacent (a) samples
B-W for visual interval scaling of 3, 5, and 9 steps
with data & graphic a, (rgb*)^1 & manuel, surround U=N08w

Image hel3l0n1.jpg: Output in format A6 of the file
hel3l0np.pdf, see
hel3l0n1.
ps /
txt /
pdf /
jpg
hel3: TUB-test chart hel3; adjacent (a) samples
B-W for visual interval scaling of 3, 5, and 9 steps
with graphic a, (rgb*)^1 & manuel, surround U=N08w

Image hel4l0n1.jpg: Output in format A6 of the file
hel4l0np.pdf, see
hel4l0n1.
ps /
txt /
pdf /
jpg
hel4: TUB-test chart hel4; separate (s) samples
B-W for visual interval scaling of 3, 5, and 9 steps
with graphic s, (rgb*)^1 & manuel, surround U=N08w

Image hel5l0n1.jpg: Output in format A6 of the file
hel5l0np.pdf, see
hel5l0n1.
ps /
txt /
pdf /
jpg
hel5: TUB-test chart hel5; adjacent (a) and separate (s) samples
C-W for visual interval scaling of 3, 5, and 9 steps
output without data a&s, (rgb*)^1 & manuel, surround U=N08w

Image hel6l0n1.jpg: Output in format A6 of the file
hel6l0np.pdf, see
hel6l0n1.
ps /
txt /
pdf /
jpg
hel6: TUB-test chart hel6; adjacent (a) and separate (s) samples
C-W for visual interval scaling of 3, 5, and 9 steps
output with data a&s, (rgb*)^1 & manuel, surround U=N08w

Image hel7l0n1.jpg: Output in format A6 of the file
hel7l0np.pdf, see
hel7l0n1.
ps /
txt /
pdf /
jpg
hel7: TUB-test chart hel7; adjacent (a) samples
C-W for visual interval scaling of 3, 5, and 9 steps
with data & graphic a, (rgb*)^1 & manuel, surround U=N08w

Image hel8l0n1.jpg: Output in format A6 of the file
hel8l0np.pdf, see
hel8l0n1.
ps /
txt /
pdf /
jpg
hel8: TUB-test chart hel8; adjacent (a) samples
C-W for visual interval scaling of 3, 5, and 9 steps
with graphic a, (rgb*)^1 & manuel, surround U=N08w

Image hel9l0n1.jpg: Output in format A6 of the file
hel9l0np.pdf, see
hel9l0n1.
ps /
txt /
pdf /
jpg
hel9: TUB-test chart hel9; separate (s) samples
C-W for visual interval scaling of 3, 5, and 9 steps
with graphic s, (rgb*)^1 & manuel, surround U=N08w

Image hem0l0n1.jpg: Output in format A6 of the file
hem0l0np.pdf, see
hem0l0n1.
ps /
txt /
pdf /
jpg
hem0: TUB-test chart hem0; adjacent (a) and separate (s) samples
M-W for visual interval scaling of 3, 5, and 9 steps
output without data a&s, (rgb*)^1 & manuel, surround U=N08w
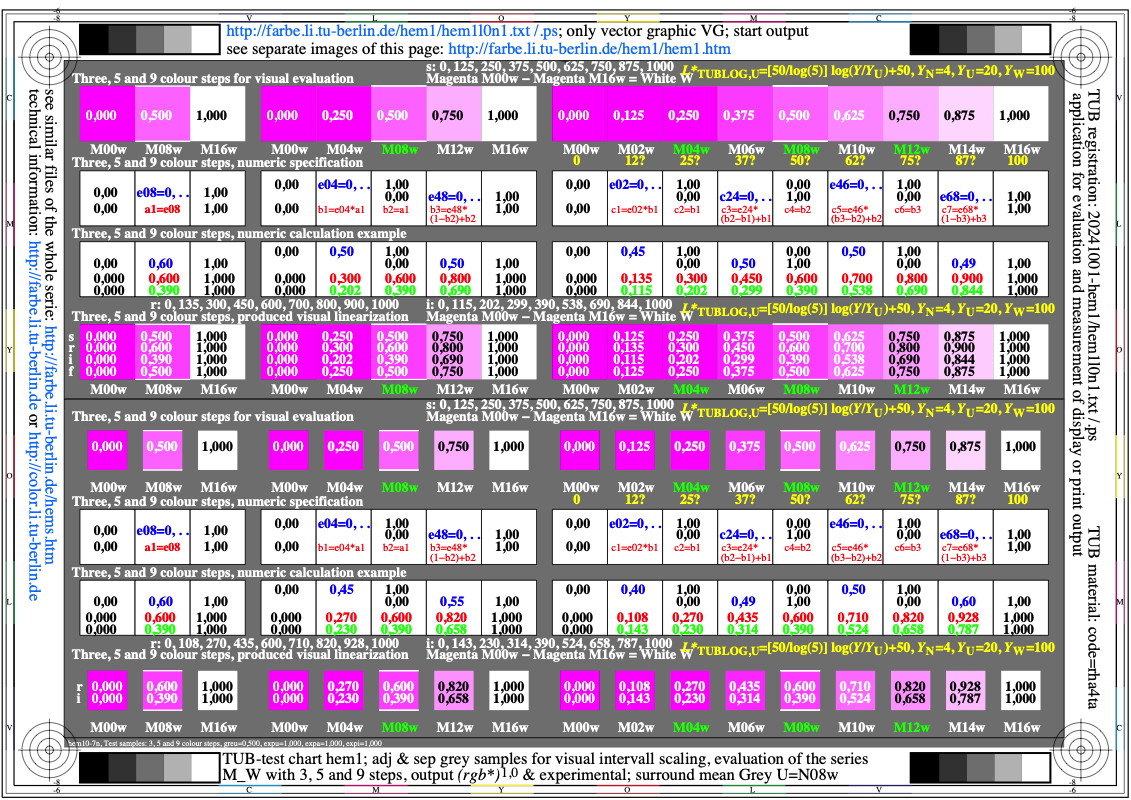
Image hem1l0n1.jpg: Output in format A6 of the file
hem1l0np.pdf, see
hem1l0n1.
ps /
txt /
pdf /
jpg
hem1: TUB-test chart hem1; adjacent (a) and separate (s) samples
M-W for visual interval scaling of 3, 5, and 9 steps
output with data a&s, (rgb*)^1 & manuel, surround U=N08w

Image hem2l0n1.jpg: Output in format A6 of the file
hem2l0np.pdf, see
hem2l0n1.
ps /
txt /
pdf /
jpg
hem2: TUB-test chart hem2; adjacent (a) samples
M-W for visual interval scaling of 3, 5, and 9 steps
with data & graphic a, (rgb*)^1 & manuel, surround U=N08w

Image hem3l0n1.jpg: Output in format A6 of the file
hem3l0np.pdf, see
hem3l0n1.
ps /
txt /
pdf /
jpg
hem3: TUB-test chart hem3; adjacent (a) samples
M-W for visual interval scaling of 3, 5, and 9 steps
with graphic a, (rgb*)^1 & manuel, surround U=N08w

Image hem4l0n1.jpg: Output in format A6 of the file
hem4l0np.pdf, see
hem4l0n1.
ps /
txt /
pdf /
jpg
hem4: TUB-test chart hem4; separate (s) samples
M-W for visual interval scaling of 3, 5, and 9 steps
with graphic s, (rgb*)^1 & manuel, surround U=N08w

Image hem5l0n1.jpg: Output in format A6 of the file
hem5l0np.pdf, see
hem5l0n1.
ps /
txt /
pdf /
jpg
hem5: TUB-test chart hem5; adjacent (a) and separate (s) samples
Y-W for visual interval scaling of 3, 5, and 9 steps
output without data a&s, (rgb*)^1 & manuel, surround U=N08w

Image hem6l0n1.jpg: Output in format A6 of the file
hem6l0np.pdf, see
hem6l0n1.
ps /
txt /
pdf /
jpg
hem6: TUB-test chart hem6; adjacent (a) and separate (s) samples
Y-W for visual interval scaling of 3, 5, and 9 steps
output with data a&s, (rgb*)^1 & manuel, surround U=N08w

Image hem7l0n1.jpg: Output in format A6 of the file
hem7l0np.pdf, see
hem7l0n1.
ps /
txt /
pdf /
jpg
hem7: TUB-test chart hem7; adjacent (a) samples
Y-W for visual interval scaling of 3, 5, and 9 steps
with data & graphic a, (rgb*)^1 & manuel, surround U=N08w

Image hem8l0n1.jpg: Output in format A6 of the file
hem8l0np.pdf, see
hem8l0n1.
ps /
txt /
pdf /
jpg
hem8: TUB-test chart hem8; adjacent (a) samples
Y-W for visual interval scaling of 3, 5, and 9 steps
with graphic a, (rgb*)^1 & manuel, surround U=N08w

Image hem9l0n1.jpg: Output in format A6 of the file
hem9l0np.pdf, see
hem9l0n1.
ps /
txt /
pdf /
jpg
hem9: TUB-test chart hem9; separate (s) samples
Y-W for visual interval scaling of 3, 5, and 9 steps
with graphic s, (rgb*)^1 & manuel, surround U=N08w

Image hen0l0n1.jpg: Output in format A6 of the file
hen0l0np.pdf, see
hen0l0n1.
ps /
txt /
pdf /
jpg
hen0: TUB-test chart hen0; HAULAB, viewing angle 120'
to 10', (Haubner, 1980) & data; lin [lightness L*,
threshold delta_Y, sensitivity delta_Y/Y, contrast Y/delta_Y]

Image hen1l0n1.jpg: Output in format A6 of the file
hen1l0np.pdf, see
hen1l0n1.
ps /
txt /
pdf /
jpg
hen1: TUB-test chart hen1; HAULAB, viewing angle 120'
to 10', (Haubner, 1980) & data; log [lightness L*,
threshold delta_Y, sensitivity delta_Y/Y, contrast Y/delta_Y]

Image hen2l0n1.jpg: Output in format A6 of the file
hen2l0np.pdf, see
hen2l0n1.
ps /
txt /
pdf /
jpg
hen2: TUB-test chart hen2; HAULAB, viewing angle 120'
to 10', (Haubner, 1980) & equations; lin [lightness L*,
threshold delta_Y, sensitivity delta_Y/Y, contrast Y/delta_Y]

Image hen3l0n1.jpg: Output in format A6 of the file
hen3l0np.pdf, see
hen3l0n1.
ps /
txt /
pdf /
jpg
hen3: TUB-test chart hen3; HAULAB, viewing angle 120'
to 10', (Haubner, 1980) & equations; log [lightness L*,
threshold delta_Y, sensitivity delta_Y/Y, contrast Y/delta_Y]
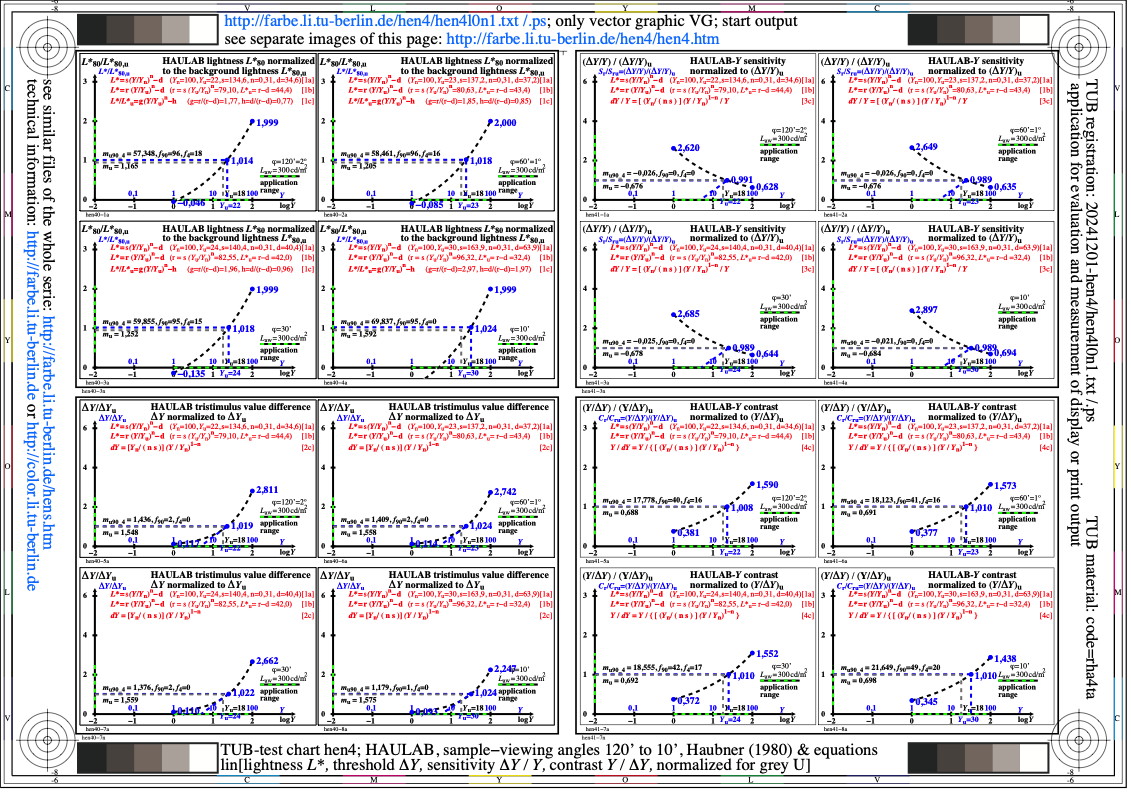
Image hen4l0n1.jpg: Output in format A6 of the file
hen4l0np.pdf, see
hen4l0n1.
ps /
txt /
pdf /
jpg
hen4: TUB-test chart hen4; HAULAB, viewing angle 120'
to 10', (Haubner, 1980) & formulae; lin [lightness L*,
threshold delta_Y, sensitivity delta_Y/Y, contrast Y/delta_Y]

Image hen5l0n1.jpg: Output in format A6 of the file
hen5l0np.pdf, see
hen5l0n1.
ps /
txt /
pdf /
jpg
hen5: TUB-test chart hen5; HAULAB, viewing angle 120'
to 10', (Haubner, 1980) & data; log [lightness L*,
threshold delta_Y, sensitivity delta_Y/Y, contrast Y/delta_Y]

Image hen6l0n1.jpg: Output in format A6 of the file
hen6l0np.pdf, see
hen6l0n1.
ps /
txt /
pdf /
jpg
hen6: TUB-test chart hen6; HAULAB, Adaptations 300, 1000, 200
& 40 cd/m^2, (Haubner, 1980) & data; lin [ligtness L*,
threshold delta_Y, sensitivity delta_Y/Y, contrast Y/delta_Y]

Image hen7l0n1.jpg: Output in format A6 of the file
hen7l0np.pdf, see
hen7l0n1.
ps /
txt /
pdf /
jpg
hen7: TUB-test chart hen7; HAULAB, Adaptations 300, 1000, 200
& 40 cd/m^2, (Haubner, 1980) & data; log [ligtness L*,
threshold delta_Y, sensitivity delta_Y/Y, contrast Y/delta_Y]

Image hen8l0n1.jpg: Output in format A6 of the file
hen8l0np.pdf, see
hen8l0n1.
ps /
txt /
pdf /
jpg
hen8: TUB-test chart hen7; HAULAB, Adaptations 300, 1000, 200
& 40 cd/m^2, (Haubner, 1980) & equations; lin [ligtness L*,
threshold delta_Y, sensitivity delta_Y/Y, contrast Y/delta_Y]

Image hen9l0n1.jpg: Output in format A6 of the file
hen9l0np.pdf, see
hen9l0n1.
ps /
txt /
pdf /
jpg
hen9: TUB-test chart hen9; HAULAB, Adaptations 300, 1000, 200
& 40 cd/m^2, (Haubner, 1980) & equations; log [ligtness L*,
threshold delta_Y, sensitivity delta_Y/Y, contrast Y/delta_Y]

Image heo0l0n1.jpg: Output in format A6 of the file
heo0l0np.pdf, see
heo0l0n1.
ps /
txt /
pdf /
jpg
heo0: TUB-test chart heo0; Formulae LABJND (CIE 230:219)
and CIELAB (ISO/CIE 11664-4), log & lin [lightness L*,
threshold delta_Y, sensitivity delta_Y/Y, contrast Y/delta_Y]

Image heo1l0n1.jpg: Output in format A6 of the file
heo1l0np.pdf, see
heo1l0n1.
ps /
txt /
pdf /
jpg
heo1: TUB-test chart heo1; Formulae LABJND (CIE 230:219)
and IECsRGB (IEC 61966-2-1), log & lin [lightness L*,
threshold delta_Y, sensitivity delta_Y/Y, contrast Y/delta_Y]

Image heo2l0n1.jpg: Output in format A6 of the file
heo2l0np.pdf, see
heo2l0n1.
ps /
txt /
pdf /
jpg
heo2: TUB-test chart heo2; Formulae LABJND (CIE 230:219)
and colour difference TUBsRGB 2025, log & lin [lightness L*,
threshold delta_Y, sensitivity delta_Y/Y, contrast Y/delta_Y]

Image heo3l0n1.jpg: Output in format A6 of the file
heo3l0np.pdf, see
heo3l0n1.
ps /
txt /
pdf /
jpg
heo3: TUB-test chart heo3; Formulae CIELAB (ISO/CIE 11664-4),
and IECsRGB (IEC 61966-2-1), log & lin [lightness L*,
threshold delta_Y, sensitivity delta_Y/Y, contrast Y/delta_Y]

Image heo4l0n1.jpg: Output in format A6 of the file
heo4l0np.pdf, see
heo4l0n1.
ps /
txt /
pdf /
jpg
heo4: TUB-test chart heo4; Formulae CIELAB (ISO/CIE 11664-4),
and colour difference TUBsRGB 2025, log & lin [lightness L*,
threshold delta_Y, sensitivity delta_Y/Y, contrast Y/delta_Y]

Image heo5l0n1.jpg: Output in format A6 of the file
heo5l0np.pdf, see
heo5l0n1.
ps /
txt /
pdf /
jpg
heo5: TUB-test chart heo5; Formulae IECsRGB (IEC 61966-2-1),
and colour difference TUBsRGB 2025, log & lin [lightness L*,
threshold delta_Y, sensitivity delta_Y/Y, contrast Y/delta_Y]

Image heo6l0n1.jpg: Output in format A6 of the file
heo6l0np.pdf, see
heo6l0n1.
ps /
txt /
pdf /
jpg
heo6: TUB-test chart heo6; HAULAB & IEC, Adaptations 300, 1000,
200 & 40 cd/m^2, (Haubner, 1980) & data; lin [ligtness L*,
threshold delta_Y, sensitivity delta_Y/Y, contrast Y/delta_Y]

Image heo7l0n1.jpg: Output in format A6 of the file
heo7l0np.pdf, see
heo7l0n1.
ps /
txt /
pdf /
jpg
heo7: TUB-test chart heo7; HAULAB & IEC, Adaptations 300, 1000,
200 & 40 cd/m^2, (Haubner, 1980) & data; log [ligtness L*,
threshold delta_Y, sensitivity delta_Y/Y, contrast Y/delta_Y]

Image heo8l0n1.jpg: Output in format A6 of the file
heo8l0np.pdf, see
heo8l0n1.
ps /
txt /
pdf /
jpg
heo8: TUB-test chart heo8; HAULAB & IEC, Adaptations 300, 1000,
200 & 40 cd/m^2, (Haubner) & equations; lin [ligtness L*,
threshold delta_Y, sensitivity delta_Y/Y, contrast Y/delta_Y]
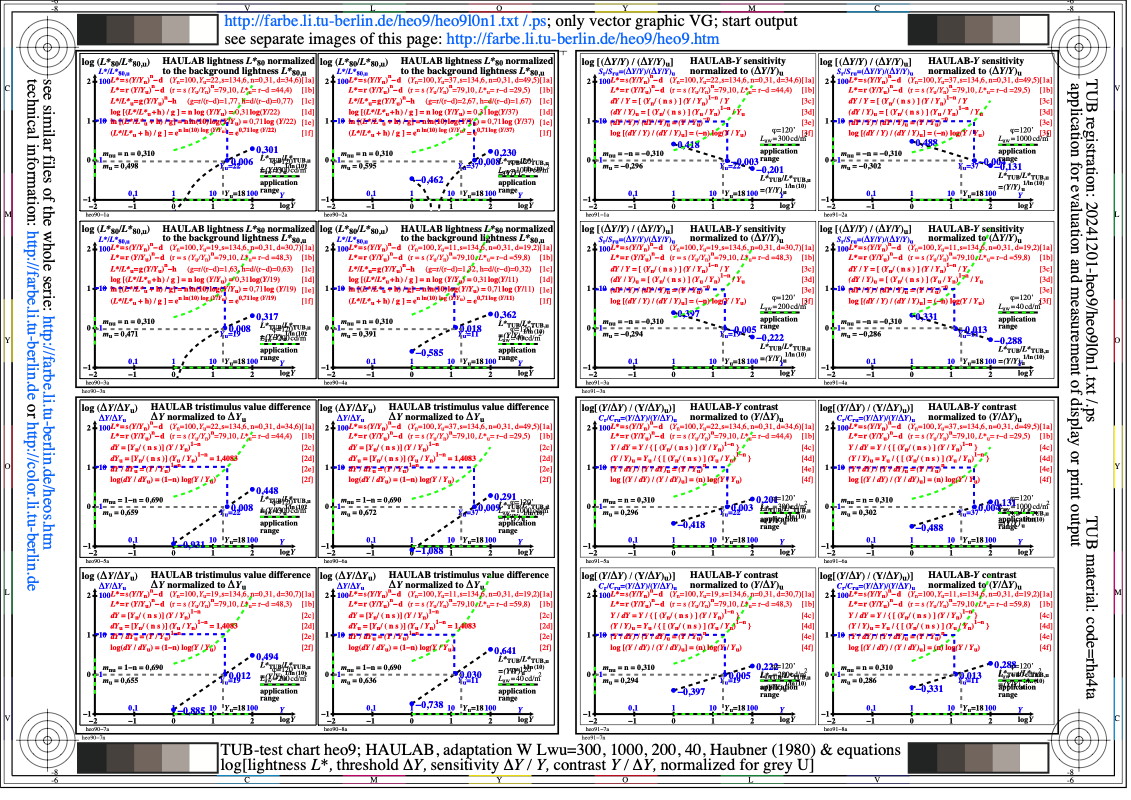
Image heo9l0n1.jpg: Output in format A6 of the file
heo9l0np.pdf, see
heo9l0n1.
ps /
txt /
pdf /
jpg
heo9: TUB-test chart heo9; HAULAB & IEC, Adaptations 300, 1000,
200 & 40 cd/m^2, (Haubner) & equations; log [ligtness L*,
threshold delta_Y, sensitivity delta_Y/Y, contrast Y/delta_Y]

Image hep0l0n1.jpg: Output in format A6 of the file
hep0l0np.pdf, see
hep0l0n1.
ps /
txt /
pdf /
jpg
hep0: TUB-test chart hep0; LABJND, CIELAB, IECsRGB, and
TUBsRGB-colour difference formulae, log & lin [lightness L*,
threshold delta_Y, sensitivity delta_Y/Y, contrast Y/delta_Y]

Image hep1l0n1.jpg: Output in format A6 of the file
hep1l0np.pdf, see
hep1l0n1.
ps /
txt /
pdf /
jpg
hep1: TUB-test chart hep1; Relationship between brightness B*T
and luminance LT as function of sample viewing angle phi
for surround luminances La=(300, 1000, 200, 40) cd/m^2

Image hep2l0n1.jpg: Output in format A6 of the file
hep2l0np.pdf, see
hep2l0n1.
ps /
txt /
pdf /
jpg
hep2: TUB-test chart hep2; LABJND, CIELAB, IECsRGB, and
TUBsRGB-colour difference formulae, log & lin [lightness L*,
threshold delta_Y, sensitivity delta_Y/Y, contrast Y/delta_Y]

Image hep3l0n1.jpg: Output in format A6 of the file
hep3l0np.pdf, see
hep3l0n1.
ps /
txt /
pdf /
jpg
hep3: TUB-test chart hep3; Formulae HAULAB, Haubner (1980)
and CIELAB (ISO/CIE 11664-4), log & lin [lightness L*,
threshold delta_Y, sensitivity delta_Y/Y, contrast Y/delta_Y]

Image hep4l0n1.jpg: Output in format A6 of the file
hep4l0np.pdf, see
hep4l0n1.
ps /
txt /
pdf /
jpg
hep4: TUB-test chart hep4; Relationship between brightness B*T
and luminance LT as function of sample viewing angle phi
for surround luminances La=(300, 1000, 200, 40) cd/m^2

Image hep5l0n1.jpg: Output in format A6 of the file
hep5l0np.pdf, see
hep5l0n1.
ps /
txt /
pdf /
jpg
hep5: TUB-test chart hep5; Relationship between brightness B*T
and luminance LT as function of sample viewing angle phi
for surround luminances La=(1000, 200, 40, 8) cd/m^2

Image hep6l0n1.jpg: Output in format A6 of the file
hep6l0np.pdf, see
hep6l0n1.
ps /
txt /
pdf /
jpg
hep6: TUB-test chart hep6; Relationship between brightness B*T
and luminance LT as function of sample viewing angle phi
for surround luminances La=(1500, 300, 30, 3) cd/m^2

Image hep7l0n1.jpg: Output in format A6 of the file
hep7l0np.pdf, see
hep7l0n1.
ps /
txt /
pdf /
jpg
hep7: TUB-test chart hep7; Formulae HAULAB, Haubner (1980)
and CIELAB (ISO/CIE 11664-4), log & lin [lightness L*,
threshold delta_Y, sensitivity delta_Y/Y, contrast Y/delta_Y]

Image hep8l0n1.jpg: Output in format A6 of the file
hep8l0np.pdf, see
hep8l0n1.
ps /
txt /
pdf /
jpg
hep8: TUB-test chart hep8; Formulae HAULAB, Haubner (1980)
and IECsRGB (IEC 61966-2-1), log & lin [lightness L*,
threshold delta_Y, sensitivity delta_Y/Y, contrast Y/delta_Y]

Image hep9l0n1.jpg: Output in format A6 of the file
hep9l0np.pdf, see
hep9l0n1.
ps /
txt /
pdf /
jpg
hep9: TUB-test chart hep9; Formulae HAULAB, Haubner (1980)
and colour difference TUBsRGB 2025, log & lin [lightness L*,
threshold delta_Y, sensitivity delta_Y/Y, contrast Y/delta_Y]

Image heq0l0n1.jpg: Output in format A6 of the file
heq0l0np.pdf, see
heq0l0n1.
ps /
txt /
pdf /
jpg
heq0: TUB-test chart heq0; Adjacent and separate colours
of nine steps with increaing luminance; output linearization
and thresholds for colour series Black N - Yellow Y
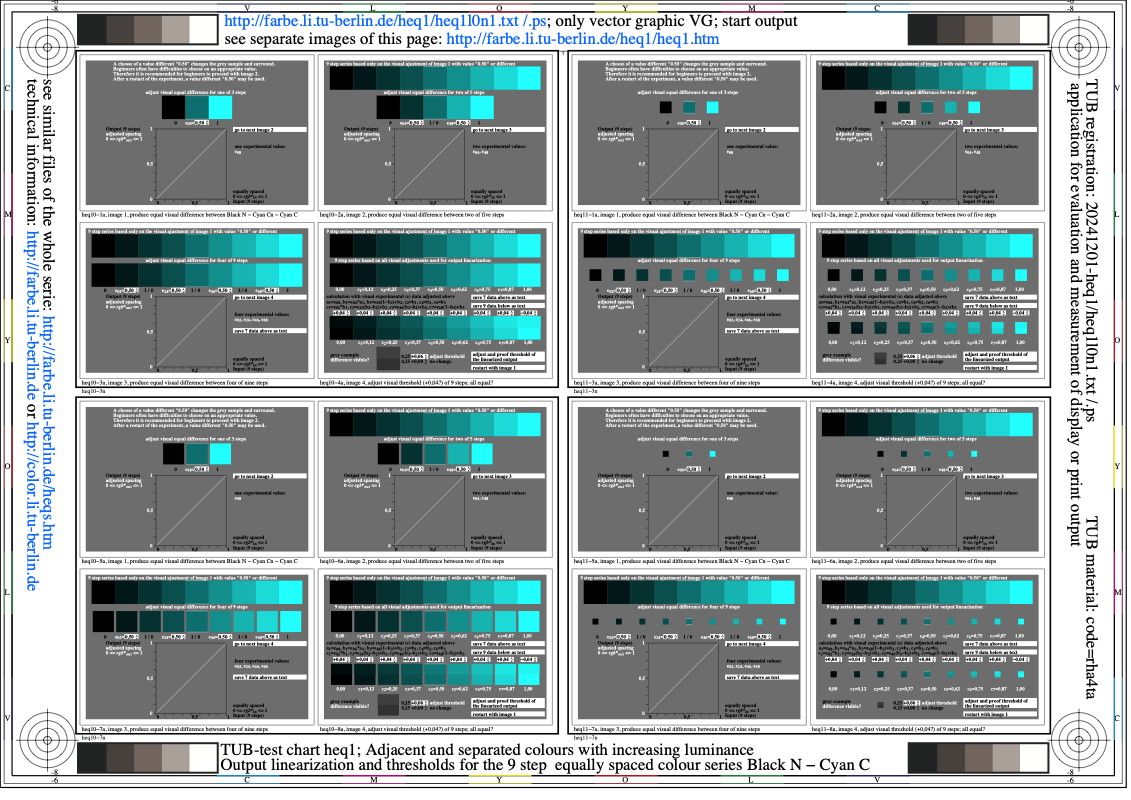
Image heq1l0n1.jpg: Output in format A6 of the file
heq1l0np.pdf, see
heq1l0n1.
ps /
txt /
pdf /
jpg
heq1: TUB-test chart heq1; Adjacent and separate colours
of nine steps with increaing luminance; output linearization
and thresholds for colour series Black N - Cyan C

Image heq2l0n1.jpg: Output in format A6 of the file
heq2l0np.pdf, see
heq2l0n1.
ps /
txt /
pdf /
jpg
heq2: TUB-test chart heq2; Adjacent and separate colours
of 9 steps with increaing luminance; output linearization
and thresholds for colour series Black N - Magenta M

Image heq3l0n1.jpg: Output in format A6 of the file
heq3l0np.pdf, see
heq3l0n1.
ps /
txt /
pdf /
jpg
heq3: TUB-test chart heq3; Adjacent and separate colours
of nine steps with increaing luminance; output linearization
and thresholds for colour series Red R - White W

Image heq4l0n1.jpg: Output in format A6 of the file
heq4l0np.pdf, see
heq4l0n1.
ps /
txt /
pdf /
jpg
heq4: TUB-test chart heq4; Adjacent and separate colours
of nine steps with increaing luminance; output linearization
and thresholds for colour series Green G - White W

Image heq5l0n1.jpg: Output in format A6 of the file
heq5l0np.pdf, see
heq5l0n1.
ps /
txt /
pdf /
jpg
heq5: TUB-test chart heq5; Adjacent and separate colours
of nine steps with increaing luminance; output linearization
and thresholds for colour series Blue B - White W
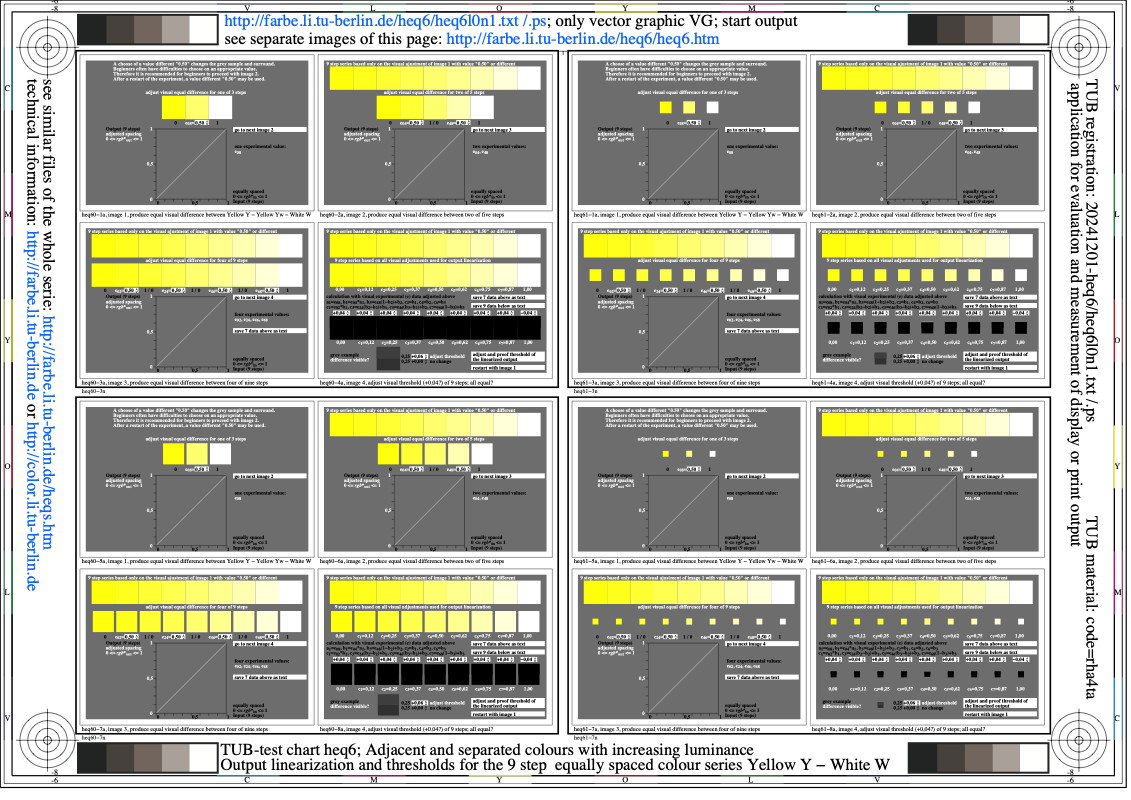
Image heq6l0n1.jpg: Output in format A6 of the file
heq6l0np.pdf, see
heq6l0n1.
ps /
txt /
pdf /
jpg
heq6: TUB-test chart heq6; Adjacent and separate colours
of 9 steps with increaing luminance; output linearization
and thresholds for colour series Yellow Y - White W

Image heq7l0n1.jpg: Output in format A6 of the file
heq7l0np.pdf, see
heq7l0n1.
ps /
txt /
pdf /
jpg
heq7: TUB-test chart heq7; Adjacent and separate colours
of nine steps with increaing luminance; output linearization
and thresholds for colour series Cyan C - White W

Image heq8l0n1.jpg: Output in format A6 of the file
heq8l0np.pdf, see
heq8l0n1.
ps /
txt /
pdf /
jpg
heq8: TUB-test chart heq8; Adjacent and separate colours
of nine steps with increaing luminance; output linearization
and thresholds for colour series Magenta M - White W

Image heq9l0n1.jpg: Output in format A6 of the file
heq9l0np.pdf, see
heq9l0n1.
ps /
txt /
pdf /
jpg
heq9: TUB-test chart heq9; Adjacent and separate colours
of nine steps with increaing luminance; output linearization
and thresholds for colour series Black N - White W

Image her0l0n1.jpg: Output in format A6 of the file
her0l0np.pdf, see
her0l0n1.
ps /
txt /
pdf /
jpg
her0: TUB-test chart her0; Achromatic receptor responses
Components of absolute and relative responses in figures
Hyperbel function equations and mathematical derivation

Image her1l0n1.jpg: Output in format A6 of the file
her1l0np.pdf, see
her1l0n1.
ps /
txt /
pdf /
jpg
her1: TUB-test chart her1; Achromatic receptor responses
Components of absolute and relative responses in figures
Hyperbel function equations and mathematical derivation

Image her2l0n1.jpg: Output in format A6 of the file
her2l0np.pdf, see
her2l0n1.
ps /
txt /
pdf /
jpg
her2: TUB-test chart her2; Achromatic receptor responses Fac(xr)
Change of derivation F'abc(xr) with parameters a and c
Model functions for approximation of experimental results

Image her3l0n1.jpg: Output in format A6 of the file
her3l0np.pdf, see
her3l0n1.
ps /
txt /
pdf /
jpg
her3: TUB-test chart her3; Fab(xr)-model for visual responses
derivation of the responses; tanh(xr) with e^xr/a and 10^xr/a'
a'=a ln(10); a^n = a^0,7; 4 x 4 images

Image her4l0n1.jpg: Output in format A6 of the file
her4l0np.pdf, see
her4l0n1.
ps /
txt /
pdf /
jpg
her4: TUB-test chart her4; Achromatic thresholds, 5 Lu & Lm on Y
thresholds delta_L (0,4s), contrast and lightness; experi-
mental data of Lingelbach and Richter with adaptation

Image her5l0n1.jpg: Output in format A6 of the file
her5l0np.pdf, see
her5l0n1.
ps /
txt /
pdf /
jpg
her5: TUB-test chart her5; Achromatic receptor response Fac(xr)
and change of derivation F'ac(xr) with parameters a and c
F'ac(xr) is approximately valid and for Lingelbach experiments
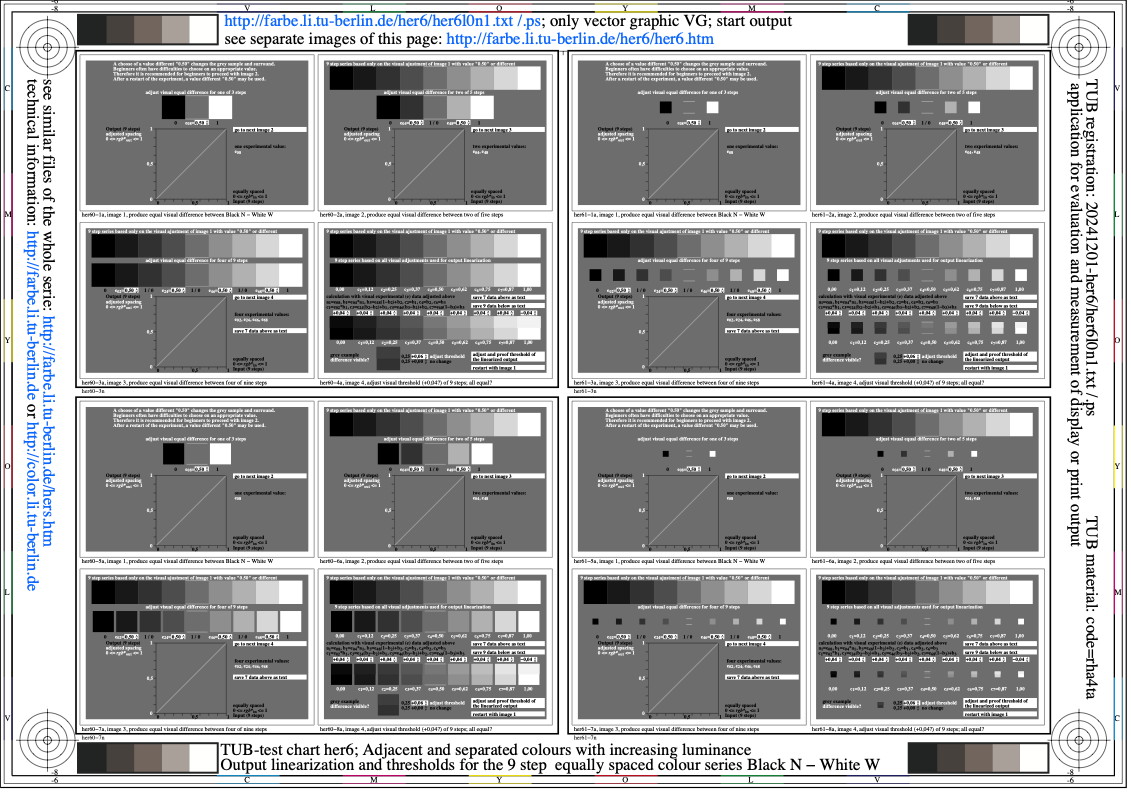
Image her6l0n1.jpg: Output in format A6 of the file
her6l0np.pdf, see
her6l0n1.
ps /
txt /
pdf /
jpg
her6: TUB-test chart her6; Adjacent and separate colours
of 9 steps with increaing luminance; output linearization
and thresholds for colour series Black N - White W

Image her7l0n1.jpg: Output in format A6 of the file
her7l0np.pdf, see
her7l0n1.
ps /
txt /
pdf /
jpg
her7: TUB-test chart her7; Adjacent and separate colours
of nine steps with increaing luminance; output linearization
and thresholds for colour series Black N - Red R

Image her8l0n1.jpg: Output in format A6 of the file
her8l0np.pdf, see
her8l0n1.
ps /
txt /
pdf /
jpg
her8: TUB-test chart her8; Adjacent and separate colours
of nine steps with increaing luminance; output linearization
and thresholds for colour series Black N - Green G

Image her9l0n1.jpg: Output in format A6 of the file
her9l0np.pdf, see
her9l0n1.
ps /
txt /
pdf /
jpg
her9: TUB-test chart her9; Adjacent and separate colours
of nine steps with increaing luminance; output linearization
and thresholds for colour series Black N - Blue B

Image hes0l0n1.jpg: Output in format A6 of the file
hes0l0np.pdf, see
hes0l0n1.
ps /
txt /
pdf /
jpg
hes0: TUB-test chart hes0; Relationship between brightness B*T
and luminance LT as function of sample viewing angle phi
for surround luminances La=(300, 1000, 200, 40) cd/m^2
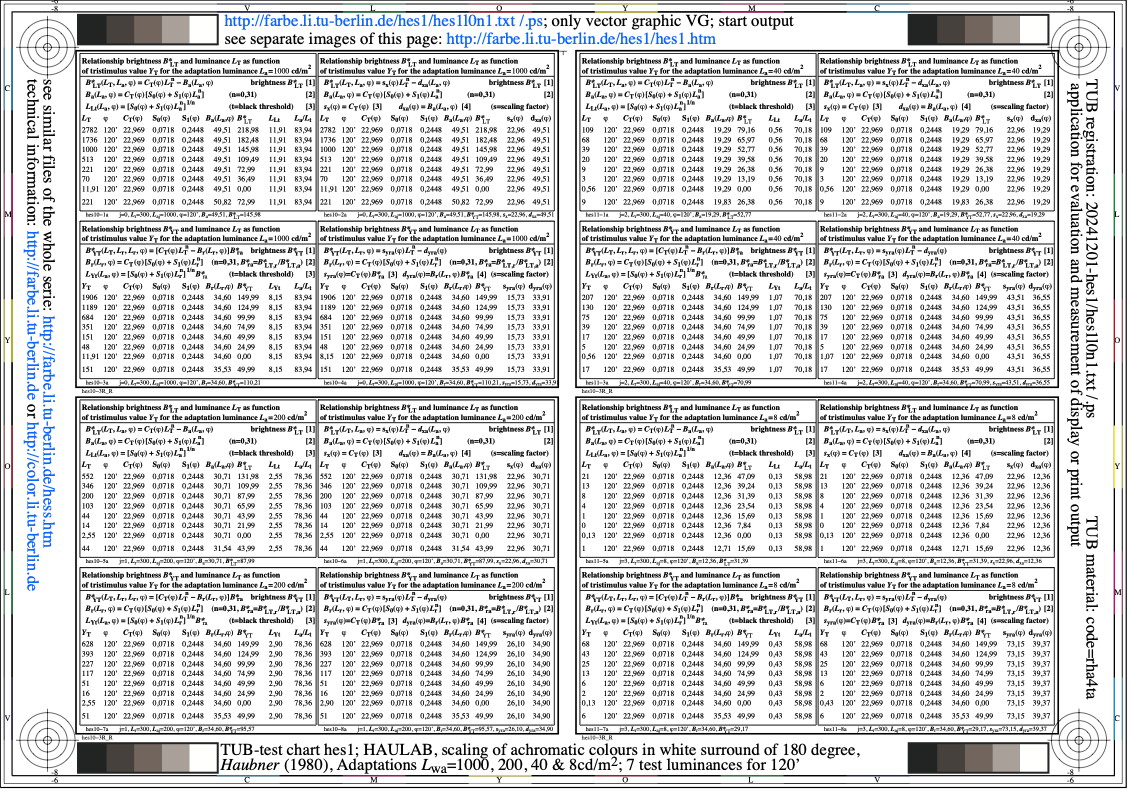
Image hes1l0n1.jpg: Output in format A6 of the file
hes1l0np.pdf, see
hes1l0n1.
ps /
txt /
pdf /
jpg
hes1: TUB-test chart hes1; Relationship between brightness B*T
and luminance LT as function of sample viewing angle phi
for surround luminances La=(1000, 200, 40, 8) cd/m^2

Image hes2l0n1.jpg: Output in format A6 of the file
hes2l0np.pdf, see
hes2l0n1.
ps /
txt /
pdf /
jpg
hes2: TUB-test chart hes2; Relationship between brightness B*T
and luminance LT as function of sample viewing angle phi
for surround luminances La=(1500, 300, 30, 3) cd/m^2

Image hes3l0n1.jpg: Output in format A6 of the file
hes3l0np.pdf, see
hes3l0n1.
ps /
txt /
pdf /
jpg
hes3: TUB-test chart hes3; Relationship between brightness B*T
and luminance LT as function of sample viewing angle phi
for surround luminances La=(300, 1000, 200, 40) cd/m^2

Image hes4l0n1.jpg: Output in format A6 of the file
hes4l0np.pdf, see
hes4l0n1.
ps /
txt /
pdf /
jpg
hes4: TUB-test chart hes4; Relationship between brightness B*T
and luminance LT as function of test sample luminance LT
for surround luminances La=(300, 1000, 200, 40) cd/m^2

Image hes5l0n1.jpg: Output in format A6 of the file
hes5l0np.pdf, see
hes5l0n1.
ps /
txt /
pdf /
jpg
hes5: TUB-test chart hes5; Relationship between brightness B*T
and luminance LT as function of sample viewing angle phi
for surround luminances La=(1000, 200, 40, 8) cd/m^2

Image hes6l0n1.jpg: Output in format A6 of the file
hes6l0np.pdf, see
hes6l0n1.
ps /
txt /
pdf /
jpg
hes6: TUB-test chart hes6; Relationship between brightness B*T
and luminance LT as function of test sample luminance LT
for surround luminances La=(1000, 200, 40, 8) cd/m^2

Image hes7l0n1.jpg: Output in format A6 of the file
hes7l0np.pdf, see
hes7l0n1.
ps /
txt /
pdf /
jpg
hes7: TUB-test chart hes7; Relationship between brightness B*T
and luminance LT as function of sample viewing angle phi
for surround luminances La=(1500, 300, 30, 3) cd/m^2

Image hes8l0n1.jpg: Output in format A6 of the file
hes8l0np.pdf, see
hes8l0n1.
ps /
txt /
pdf /
jpg
hes8: TUB-test chart hes8; Relationship between brightness B*T
and luminance LT as function of test sample luminance LT
for surround luminances La=(1500, 300, 30, 3) cd/m^2

Image hes9l0n1.jpg: Output in format A6 of the file
hes9l0np.pdf, see
hes9l0n1.
ps /
txt /
pdf /
jpg
hes9: TUB-test chart hes9; Relationship between brightness B*T
and luminance LT as function of test sample luminance LT
for surround luminances La=(1500, 300, 30, 3) cd/m^2

Image het0l0n1.jpg: Output in format A6 of the file
het0l0np.pdf, see
het0l0n1.
ps /
txt /
pdf /
jpg
het0: TUB-test chart het0; Formulae LABJND (CIE 230:219)
and CIELAB (ISO/CIE 11664-4), log & lin [lightness L*,
threshold delta_Y, sensitivity delta_Y/Y, contrast Y/delta_Y]

Image het1l0n1.jpg: Output in format A6 of the file
het1l0np.pdf, see
het1l0n1.
ps /
txt /
pdf /
jpg
het1: TUB-test chart het1; Formulae LABJND (CIE 230:219)
and IECsRGB (IEC 61966-2-1), log & lin [lightness L*,
threshold delta_Y, sensitivity delta_Y/Y, contrast Y/delta_Y]
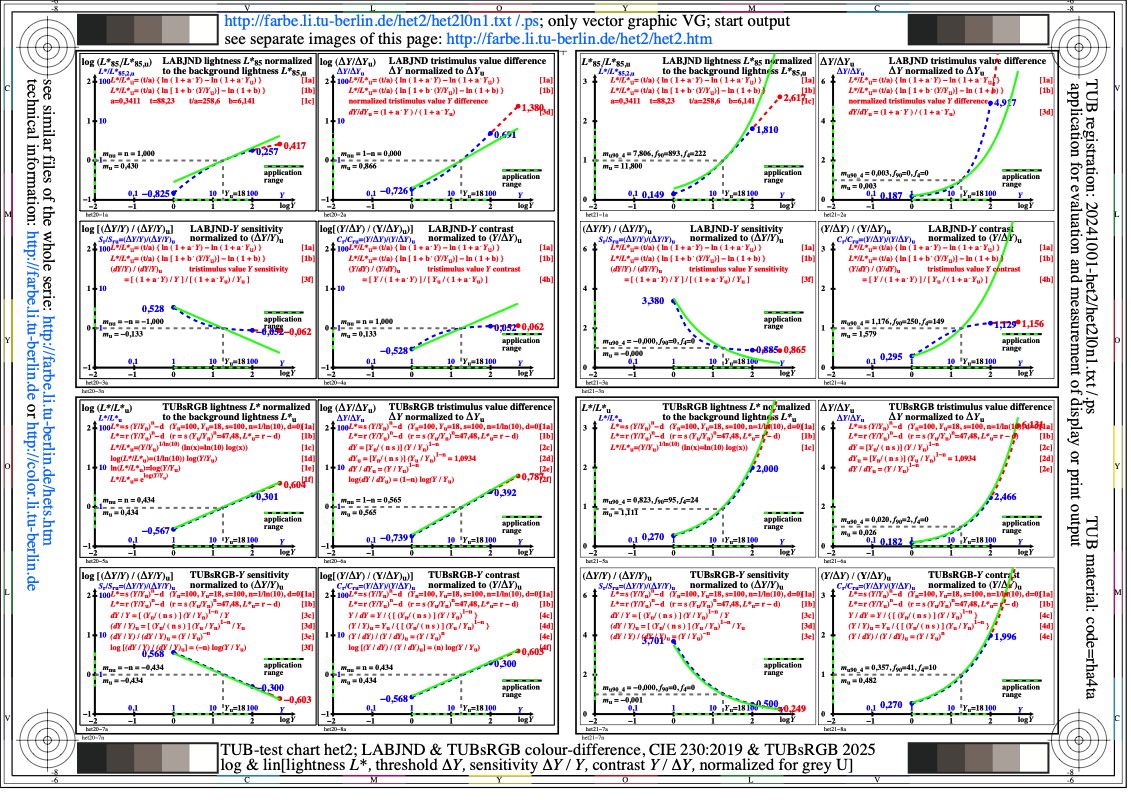
Image het2l0n1.jpg: Output in format A6 of the file
het2l0np.pdf, see
het2l0n1.
ps /
txt /
pdf /
jpg
het2: TUB-test chart het2; Formulae LABJND (CIE 230:219)
and colour difference TUBsRGB 2025, log & lin [lightness L*,
threshold delta_Y, sensitivity delta_Y/Y, contrast Y/delta_Y]

Image het3l0n1.jpg: Output in format A6 of the file
het3l0np.pdf, see
het3l0n1.
ps /
txt /
pdf /
jpg
het3: TUB-test chart het3; Formulae CIELAB (ISO/CIE 11664-4),
and IECsRGB (IEC 61966-2-1), log & lin [lightness L*,
threshold delta_Y, sensitivity delta_Y/Y, contrast Y/delta_Y]

Image het4l0n1.jpg: Output in format A6 of the file
het4l0np.pdf, see
het4l0n1.
ps /
txt /
pdf /
jpg
het4: TUB-test chart het4; Formulae CIELAB (ISO/CIE 11664-4),
and colour difference TUBsRGB 2025, log & lin [lightness L*,
threshold delta_Y, sensitivity delta_Y/Y, contrast Y/delta_Y]

Image het5l0n1.jpg: Output in format A6 of the file
het5l0np.pdf, see
het5l0n1.
ps /
txt /
pdf /
jpg
het5: TUB-test chart het5; Formulae IECsRGB (IEC 61966-2-1),
and colour difference TUBsRGB 2025, log & lin [lightness L*,
threshold delta_Y, sensitivity delta_Y/Y, contrast Y/delta_Y]

Image het6l0n1.jpg: Output in format A6 of the file
het6l0np.pdf, see
het6l0n1.
ps /
txt /
pdf /
jpg
het6: TUB-test chart het6; HAULAB & IEC, Adaptations 300, 1000,
200 & 40 cd/m^2, (Haubner, 1980) & data; lin [ligtness L*,
threshold delta_Y, sensitivity delta_Y/Y, contrast Y/delta_Y]

Image het7l0n1.jpg: Output in format A6 of the file
het7l0np.pdf, see
het7l0n1.
ps /
txt /
pdf /
jpg
het7: TUB-test chart het7; HAULAB & IEC, Adaptations 300, 1000,
200 & 40 cd/m^2, (Haubner, 1980) & data; log [ligtness L*,
threshold delta_Y, sensitivity delta_Y/Y, contrast Y/delta_Y]

Image het8l0n1.jpg: Output in format A6 of the file
het8l0np.pdf, see
het8l0n1.
ps /
txt /
pdf /
jpg
het8: TUB-test chart het8; HAULAB & IEC, Adaptations 300, 1000,
200 & 40 cd/m^2, (Haubner) & equations; lin [ligtness L*,
threshold delta_Y, sensitivity delta_Y/Y, contrast Y/delta_Y]

Image het9l0n1.jpg: Output in format A6 of the file
het9l0np.pdf, see
het9l0n1.
ps /
txt /
pdf /
jpg
het9: TUB-test chart het9; HAULAB & IEC, Adaptations 300, 1000,
200 & 40 cd/m^2, (Haubner) & equations; log [ligtness L*,
threshold delta_Y, sensitivity delta_Y/Y, contrast Y/delta_Y]

Image heu0l0n1.jpg: Output in format A6 of the file
heu0l0np.pdf, see
heu0l0n1.
ps /
txt /
pdf /
jpg
heu0: TUB-test chart heu0; TUBJND model with functions Fab, F'ab
Receptor responses R+, G-, Y+ (left & right), and derivations
R+', G-' (right) for diferent parameters a,b

Image heu1l0n1.jpg: Output in format A6 of the file
heu1l0np.pdf, see
heu1l0n1.
ps /
txt /
pdf /
jpg
heu1: TUB-test chart heu1; TUBJND model with functions Fab, F'ab
Receptor responses R+, G-, Y+ (left & right), and derivations
Y+', Y-' (left & right), and R+'/G-' (right) for a,b

Image heu2l0n1.jpg: Output in format A6 of the file
heu2l0np.pdf, see
heu2l0n1.
ps /
txt /
pdf /
jpg
heu2: TUB-test chart heu2; TUBJND model with functions Fab, F'ab
Receptor responses R+, G-, Y+ (left & right), and derivations
R+', G-' (right) for diferent parameters a,b

Image heu3l0n1.jpg: Output in format A6 of the file
heu3l0np.pdf, see
heu3l0n1.
ps /
txt /
pdf /
jpg
heu3: TUB-test chart heu3; TUBJND model with functions Fab, F'ab
Receptor responses R+, G-, Y+ (left & right), and derivations
Y+', Y-' (left & right), and R+'/G-' (right) for a,b

Image heu4l0n1.jpg: Output in format A6 of the file
heu4l0np.pdf, see
heu4l0n1.
ps /
txt /
pdf /
jpg
heu4: TUB-test chart heu4; TUBJND model with functions Fab, F'ab
Receptor responses R+, G-, Y+ (left & right), and derivations
R+', G-' (right) for diferent parameters a,b
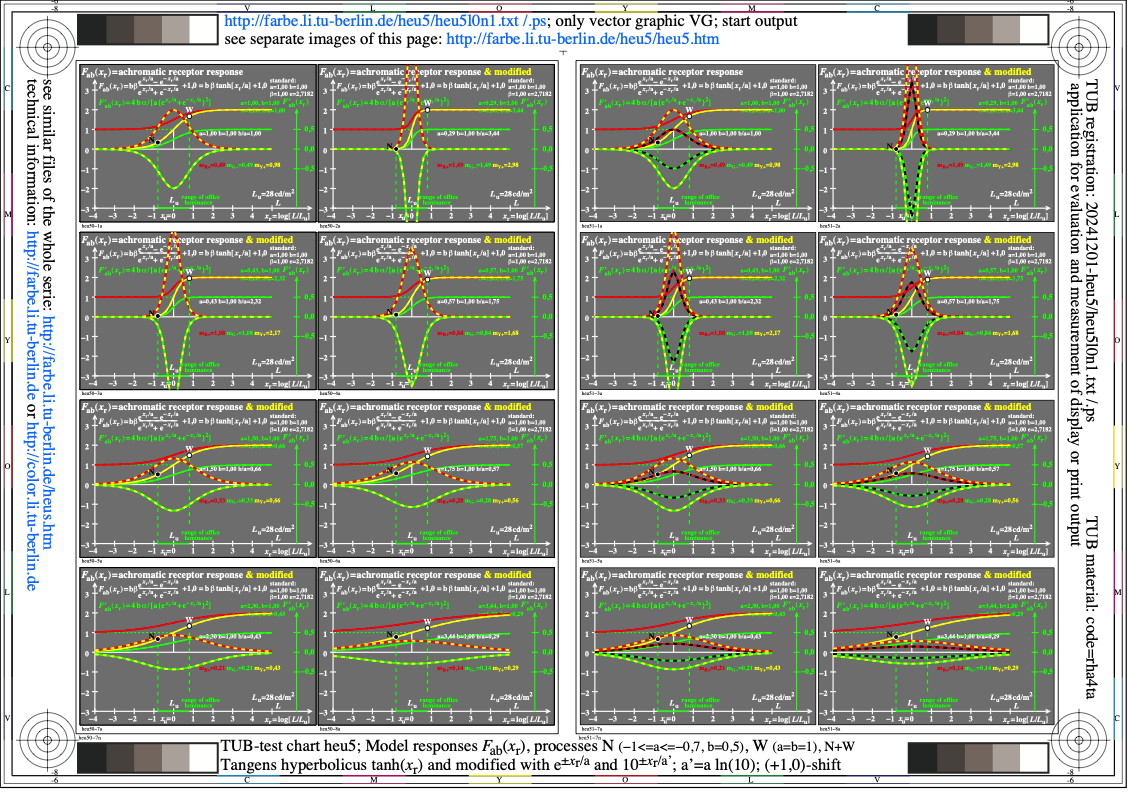
Image heu5l0n1.jpg: Output in format A6 of the file
heu5l0np.pdf, see
heu5l0n1.
ps /
txt /
pdf /
jpg
heu5: TUB-test chart heu5; TUBJND model with functions Fab, F'ab
Receptor responses R+, G-, Y+ (left & right), and derivations
Y+', Y-' (left & right), and R+'/G-' (right) for a,b

Image heu6l0n1.jpg: Output in format A6 of the file
heu6l0np.pdf, see
heu6l0n1.
ps /
txt /
pdf /
jpg
heu6: TUB-test chart heu6; HAULAB & IEC, Adaptations 300, 1000,
200 & 40 cd/m^2, (Haubner, 1980) & data; lin [ligtness L*,
threshold delta_Y, sensitivity delta_Y/Y, contrast Y/delta_Y]

Image heu7l0n1.jpg: Output in format A6 of the file
heu7l0np.pdf, see
heu7l0n1.
ps /
txt /
pdf /
jpg
heu7: TUB-test chart heu7; HAULAB & IEC, Adaptations 300, 1000,
200 & 40 cd/m^2, (Haubner, 1980) & data; log [ligtness L*,
threshold delta_Y, sensitivity delta_Y/Y, contrast Y/delta_Y]

Image heu8l0n1.jpg: Output in format A6 of the file
heu8l0np.pdf, see
heu8l0n1.
ps /
txt /
pdf /
jpg
heu8: TUB-test chart heu8; HAULAB & IEC, Adaptations 300, 1000,
200 & 40 cd/m^2, (Haubner) & equations; lin [ligtness L*,
threshold delta_Y, sensitivity delta_Y/Y, contrast Y/delta_Y]

Image heu9l0n1.jpg: Output in format A6 of the file
heu9l0np.pdf, see
heu9l0n1.
ps /
txt /
pdf /
jpg
heu9: TUB-test chart heu9; HAULAB & IEC, Adaptations 300, 1000,
200 & 40 cd/m^2, (Haubner) & equations; log [ligtness L*,
threshold delta_Y, sensitivity delta_Y/Y, contrast Y/delta_Y]

Image hev0l0n1.jpg: Output in format A6 of the file
hev0l0np.pdf, see
hev0l0n1.
ps /
txt /
pdf /
jpg
hev0: TUB-test chart hev0; TUBJND model with functions Fab, F'ab
Receptor responses R+, G-, Y+ (left & right), and derivations
R+', G-' (right) for diferent parameters a,b

Image hev1l0n1.jpg: Output in format A6 of the file
hev1l0np.pdf, see
hev1l0n1.
ps /
txt /
pdf /
jpg
hev1: TUB-test chart hev1; TUBJND model with functions Fab, F'ab
Receptor responses R+, G-, Y+ (left & right), and derivations
Y+', Y-' (left & right), and R+'/G-' (right) for a,b

Image hev2l0n1.jpg: Output in format A6 of the file
hev2l0np.pdf, see
hev2l0n1.
ps /
txt /
pdf /
jpg
hev2: TUB-test chart hev2; Fab(xr)-model for visual responses
derivation of the responses; tanh(xr) with e^xr/a and 10^xr/a'
a'=a ln(10); a^n = a^0,5; 4 x 4 images

Image hev3l0n1.jpg: Output in format A6 of the file
hev3l0np.pdf, see
hev3l0n1.
ps /
txt /
pdf /
jpg
hev3: TUB-test chart hev3; Fab(xr)-model for visual responses
derivation of the responses; tanh(xr) with e^xr/a and 10^xr/a'
a'=a ln(10); a^n = a^1,0; 4 x 4 images

Image hev4l0n1.jpg: Output in format A6 of the file
hev4l0np.pdf, see
hev4l0n1.
ps /
txt /
pdf /
jpg
hev4: TUB-test chart hev4; Fab(xr)-model for visual responses
derivation of the responses; tanh(xr) with e^xr/a and 10^xr/a'
a'=a ln(10); a^n = a^0,7; 4 x 4 images

Image hev5l0n1.jpg: Output in format A6 of the file
hev5l0np.pdf, see
hev5l0n1.
ps /
txt /
pdf /
jpg
hev5: TUB-test chart hev5; Fab(xr)-model for visual responses
derivation of the responses; tanh(xr) with e^xr/a and 10^xr/a'
a'=a ln(10); a^n = a^0,5; 4 x 4 images

Image hev6l0n1.jpg: Output in format A6 of the file
hev6l0np.pdf, see
hev6l0n1.
ps /
txt /
pdf /
jpg
hev6: TUB-test chart hev6; HAULAB & IEC, Adaptations 300, 1000,
200 & 40 cd/m^2, (Haubner, 1980) & data; lin [ligtness L*,
threshold delta_Y, sensitivity delta_Y/Y, contrast Y/delta_Y]

Image hev7l0n1.jpg: Output in format A6 of the file
hev7l0np.pdf, see
hev7l0n1.
ps /
txt /
pdf /
jpg
hev7: TUB-test chart hev7; HAULAB & IEC, Adaptations 300, 1000,
200 & 40 cd/m^2, (Haubner, 1980) & data; log [ligtness L*,
threshold delta_Y, sensitivity delta_Y/Y, contrast Y/delta_Y]

Image hev8l0n1.jpg: Output in format A6 of the file
hev8l0np.pdf, see
hev8l0n1.
ps /
txt /
pdf /
jpg
hev8: TUB-test chart hev8; HAULAB & IEC, Adaptations 300, 1000,
200 & 40 cd/m^2, (Haubner) & equations; lin [ligtness L*,
threshold delta_Y, sensitivity delta_Y/Y, contrast Y/delta_Y]

Image hev9l0n1.jpg: Output in format A6 of the file
hev9l0np.pdf, see
hev9l0n1.
ps /
txt /
pdf /
jpg
hev9: TUB-test chart hev9; HAULAB & IEC, Adaptations 300, 1000,
200 & 40 cd/m^2, (Haubner) & equations; log [ligtness L*,
threshold delta_Y, sensitivity delta_Y/Y, contrast Y/delta_Y]

Image hew0l0n1.jpg: Output in format A6 of the file
hew0l0np.pdf, see
hew0l0n1.
ps /
txt /
pdf /
jpg
hew0: TUB-test chart hew0; TUBJND model with functions Fab, F'ab
Receptor responses R+, G-, Y+ (left & right), and derivations
R+', G-' (right) for diferent parameters a,b

Image hew1l0n1.jpg: Output in format A6 of the file
hew1l0np.pdf, see
hew1l0n1.
ps /
txt /
pdf /
jpg
hew1: TUB-test chart hew1; TUBJND model with functions Fab, F'ab
Receptor responses R+, G-, Y+ (left & right), and derivations
Y+', Y-' (left & right), and R+'/G-' (right) for a,b

Image hew2l0n1.jpg: Output in format A6 of the file
hew2l0np.pdf, see
hew2l0n1.
ps /
txt /
pdf /
jpg
hew2: TUB-test chart hew2; Fab(xr)-model for visual responses
derivation of the responses; tanh(xr) with e^xr/a and 10^xr/a'
a'=a ln(10); a^n = a^0,5; 4 x 4 images

Image hew3l0n1.jpg: Output in format A6 of the file
hew3l0np.pdf, see
hew3l0n1.
ps /
txt /
pdf /
jpg
hew3: TUB-test chart hew3; Fab(xr)-model for visual responses
derivation of the responses; tanh(xr) with e^xr/a and 10^xr/a'
a'=a ln(10); a^n = a^1,0; 4 x 4 images

Image hew4l0n1.jpg: Output in format A6 of the file
hew4l0np.pdf, see
hew4l0n1.
ps /
txt /
pdf /
jpg
hew4: TUB-test chart hew4; Fab(xr)-model for visual responses
derivation of the responses; tanh(xr) with e^xr/a and 10^xr/a'
a'=a ln(10); a^n = a^0,7; 4 x 4 images

Image hew5l0n1.jpg: Output in format A6 of the file
hew5l0np.pdf, see
hew5l0n1.
ps /
txt /
pdf /
jpg
hew5: TUB-test chart hew5; Fab(xr)-model for visual responses
derivation of the responses; tanh(xr) with e^xr/a and 10^xr/a'
a'=a ln(10); a^n = a^0,5; 4 x 4 images
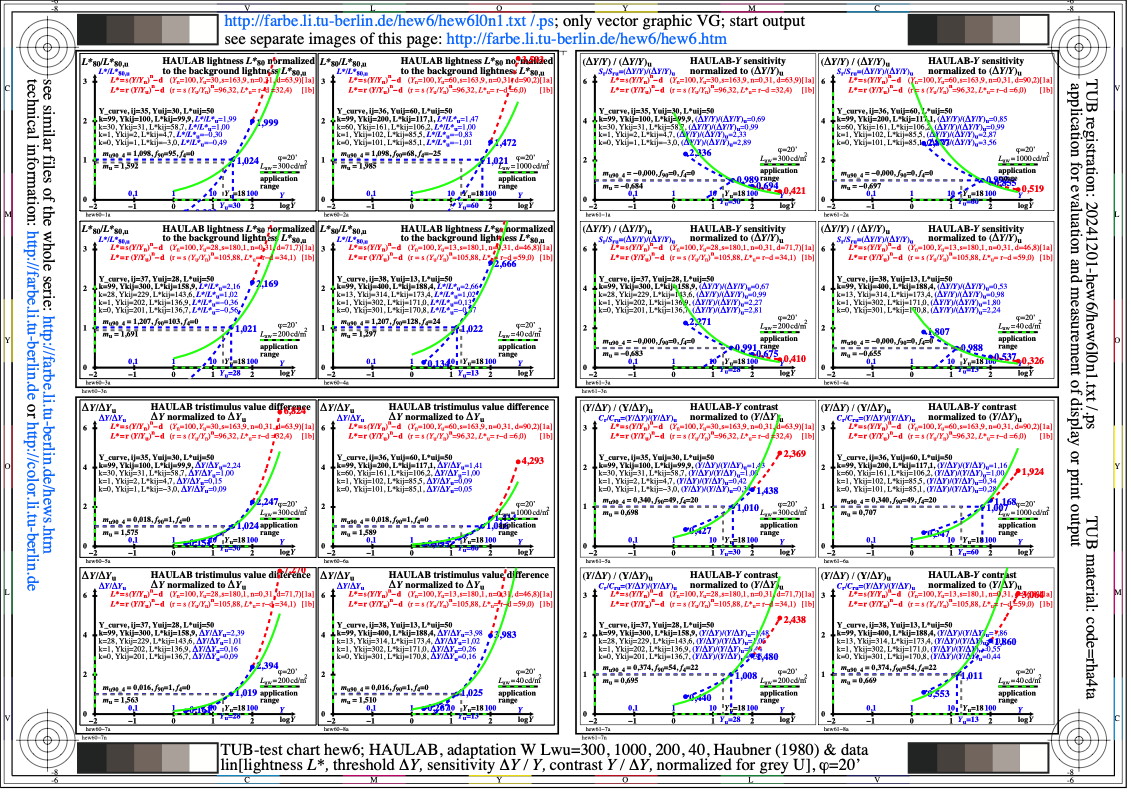
Image hew6l0n1.jpg: Output in format A6 of the file
hew6l0np.pdf, see
hew6l0n1.
ps /
txt /
pdf /
jpg
hew6: TUB-test chart hew6; HAULAB & IEC, Adaptations 300, 1000,
200 & 40 cd/m^2, (Haubner, 1980) & data; lin [ligtness L*,
threshold delta_Y, sensitivity delta_Y/Y, contrast Y/delta_Y]

Image hew7l0n1.jpg: Output in format A6 of the file
hew7l0np.pdf, see
hew7l0n1.
ps /
txt /
pdf /
jpg
hew7: TUB-test chart hew7; HAULAB & IEC, Adaptations 300, 1000,
200 & 40 cd/m^2, (Haubner, 1980) & data; log [ligtness L*,
threshold delta_Y, sensitivity delta_Y/Y, contrast Y/delta_Y]

Image hew8l0n1.jpg: Output in format A6 of the file
hew8l0np.pdf, see
hew8l0n1.
ps /
txt /
pdf /
jpg
hew8: TUB-test chart hew8; HAULAB & IEC, Adaptations 300, 1000,
200 & 40 cd/m^2, (Haubner) & equations; lin [ligtness L*,
threshold delta_Y, sensitivity delta_Y/Y, contrast Y/delta_Y]

Image hew9l0n1.jpg: Output in format A6 of the file
hew9l0np.pdf, see
hew9l0n1.
ps /
txt /
pdf /
jpg
hew9: TUB-test chart hew9; HAULAB & IEC, Adaptations 300, 1000,
200 & 40 cd/m^2, (Haubner) & equations; log [ligtness L*,
threshold delta_Y, sensitivity delta_Y/Y, contrast Y/delta_Y]

Image hex0l0n1.jpg: Output in format A6 of the file
hex0l0np.pdf, see
hex0l0n1.
ps /
txt /
pdf /
jpg
hex0: TUB-test chart hex0; Threshold experiments
Description of the experimental threshold delta Y
Formulae for the description of the lightness F*(Y)

Image hex1l0n1.jpg: Output in format A6 of the file
hex1l0np.pdf, see
hex1l0n1.
ps /
txt /
pdf /
jpg
hex1: TUB-test chart hex1; CIE Y an lightness L*
for surface colours and emissive displays
Chromaticity and chromatic values of Ostwald- colours

Image hex2l0n1.jpg: Output in format A6 of the file
hex2l0np.pdf, see
hex2l0n1.
ps /
txt /
pdf /
jpg
hex2: TUB-test chart hex2; Comparison of Qab(xr) and Fab(xr)
Line elements as integral an derivation
tanh(xr) mit e^(xr/a) und 10^(xr/a')

Image hex3l0n1.jpg: Output in format A6 of the file
hex3l0np.pdf, see
hex3l0n1.
ps /
txt /
pdf /
jpg
hex3: TUB-test chart hex3; Q/Fab(xr)-models for visual responses
Q/Fab(xr) with hyperbel functions e^(xr/a) and 10^(xr/a')
with contants a'=a ln(10) and a^n = a^1,0

Image hex4l0n1.jpg: Output in format A6 of the file
hex4l0np.pdf, see
hex4l0n1.
ps /
txt /
pdf /
jpg
hex4: TUB-test chart hex4; Fab(xr)-model for visual responses
Application of hyperbel function tanh on receptor responses
Presentation of the functions and derivation for discrimination

Image hex5l0n1.jpg: Output in format A6 of the file
hex5l0np.pdf, see
hex5l0n1.
ps /
txt /
pdf /
jpg
hex5: TUB-test chart hex5; Fab(xr)-model for visual responses
derivation of the responses; tanh(xr) with e^xr/a and 10^xr/a'
a'=a ln(10); a^n = a^0,7; 4 x 4 images

Image hex6l0n1.jpg: Output in format A6 of the file
hex6l0np.pdf, see
hex6l0n1.
ps /
txt /
pdf /
jpg
hex6: TUB-test chart hex6; Fab(xr)-model for visual responses
derivation of the responses; tanh(xr) with e^xr/a and 10^xr/a'
a'=a ln(10); a^n = a^0,5; 4 x 4 images

Image hex7l0n1.jpg: Output in format A6 of the file
hex7l0np.pdf, see
hex7l0n1.
ps /
txt /
pdf /
jpg
hex7: TUB-test chart hex7; Fab(xr)-model for visual responses
derivation of the responses; tanh(xr) with e^xr/a and 10^xr/a'
a'=a ln(10); a^n = a^1,0; 4 x 4 images

Image hex8l0n1.jpg: Output in format A6 of the file
hex8l0np.pdf, see
hex8l0n1.
ps /
txt /
pdf /
jpg
hex8: TUB-test chart hex8; Fab(xr)-model for visual responses
derivation of the responses; tanh(xr) with e^xr/a and 10^xr/a'
a'=a ln(10); a^n = a^0,7; 4 x 4 images

Image hex9l0n1.jpg: Output in format A6 of the file
hex9l0np.pdf, see
hex9l0n1.
ps /
txt /
pdf /
jpg
hex9: TUB-test chart hex9; Fab(xr)-model for visual responses
derivation of the responses; tanh(xr) with e^xr/a and 10^xr/a'
a'=a ln(10); a^n = a^0,5; 4 x 4 images

Image hey0l0n1.jpg: Output in format A6 of the file
hey0l0np.pdf, see
hey0l0n1.
ps /
txt /
pdf /
jpg
hey0: TUB-test chart hey0; Q/Fab(xr)-models for visual responses
Q/Fab(xr) with hyperbel functions e^(xr/a) and 10^(xr/a')
with contants a'=a ln(10) and a^n = a^1,0

Image hey1l0n1.jpg: Output in format A6 of the file
hey1l0np.pdf, see
hey1l0n1.
ps /
txt /
pdf /
jpg
hey1: TUB-test chart hey1; Fab(xr)-model for visual responses
Application of hyperbel function tanh on receptor responses
Presentation of the functions and derivation for discrimination

Image hey2l0n1.jpg: Output in format A6 of the file
hey2l0np.pdf, see
hey2l0n1.
ps /
txt /
pdf /
jpg
hey2: TUB-test chart hey2; Q/Fab(xr)-models for visual responses
Q/Fab(xr) with hyperbel functions e^(xr/a) and 10^(xr/a')
with contants a'=a ln(10) and a^n = a^1,0

Image hey3l0n1.jpg: Output in format A6 of the file
hey3l0np.pdf, see
hey3l0n1.
ps /
txt /
pdf /
jpg
hey3: TUB-test chart hey3; TUBJND model with functions Fab, F'ab
Receptor responses R+, G-, Y+ (left & right), and derivations
R+', G-' (right) for diferent parameters a,b
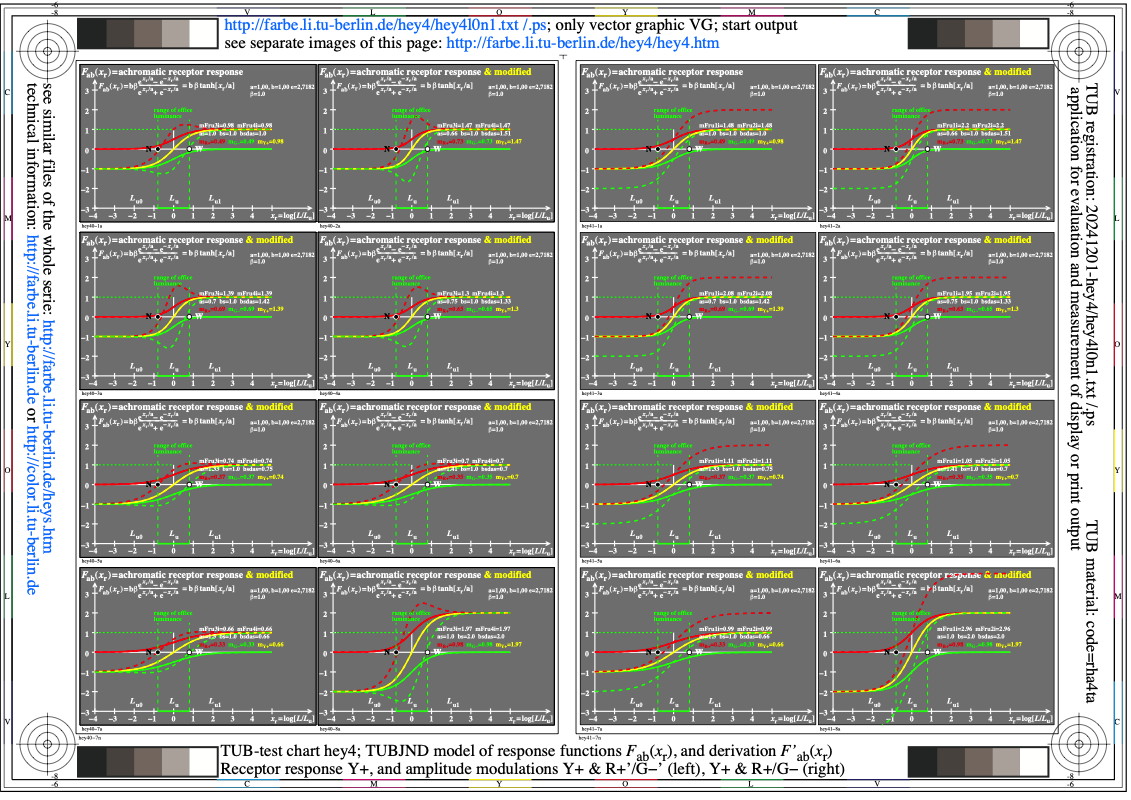
Image hey4l0n1.jpg: Output in format A6 of the file
hey4l0np.pdf, see
hey4l0n1.
ps /
txt /
pdf /
jpg
hey4: TUB-test chart hey4; TUBJND model with functions Fab, F'ab
Receptor responses R+, G-, Y+ (left & right) and amplitude
modulations Y+ & R+'/G-' (left), Y+ & R+/G- (right) for a,b

Image hey5l0n1.jpg: Output in format A6 of the file
hey5l0np.pdf, see
hey5l0n1.
ps /
txt /
pdf /
jpg
hey5: TUB-test chart hey5; TUBJND model with functions Fab, F'ab
Receptor responses R+, G-, Y+ (left & right), and derivations
Y+', Y-' (left & right), and R+'/G-' (right) for a,b

Image hey6l0n1.jpg: Output in format A6 of the file
hey6l0np.pdf, see
hey6l0n1.
ps /
txt /
pdf /
jpg
hey6: TUB-test chart hey6; Fab(xr)-model for visual responses
derivation of the responses; tanh(xr) with e^xr/a and 10^xr/a'
a'=a ln(10); a^n = a^0,5; 4 x 4 images
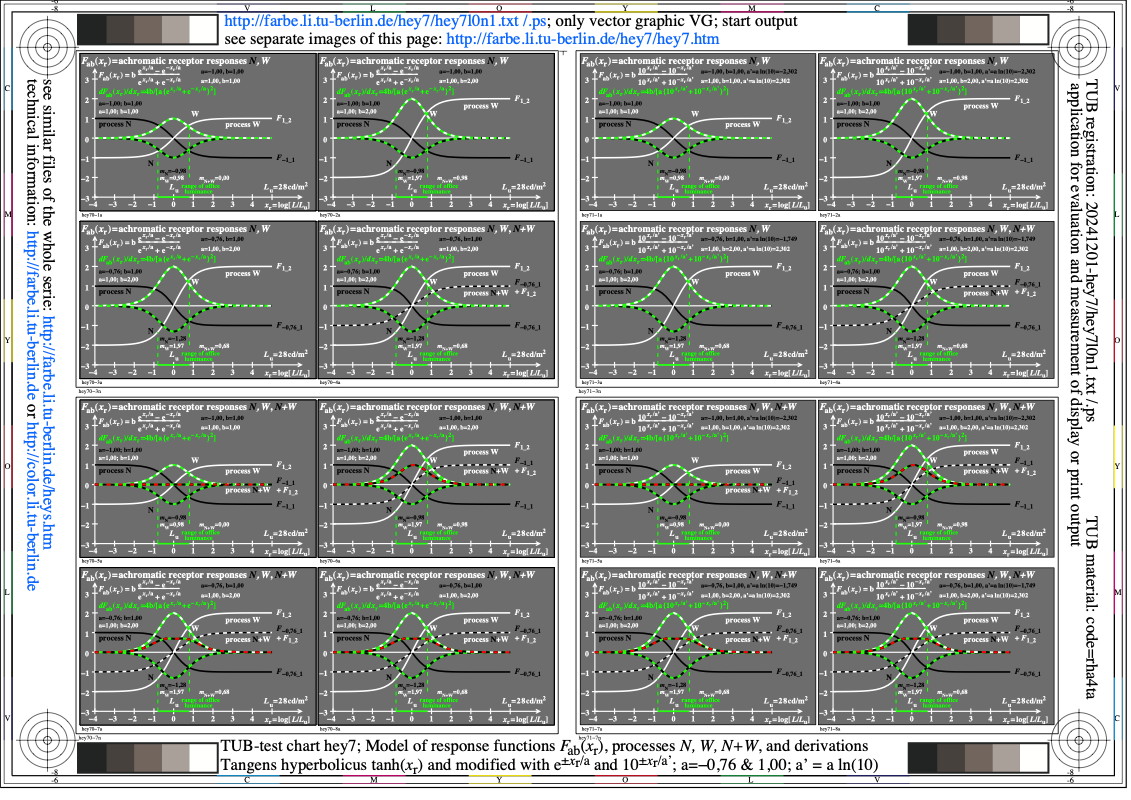
Image hey7l0n1.jpg: Output in format A6 of the file
hey7l0np.pdf, see
hey7l0n1.
ps /
txt /
pdf /
jpg
hey7: TUB-test chart hey7; Fab(xr)-model for visual responses
derivation of the responses; tanh(xr) with e^xr/a and 10^xr/a'
a'=a ln(10); a^n = a^1,0; 4 x 4 images

Image hey8l0n1.jpg: Output in format A6 of the file
hey8l0np.pdf, see
hey8l0n1.
ps /
txt /
pdf /
jpg
hey8: TUB-test chart hey8; Fab(xr)-model for visual responses
derivation of the responses; tanh(xr) with e^xr/a and 10^xr/a'
a'=a ln(10); a^n = a^0,7; 4 x 4 images

Image hey9l0n1.jpg: Output in format A6 of the file
hey9l0np.pdf, see
hey9l0n1.
ps /
txt /
pdf /
jpg
hey9: TUB-test chart hey9; Fab(xr)-model for visual responses
derivation of the responses; tanh(xr) with e^xr/a and 10^xr/a'
a'=a ln(10); a^n = a^0,5; 4 x 4 images
Image hez0l0n1.jpg: Output in format A6 of the file
hez0l0np.pdf, see
hez0l0n1.
ps /
txt /
pdf /
jpg
hez0: TUB-test chart hez0; Layout of test charts
Four single images (0/1)-(3/7)n per page
in the size 120mm x 85mm
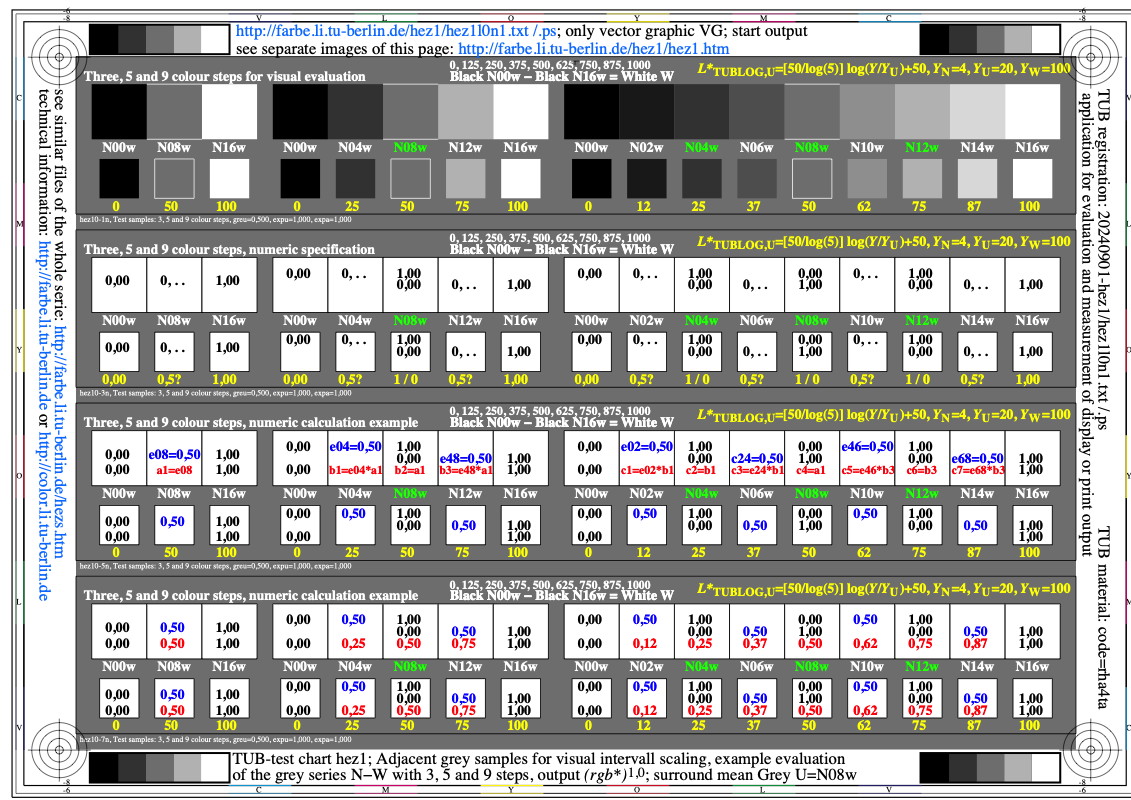
Image hez1l0n1.jpg: Output in format A6 of the file
hez1l0np.pdf, see
hez1l0n1.
ps /
txt /
pdf /
jpg
hez1: TUB-test chart hez1; Adjacent grey samples
for visual interval scaling, example evaluation of the
grey series N-W, output (rgb*)^1,0, surround mean grey U=N08w

Image hez2l0n1.jpg: Output in format A6 of the file
hez2l0np.pdf, see
hez2l0n1.
ps /
txt /
pdf /
jpg
hez2: TUB-test chart hez2; Adjacent grey samples
for visual interval scaling, example evaluation of the
grey series N-W, output (rgb*)^0,5, surround mean grey U=N08w

Image hez3l0n1.jpg: Output in format A6 of the file
hez3l0np.pdf, see
hez3l0n1.
ps /
txt /
pdf /
jpg
hez3: TUB-test chart hez3; Layout of test charts
4 multi images (0/1)-(3/7)a in size 120mm x 85mm
16 sub images (0/1)-(1..8)a in size 60mm x 40mm
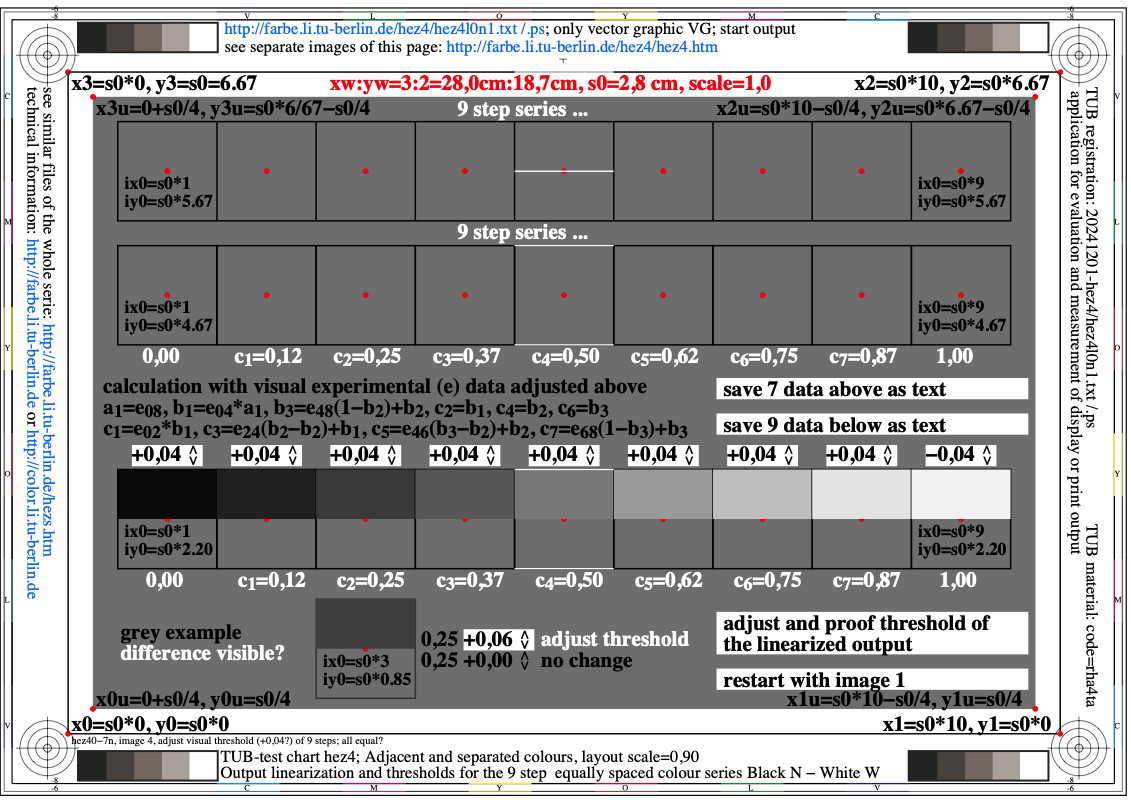
Image hez4l0n1.jpg: Output in format A6 of the file
hez4l0np.pdf, see
hez4l0n1.
ps /
txt /
pdf /
jpg
hez4: TUB-test chart hez4; Adjacent and separate colours
of nine steps; layout scale=0,90; output linearization
and thresholds for colour series Black N - White W

Image hez5l0n1.jpg: Output in format A6 of the file
hez5l0np.pdf, see
hez5l0n1.
ps /
txt /
pdf /
jpg
hez5: TUB-test chart hez5; Adjacent and separate colours
of nine steps; layout scale=1,00; output linearization
and thresholds for colour series Black N - White W

Image hez6l0n1.jpg: Output in format A6 of the file
hez6l0np.pdf, see
hez6l0n1.
ps /
txt /
pdf /
jpg
hez6: TUB-test chart hez6; Adjacent and separate colours
of nine steps; layout scale=0,50; output linearization
and thresholds for colour series Black N - White W
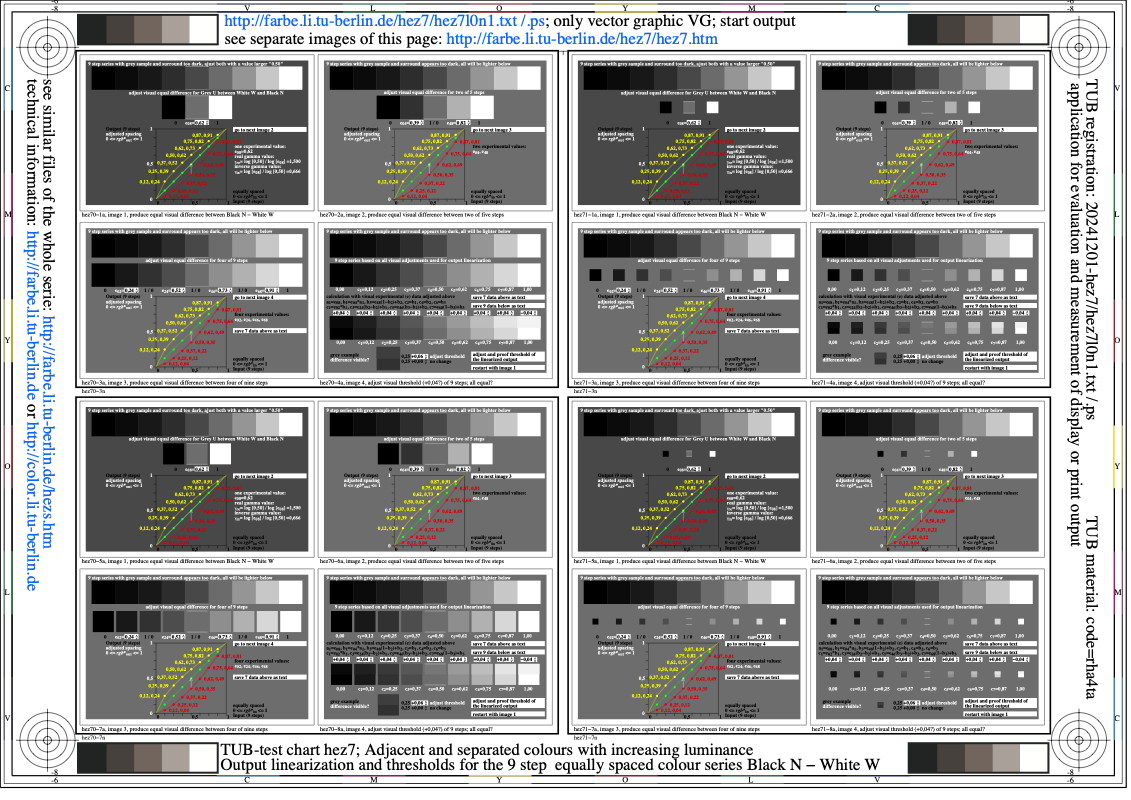
Image hez7l0n1.jpg: Output in format A6 of the file
hez7l0np.pdf, see
hez7l0n1.
ps /
txt /
pdf /
jpg
hez7: TUB-test chart hez7; Adjacent and separate colours
of nine steps with increaing luminance; output linearization
and thresholds for colour series Black N - White W

Image hez8l0n1.jpg: Output in format A6 of the file
hez8l0np.pdf, see
hez8l0n1.
ps /
txt /
pdf /
jpg
hez8: TUB-test chart hez8; Adjacent and separate colours
of nine steps with increaing luminance; output linearization
and thresholds for colour series Black N - White W

Image hez9l0n1.jpg: Output in format A6 of the file
hez9l0np.pdf, see
hez9l0n1.
ps /
txt /
pdf /
jpg
hez9: TUB-test chart hez9; Adjacent and separate colours
of nine steps; layout scale=0,425; output linearization
and thresholds for colour series Black N - White W
Section 2, Chapter H:
SDR and HDR-colour metric for optimal colour-image quality (2025)
This image page with 260 image series:
he2s in English,
hg2s in German.
Previous image page:
ge2s in English,
gg2s in German.
Next image page, see
ie2s in English,
ig2s in German.
Introduction, content list and summary:
heai,
hea_i,
hea_s in English or
hgai,
hga_i,
hga_s in German.
-------
Für Archiv-Information (2000-2009) des BAM servers "www.ps.bam.de"
(2000-2018)
über Prüfvorlagen,
farbmetrische Berechnungen, Normen und Veröffentlichungen, siehe
indexAE.html in englisch,
indexAG.html in deutsch.
Zurück zur TUB-Hauptseite (NICHT Archiv), siehe
index.html in englisch,
indexDE.html. in deutsch.