241201 1L2L0X0B_S2710.KTS/YEDLBIN.KTS, http://farbe.li.tu-berlin.de/BEDS.HTM or http://color.li.tu-berlin.de/BEDS.HTM
For links to the
Section 2, Chapter B
Colour Vision and Colourimetry (2020),
see
For this image page with 10 colour series, see
BEDS in English,
BGDS in German.
For the previous image page, see
BECS in English,
BGCS in German.
For the next image page, see
BEES in English,
BGES in German.
For the first image page of the previous chapter A, see
AEAS in English,
AGAS in German.
For the first image page of the next chapter C, see
CEAS in English,
CGAS in German.
Content list of chapter B:
BEA_I in English or
BGA_I in German.
Summary of chapter B:
BEA_S in English or
BGA_S in German.
For the large image page of chapter B with 260 colour series, see
be2s in English or
bg2s in German.
Section 2, Chapter B
Colour vision and Colorimetry (2020),
Image part BEDS
for 8 Planck-illuminants Pxx, and for 8 daylight illuminants Dxx;
for complementary optimal colours of antagonistic tristimulues values X10, Y10, Z10, and
Xw10-X10, Yw10-Y10, Zw10-Z10 in the CIE chromaticity diagram (x10, y10);
for four contrast steps C=25:1, 10:1, 4:1, and 2:1
1. Introduction and goals.
2. Location of complementary Ostwald-optimal colours in the CIE (x10, y10) chromaticity diagram.
2. Approximately equal chromatic values CAB2,10 for all Ostwald-optimal colours.
3. Decreasing of chromaticity difference between colour and white
for any of the four contrast steps C=25:1, 10:1, 4:1, and 2:1.
4. Change of the triangle location in (x10, y10) to a circular location
in the chromatic value diagrams (A2,10, B2,10) for any of the four contrast steps C and discussion.
The following ten pages BED0 to BED9 of this chapter
show the content with links to the single figures
in up to six formats.
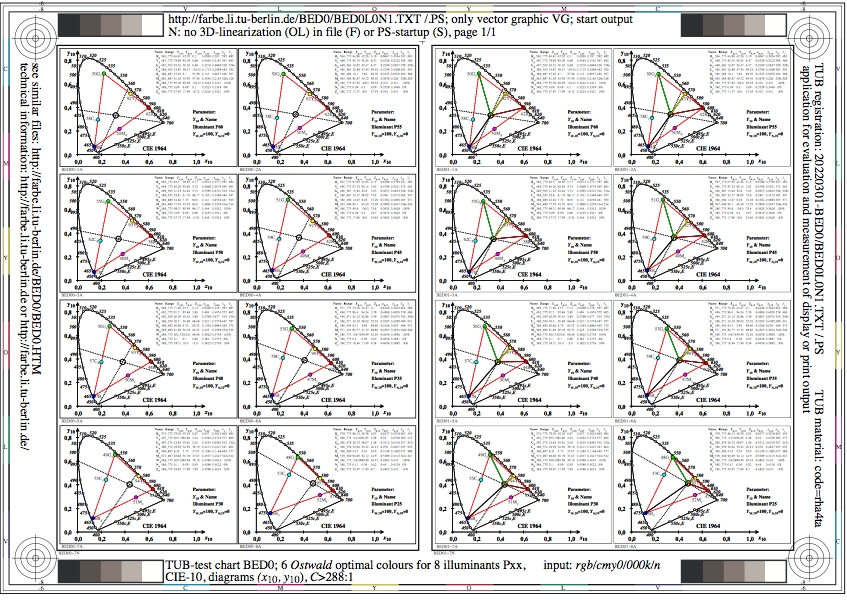
Figure BED0L0N1.jpg: Output in format A6 of the file
BED0L0NP.PDF, see
BED0L0N1.
PS /
TXT /
PDF /
jpg
BED0: TUB-test chart BED0; 6 Ostwald optimal colours
for 8 illuminants Pxx, CIE-10-degree observer, chromaticity
diagram (x10, y10), contrast C>=288:1
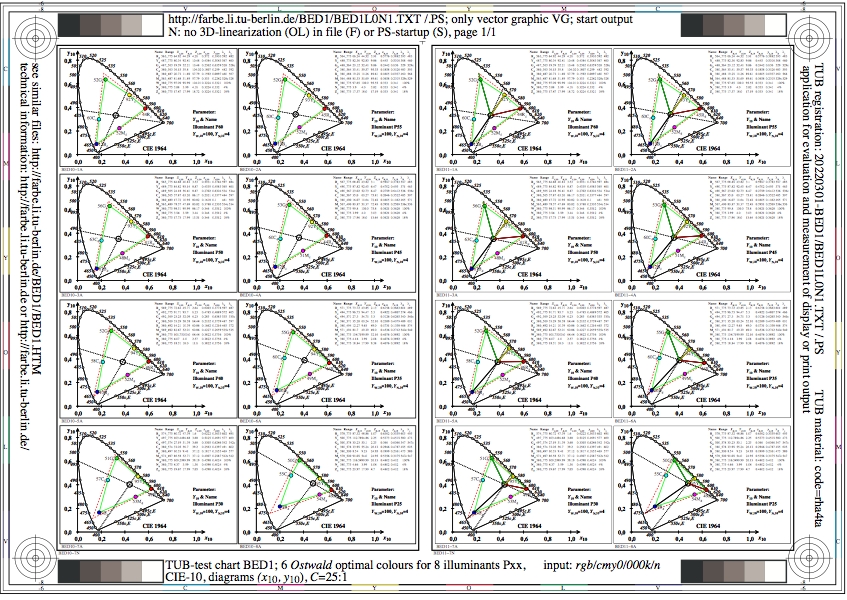
Figure BED1L0N1.jpg: Output in format A6 of the file
BED1L0NP.PDF, see
BED1L0N1.
PS /
TXT /
PDF /
jpg
BED1: TUB-test chart BED1; 6 Ostwald optimal colours
for 8 illuminants Pxx, CIE-10-degree observer, chromaticity
diagram (x10, y10), contrast C=25:1
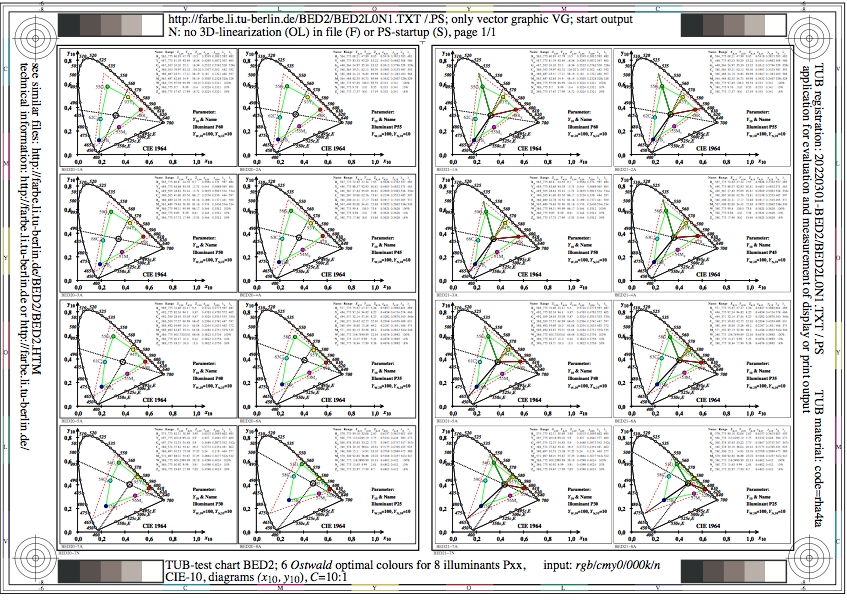
Figure BED2L0N1.jpg: Output in format A6 of the file
BED2L0NP.PDF, see
BED2L0N1.
PS /
TXT /
PDF /
jpg
BED2: TUB-test chart BED2; 6 Ostwald optimal colours
for 8 illuminants Pxx, CIE-10-degree observer, chromaticity
diagram (x10, y10), contrast C=10:1
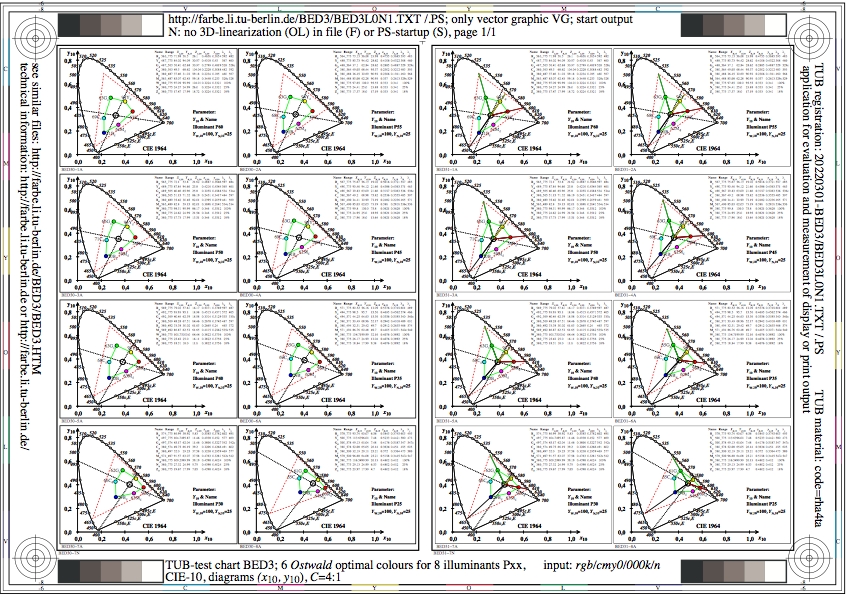
Figure BED3L0N1.jpg: Output in format A6 of the file
BED3L0NP.PDF, see
BED3L0N1.
PS /
TXT /
PDF /
jpg
BED3: TUB-test chart BED3; 6 Ostwald optimal colours
for 8 illuminants Pxx, CIE-10-degree observer, chromaticity
diagram (x10, y10), contrast C=4:1
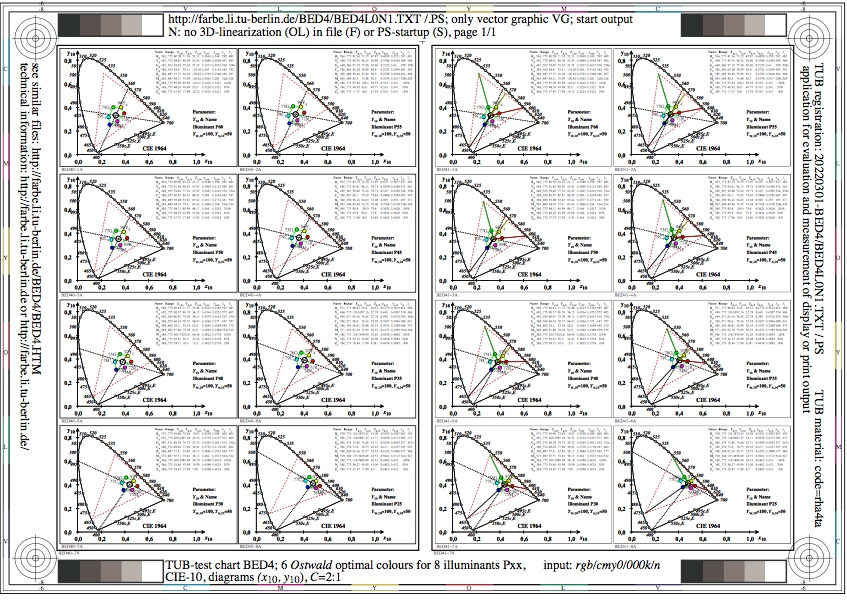
Figure BED4L0N1.jpg: Output in format A6 of the file
BED4L0NP.PDF, see
BED4L0N1.
PS /
TXT /
PDF /
jpg
BED4: TUB-test chart BED4; 6 Ostwald optimal colours
for 8 illuminants Pxx, CIE-10-degree observer, chromaticity
diagram (x10, y10), contrast C=2:1
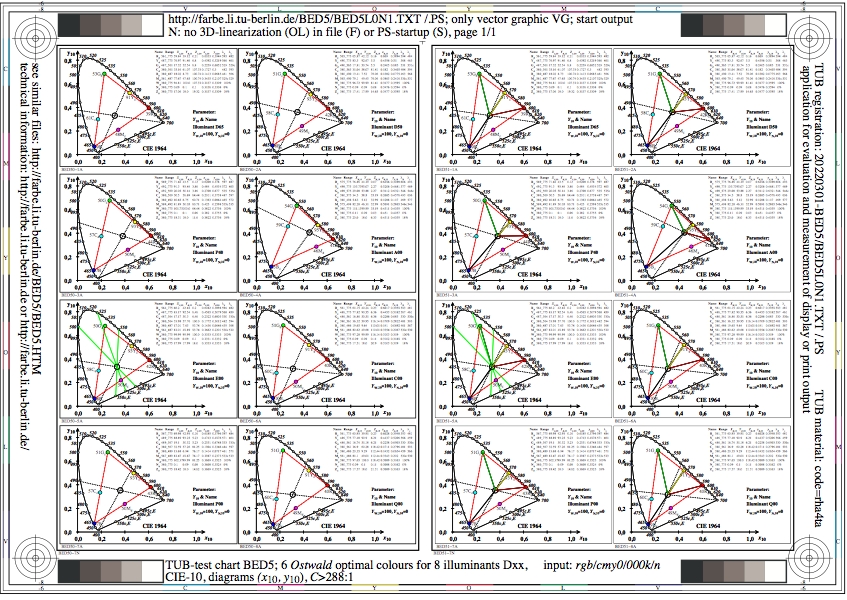
Figure BED5L0N1.jpg: Output in format A6 of the file
BED5L0NP.PDF, see
BED5L0N1.
PS /
TXT /
PDF /
jpg
BED5: TUB-test chart BED5; 6 Ostwald optimal colours
for 8 illuminants Dxx, CIE-10-degree observer, chromaticity
diagram (x10, y10), contrast C>=288:1

Figure BED6L0N1.jpg: Output in format A6 of the file
BED6L0NP.PDF, see
BED6L0N1.
PS /
TXT /
PDF /
jpg
BED6: TUB-test chart BED6; 6 Ostwald optimal colours
for 8 illuminants Dxx, CIE-10-degree observer, chromaticity
diagram (x10, y10), contrast C=25:1
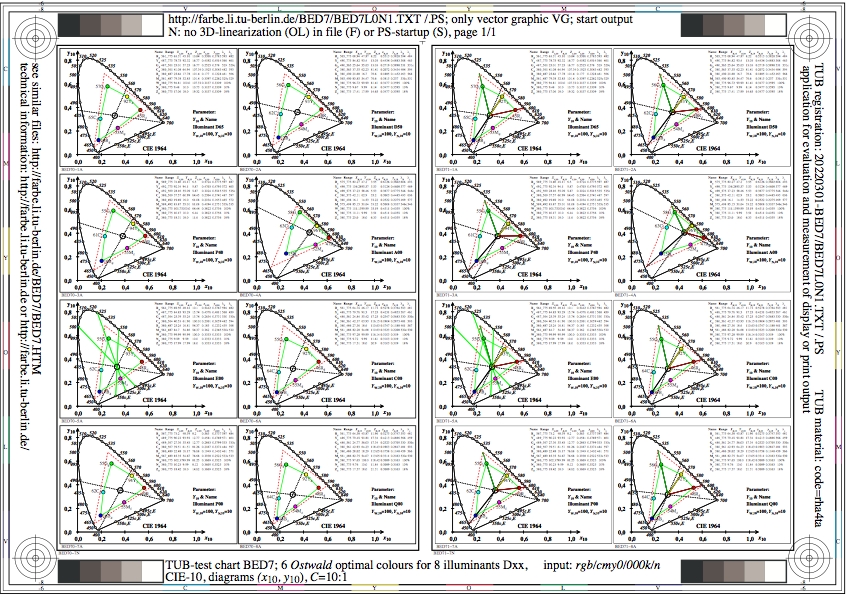
Figure BED7L0N1.jpg: Output in format A6 of the file
BED7L0NP.PDF, see
BED7L0N1.
PS /
TXT /
PDF /
jpg
BED7: TUB-test chart BED7; 6 Ostwald optimal colours
for 8 illuminants Dxx, CIE-10-degree observer, chromaticity
diagram (x10, y10), contrast C=10:1

Figure BED8L0N1.jpg: Output in format A6 of the file
BED8L0NP.PDF, see
BED8L0N1.
PS /
TXT /
PDF /
jpg
BED8: TUB-test chart BED8; 6 Ostwald optimal colours
for 8 illuminants Dxx, CIE-10-degree observer, chromaticity
diagram (x10, y10), contrast C=4:1
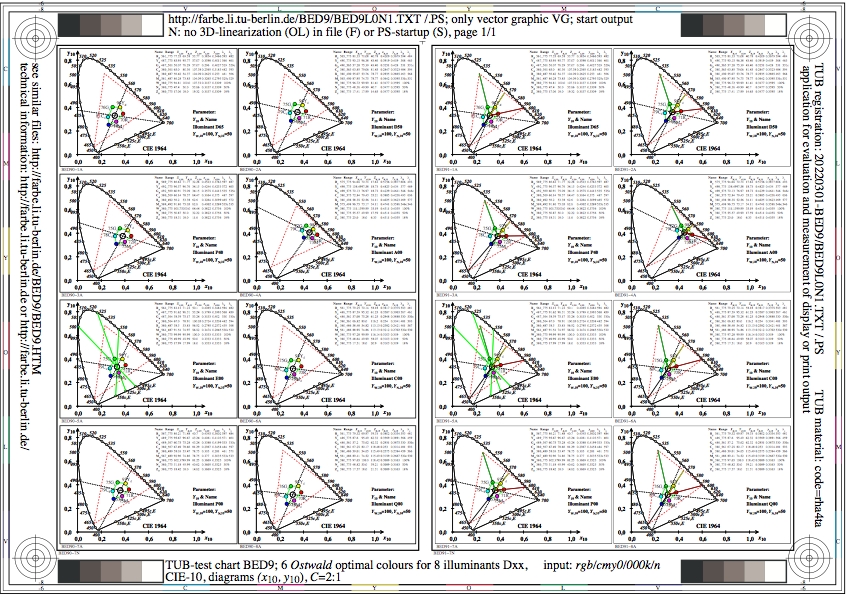
Figure BED9L0N1.jpg: Output in format A6 of the file
BED9L0NP.PDF, see
BED9L0N1.
PS /
TXT /
PDF /
jpg
BED9: TUB-test chart BED9; 6 Ostwald optimal colours
for 8 illuminants Dxx, CIE-10-degree observer, chromaticity
diagram (x10, y10), contrast C=2:1
-------
For the archive information (2000-2009) of the BAM server "www.ps.bam.de"
(2000-2018)
about colour test charts, colorimetric calculations,
standards, and publications, see
indexAE.html in English,
indexAG.html in German.
Back to the main page of this TUB web site (NOT archive), see
index.html in English,
indexDE.html in German.