Figure DEF0L0N1.jpg: Output in format A6 of the file DEF0L0NP.PDF, see
DEF0L0N1. PS / TXT / PDF / jpg
241201 1L2L0X0D_S2710.KTS/YEFLDIN.KTS, http://farbe.li.tu-berlin.de/DEFS.HTM or http://color.li.tu-berlin.de/DEFS.HTM
For links to the
Section 2, Chapter D
Colour Appearance, Elementary Colours, and Metrics (2022),
see
For this image page with 10 colour series, see
DEFS in English,
DGFS in German.
For the previous image page, see
DEES in English,
DGES in German.
For the next image page, see
DEGS in English,
DGGS in German.
For the first image page of the previous chapter C, see
CEAS in English,
CGAS in German.
For the first image page of the next chapter E, see
eeas in English,
egas in German.
Content list of chapter D:
DEA_I in English or
DGA_I in German.
Summary of chapter D:
DEA_S in English or
DGA_S in German.
For the large image page of chapter D with 260 colour series, see
de2s in English or
dg2s in German.
Section 2, Chapter D
Colour Appearance, Elementary Colours, and Metrics (2022),
Image part DEFS
The following ten pages DEF0 to DEF9 of this chapter
show the content with links to the single figures
in up to six formats.
Figure DEF0L0N1.jpg: Output in format A6 of the file
DEF0L0NP.PDF, see
DEF0L0N1.
PS /
TXT /
PDF /
jpg
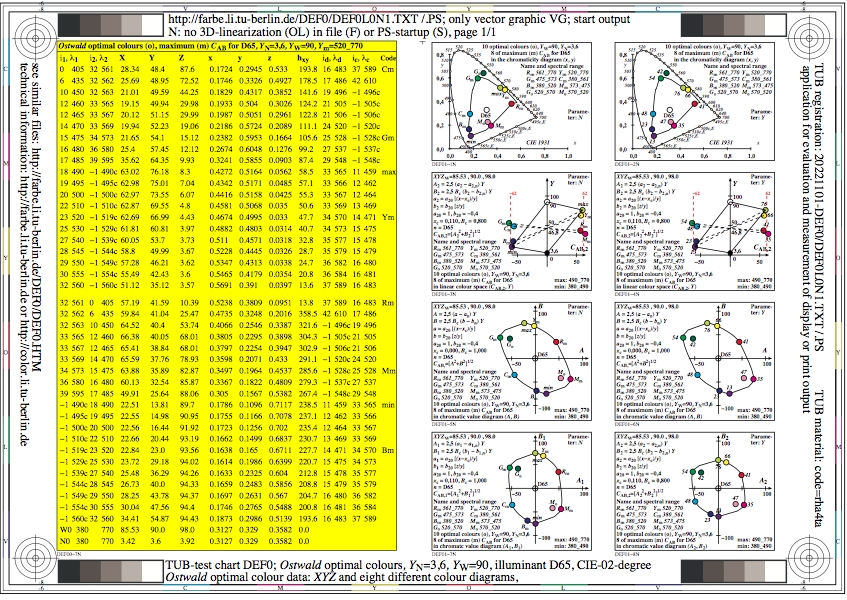
DEF0: TUB-test chart DEF0; Ostwald-optimal colours
YN=3,6, YW=90, CIE illuminant D65, CIE 02 degree
XYZ data, wavelength limits, and 8 colour diagrams
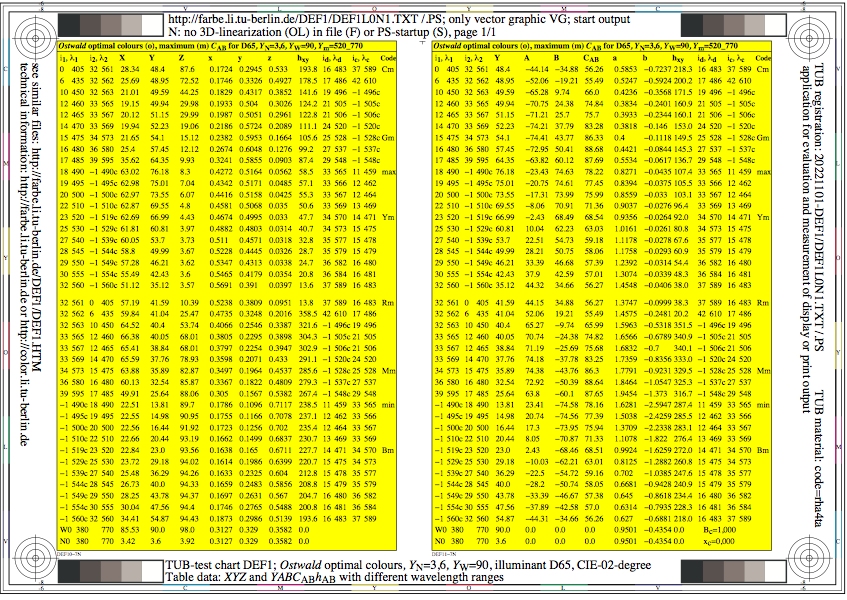
Figure DEF1L0N1.jpg: Output in format A6 of the file
DEF1L0NP.PDF, see
DEF1L0N1.
PS /
TXT /
PDF /
jpg
DEF1: TUB-test chart DEF1; Ostwald-optimal colours
YN=3,6, YW=90, CIE illuminant D65, CIE 02 degree
Table data XYZ and YABCh with wavelength limits
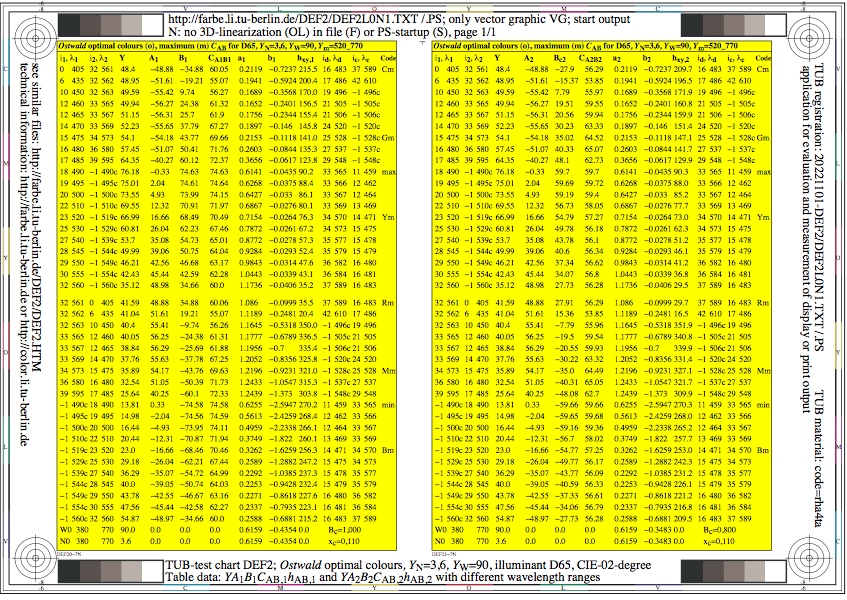
Figure DEF2L0N1.jpg: Output in format A6 of the file
DEF2L0NP.PDF, see
DEF2L0N1.
PS /
TXT /
PDF /
jpg
DEF2: TUB-test chart DEF2; Ostwald-optimal colours
YN=3,6, YW=90, CIE illuminant D65, CIE 02 degree
Table data YABCh1 and YABCh2 with wavelength limits

Figure DEF3L0N1.jpg: Output in format A6 of the file
DEF3L0NP.PDF, see
DEF3L0N1.
PS /
TXT /
PDF /
jpg
DEF3: TUB-test chart DEF3; Ostwald-optimal colours
YN=3,6, YW=90, CIE illuminant D50, CIE 02 degree
XYZ data, wavelength limits, and 8 colour diagrams
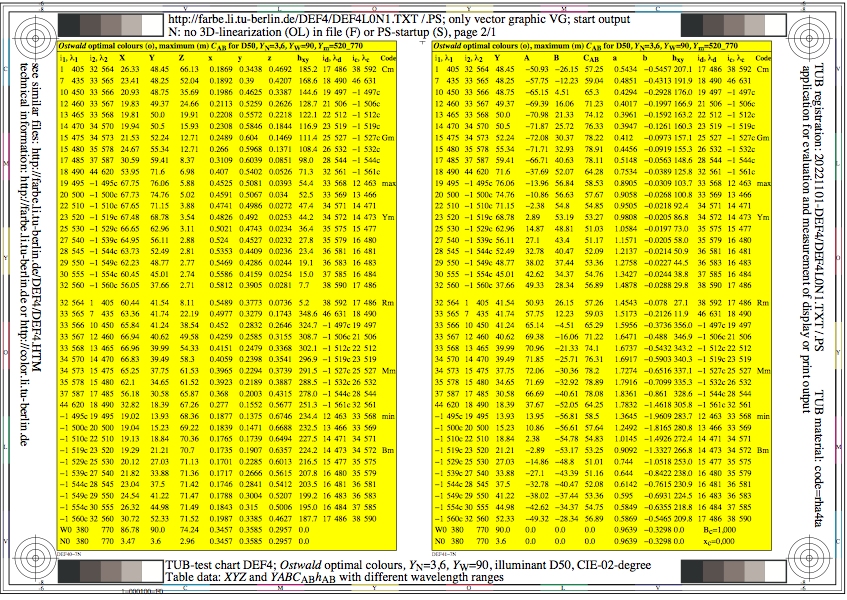
Figure DEF4L0N1.jpg: Output in format A6 of the file
DEF4L0NP.PDF, see
DEF4L0N1.
PS /
TXT /
PDF /
jpg
DEF4: TUB-test chart DEF4; Ostwald-optimal colours
YN=3,6, YW=90, CIE illuminant D50, CIE 02 degree
Table data XYZ and YABCh with wavelength limits
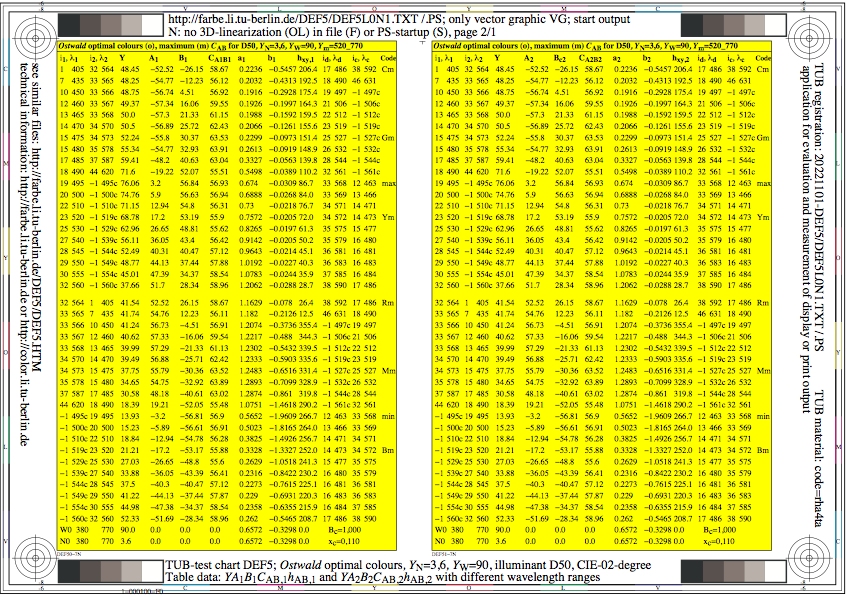
Figure DEF5L0N1.jpg: Output in format A6 of the file
DEF5L0NP.PDF, see
DEF5L0N1.
PS /
TXT /
PDF /
jpg
DEF5: TUB-test chart DEF5; Ostwald-optimal colours
YN=3,6, YW=90, CIE illuminant D50, CIE 02 degree
Table data YABCh1 and YABCh2 with wavelength limits

Figure DEF6L0N1.jpg: Output in format A6 of the file
DEF6L0NP.PDF, see
DEF6L0N1.
PS /
TXT /
PDF /
jpg
DEF6: TUB-test chart DEF6; Ostwald-optimal colours
YN=3,6, YW=90, CIE illuminant A, CIE 02 degree
XYZ data, wavelength limits, and 8 colour diagrams
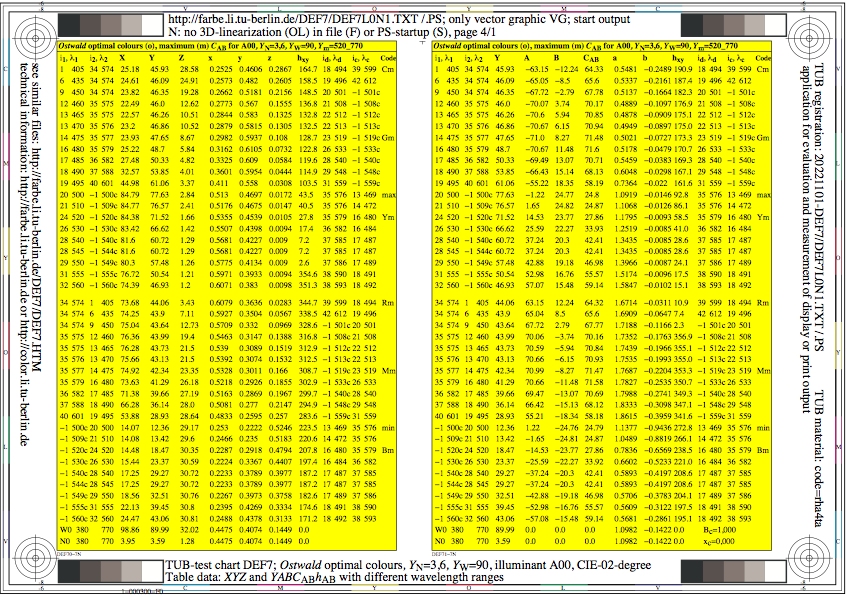
Figure DEF7L0N1.jpg: Output in format A6 of the file
DEF7L0NP.PDF, see
DEF7L0N1.
PS /
TXT /
PDF /
jpg
DEF7: TUB-test chart DEF7; Ostwald-optimal colours
YN=3,6, YW=90, CIE illuminant A, CIE 02 degree
Table data XYZ and YABCh with wavelength limits
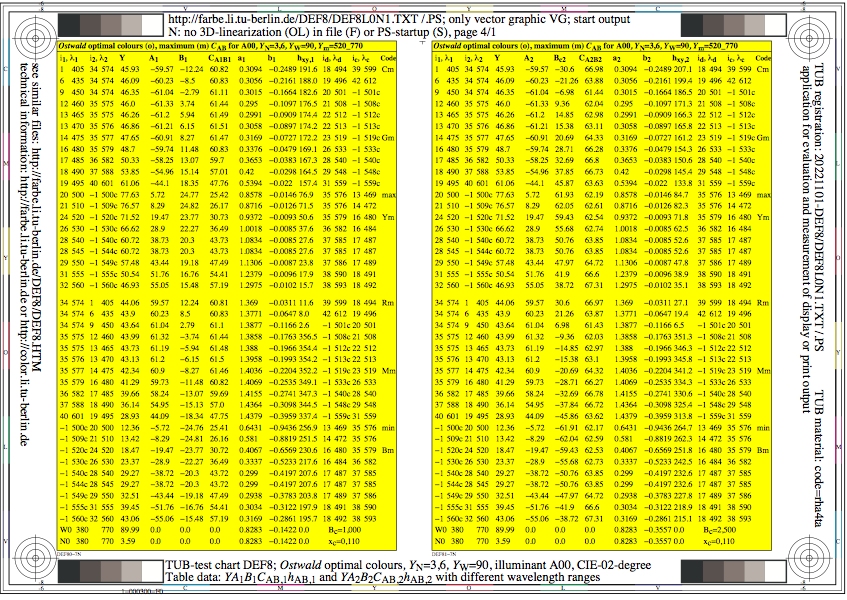
Figure DEF8L0N1.jpg: Output in format A6 of the file
DEF8L0NP.PDF, see
DEF8L0N1.
PS /
TXT /
PDF /
jpg
DEF8: TUB-test chart DEF8; Ostwald-optimal colours
YN=3,6, YW=90, CIE illuminant A, CIE 02 degree
Table data YABCh1 and YABCh2 with wavelength limits
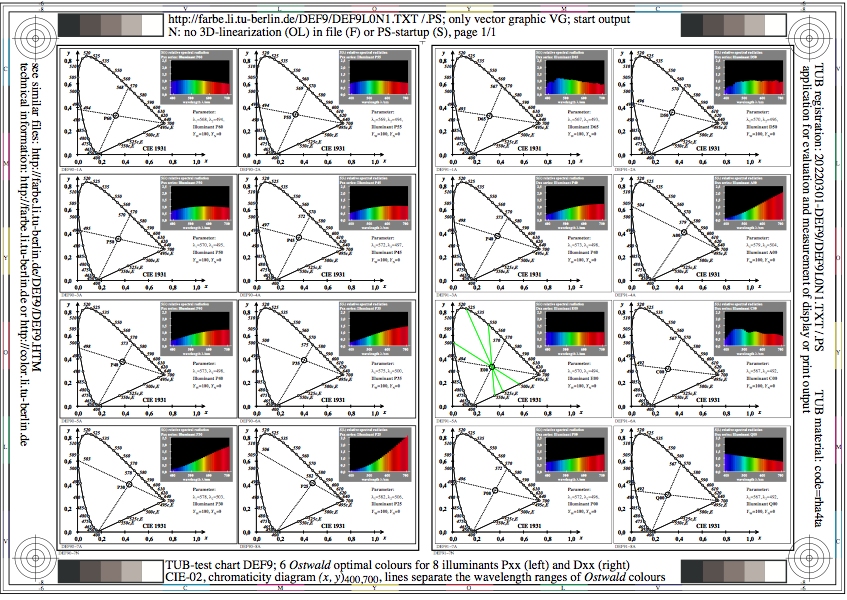
Figure DEF9L0N1.jpg: Output in format A6 of the file
DEF9L0NP.PDF, see
DEF9L0N1.
PS /
TXT /
PDF /
jpg
DEF9: TUB-test chart DEF9; 8 spectral radiations of Pxx and Dxx
and Dxx for calculation of Ostwald optimal colours;
wavelength limits by (x,y)400,700; CIE 02-degree observer
-------
For the archive information (2000-2009) of the BAM server "www.ps.bam.de"
(2000-2018)
about colour test charts, colorimetric calculations,
standards, and publications, see
indexAE.html in English,
indexAG.html in German.
Back to the main page of this TUB web site (NOT archive), see
index.html in English,
indexDE.html in German.