Figure DEQ0L0N1.jpg: Output in format A6 of the file DEQ0L0NP.PDF, see
DEQ0L0N1. PS / TXT / PDF / jpg
240215 1L2L0X0D_S2710.KTS/YEQLDIN.KTS, http://farbe.li.tu-berlin.de/DEQS.HTM or http://color.li.tu-berlin.de/DEQS.HTM
For links to the
Section 2, Chapter D
Colour Appearance, Elementary Colours, and Metrics (2022),
see
For this image page with 10 colour series, see
DEQS in English,
DGQS in German.
For the previous image page, see
DEPS in English,
DGPS in German.
For the next image page, see
DERS in English,
DGRS in German.
For the first image page of the previous chapter C, see
CEAS in English,
CGAS in German.
For the first image page of the next chapter E, see
eeas in English,
egas in German.
Content list of chapter D:
DEA_I in English or
DGA_I in German.
Summary of chapter D:
DEA_S in English or
DGA_S in German.
For the large image page of chapter D with 260 colour series, see
de2s in English or
dg2s in German.
Section 2, Chapter D
Colour Appearance, Elementary Colours, and Metrics (2022),
Image part DEQS
The following ten pages DEQ0 to DEQ9 of this chapter
show the content with links to the single figures
in up to six formats.
Figure DEQ0L0N1.jpg: Output in format A6 of the file
DEQ0L0NP.PDF, see
DEQ0L0N1.
PS /
TXT /
PDF /
jpg
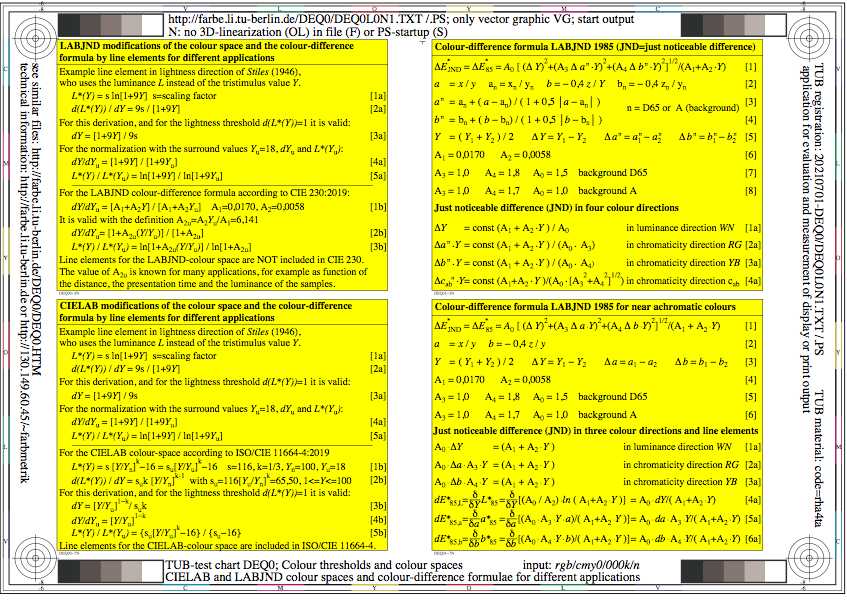
DEQ0: TUB-test chart DEQ0; Colour threholds and colour spaces
CIELAB and LABJND colour spaces, and colour differences
for different applications
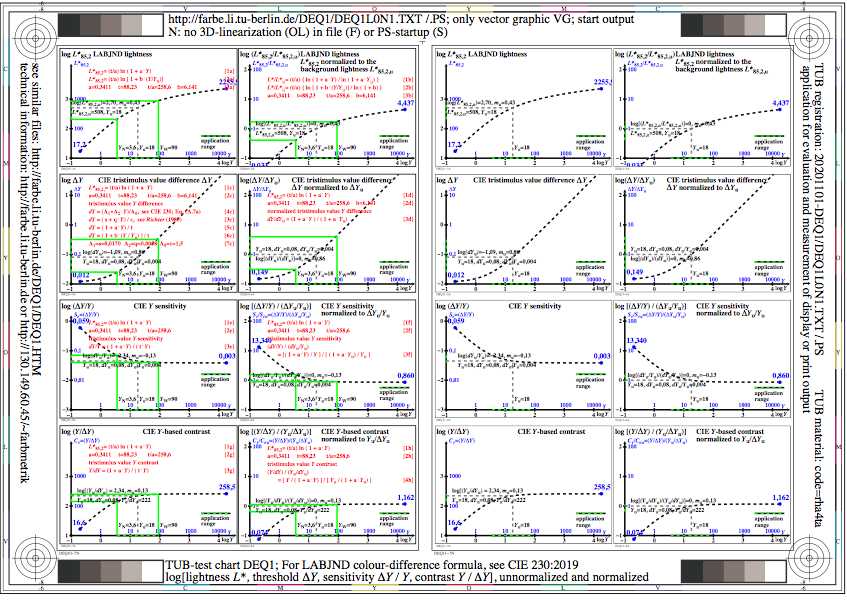
Figure DEQ1L0N1.jpg: Output in format A6 of the file
DEQ1L0NP.PDF, see
DEQ1L0N1.
PS /
TXT /
PDF /
jpg
DEQ1: TUB-test chart DEQ1; LABJND-line elements of CIE 230:2019
log[lightness L*], threshold delta Y
sensitivity (delta Y)/Y and contrast Y/(delta Y)]
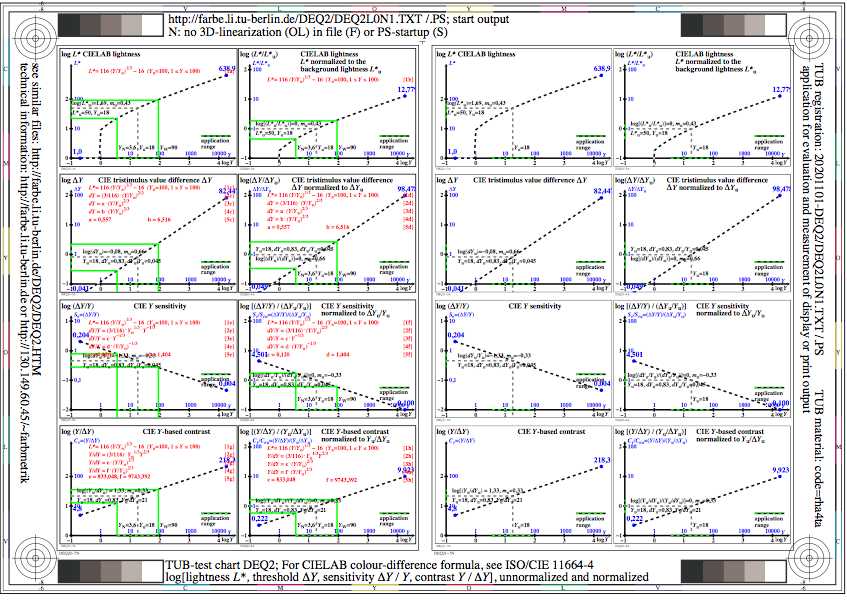
Figure DEQ2L0N1.jpg: Output in format A6 of the file
DEQ2L0NP.PDF, see
DEQ2L0N1.
PS /
TXT /
PDF /
jpg
DEQ2: TUB-test chart DEQ2; CIELAB-line elements of ISO/CIE 11664-4
log[lightness L*], threshold delta Y
sensitivity (delta Y)/Y and contrast Y/(delta Y)]
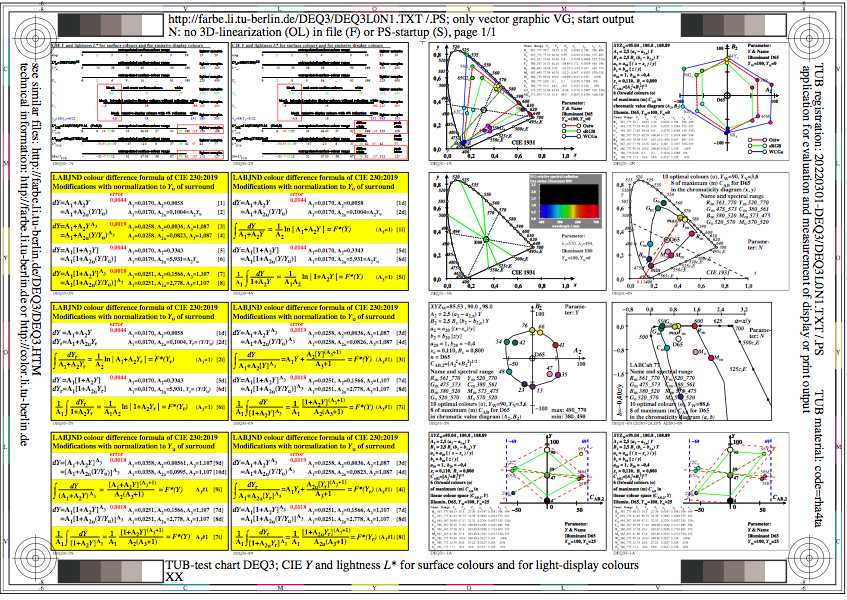
Figure DEQ3L0N1.jpg: Output in format A6 of the file
DEQ3L0NP.PDF, see
DEQ3L0N1.
PS /
TXT /
PDF /
jpg
DEQ3: TUB-test chart DEQ3; CIE Y an lightness L*
for surface colours and emissive displays
Chromaticity and chromatic values of Ostwald- colours

Figure DEQ4L0N1.jpg: Output in format A6 of the file
DEQ4L0NP.PDF, see
DEQ4L0N1.
PS /
TXT /
PDF /
jpg
DEQ4: TUB-test chart DEQ4; Equally spaced 9 step grey scales for
reflection Yref=0,0, normalisation: white W, L*N_L*W(YN_YW):
18_96(2,5_90), 14_96(1,8_90), 14_125(1,8_180), 8_163(0,9_360)
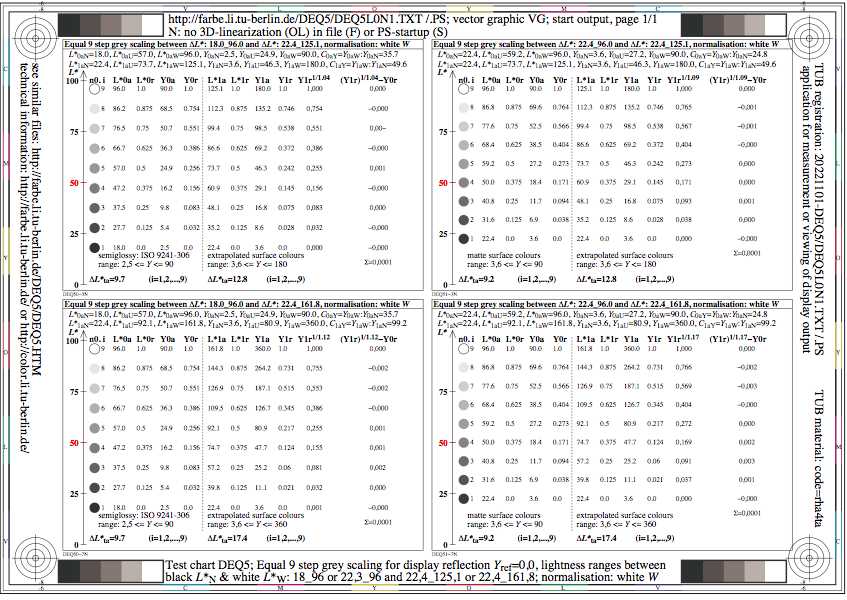
Figure DEQ5L0N1.jpg: Output in format A6 of the file
DEQ5L0NP.PDF, see
DEQ5L0N1.
PS /
TXT /
PDF /
jpg
DEQ5: TUB-test chart DEQ5; Equally spaced 9 step grey scales for
reflection Yref=0,0, normalisation: white W, L*N_L*W(YN_YW):
18_96(2,5_90), 14_96(1,8_90), 22_125(3,6_180), 22_163(3,6_360)
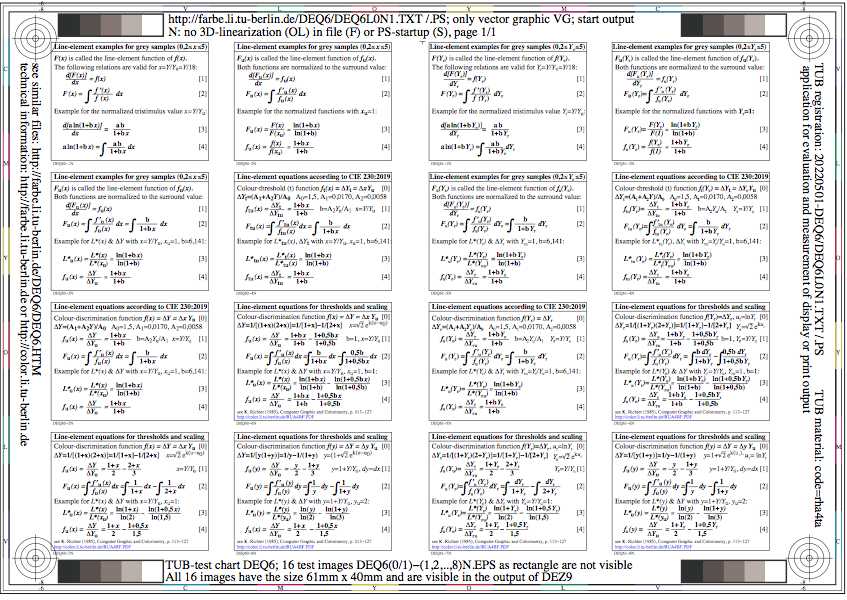
Figure DEQ6L0N1.jpg: Output in format A6 of the file
DEQ6L0NP.PDF, see
DEQ6L0N1.
PS /
TXT /
PDF /
jpg
DEQ6: TUB-test chart DEQ6; Threshold experiments
Description of the experimental threshold delta Y
Formulae for the description of the lightness F*(Y)
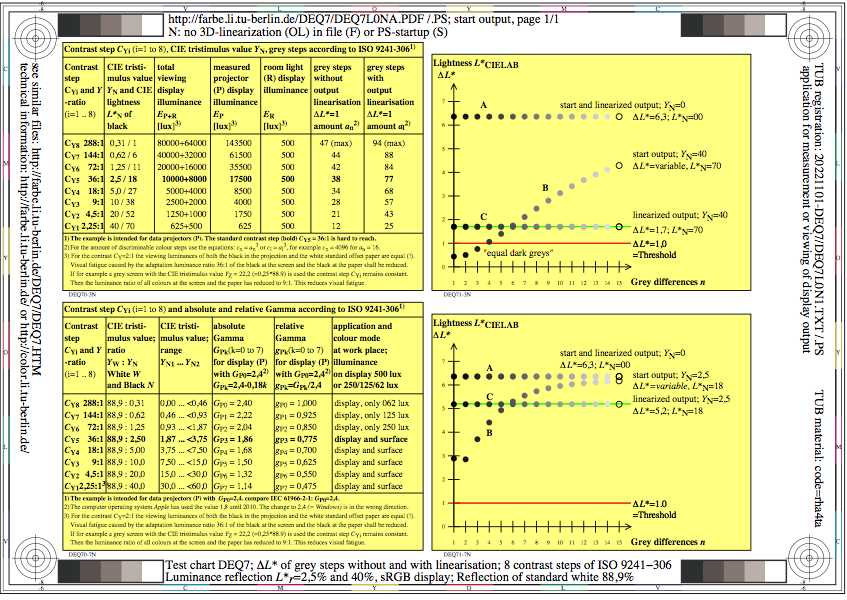
Figure DEQ7L0N1.jpg: Output in format A6 of the file
DEQ7L0NP.PDF, see
DEQ7L0N1.
PS /
TXT /
PDF /
jpg
DEQ7: TUB-test chart DEQ7; 8 contrast steps according to ISO 9241-306
Luminance reflection between 2,5% and 40% for sRGB dislays
Thesholds delta L* of grey steps with and without linearisation

Figure DEQ8L0N1.jpg: Output in format A6 of the file
DEQ8L0NP.PDF, see
DEQ8L0N1.
PS /
TXT /
PDF /
jpg
DEQ8: TUB-test chart DEQ8; Equally spaced 9 step grey scales
for four display reflections Yref=0,4, 90,0, 1,8, 3,6
L*N=4,0 or YN=0,4 and L*W=96 or YW=90, normalisation: white W
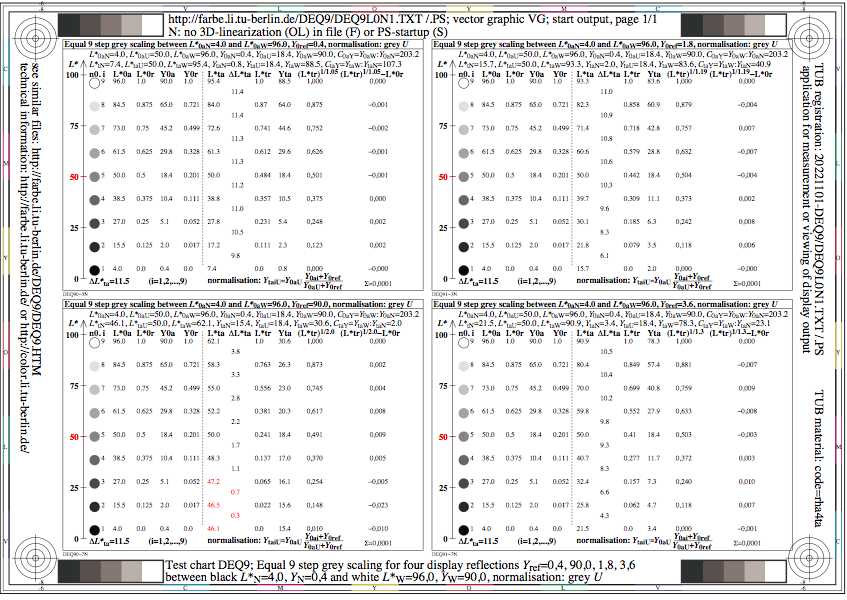
Figure DEQ9L0N1.jpg: Output in format A6 of the file
DEQ9L0NP.PDF, see
DEQ9L0N1.
PS /
TXT /
PDF /
jpg
DEQ9: TUB-test chart DEQ9; Equally spaced 9 step grey scales
for four display reflections Yref=0,4, 90, 1,8, 3,6
L*N=4,0 or YN=0,4 and L*W=96 or YW=90, normalisation: grey U
-------
For the archive information (2000-2009) of the BAM server "www.ps.bam.de"
(2000-2018)
about colour test charts, colorimetric calculations,
standards, and publications, see
indexAE.html in English,
indexAG.html in German.
Back to the main page of this TUB web site (NOT archive), see
index.html in English,
indexDE.html in German.