Figure gep0l0n1.jpg: Output in format A6 of the file gep0l0np.pdf, see
gep0l0n1. ps / txt / pdf / jpg
241201 1L2L0X0G_K2710.KTS/YEplGIN.KTS http://color.li.tu-berlin.de/geps.htm or http://farbe.li.tu-berlin.de/geps.htm
For links to the
Section 2, Chapter G
Equally spaced colour scales for optimal colour-image quality (2024b)
, see
For this image page with 10 colour series, see
geps in English,
ggps in German.
For the previous image page, see
geos in English,
ggos in German.
For the next image page, see
geqs in English,
ggqs in German.
For the first image page of the previous chapter F, see
feas in English,
fgas in German.
For the first image page of the next chapter H (under work), see
heas in English,
hgas in German.
Content list of chapter G:
gea_i in English or
gga_i in German.
Summary of chapter G:
gea_s in English or
gga_s in German.
For the large image page of chapter G with 260 colour series, see
ge2s in English or
gg2s in German.
Section 2, Chapter G
Equally spaced colour scales for optimal colour-image quality (2024b),
Image part geps
The following ten pages gep0 to gep9 of this chapter
show the content with links to the single figures
in up to six formats.
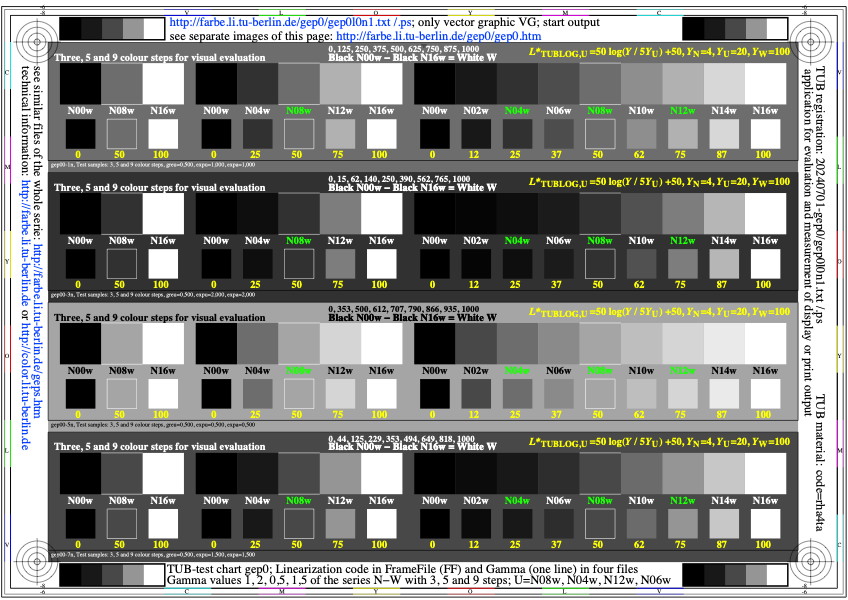
Figure gep0l0n1.jpg: Output in format A6 of the file
gep0l0np.pdf, see
gep0l0n1.
ps /
txt /
pdf /
jpg
gep0: TUB-test chart gep0; Grey samples for intervall scaling
Grey scale of N-W=N00w-N16w=W with Gamma=1, 2, 0,5, and 1,5
with 3 or 5 or 9 steps; surrounds U=N08w, D=N04w, H=N12w, d=N06w
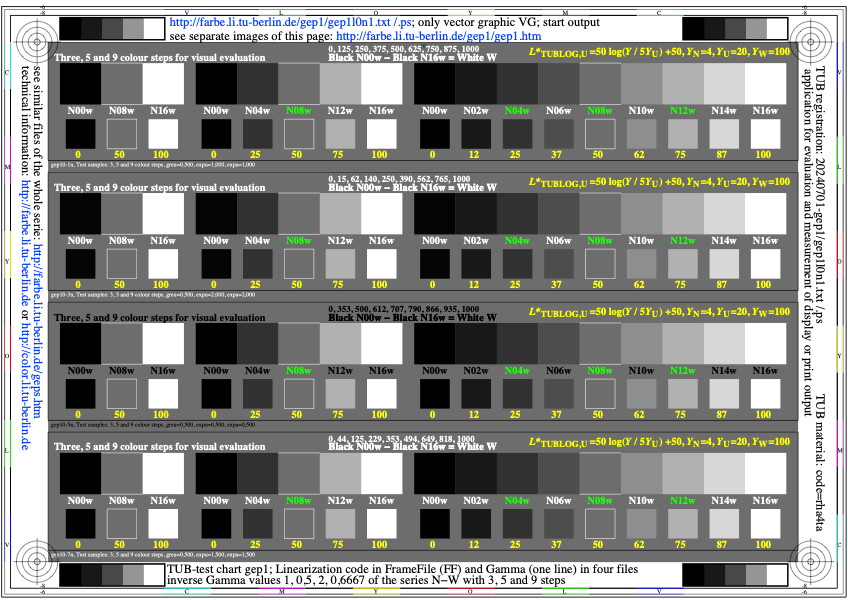
Figure gep1l0n1.jpg: Output in format A6 of the file
gep1l0np.pdf, see
gep1l0n1.
ps /
txt /
pdf /
jpg
gep1: TUB-test chart gep1; Colour samples for intervall scaling
Grey scale of N-W=N00w-N16w=W with Gamma=1, 2, 0,5, and 1,5
with 3 or 5 or 9 steps; constant surround mean Grey U=N08w
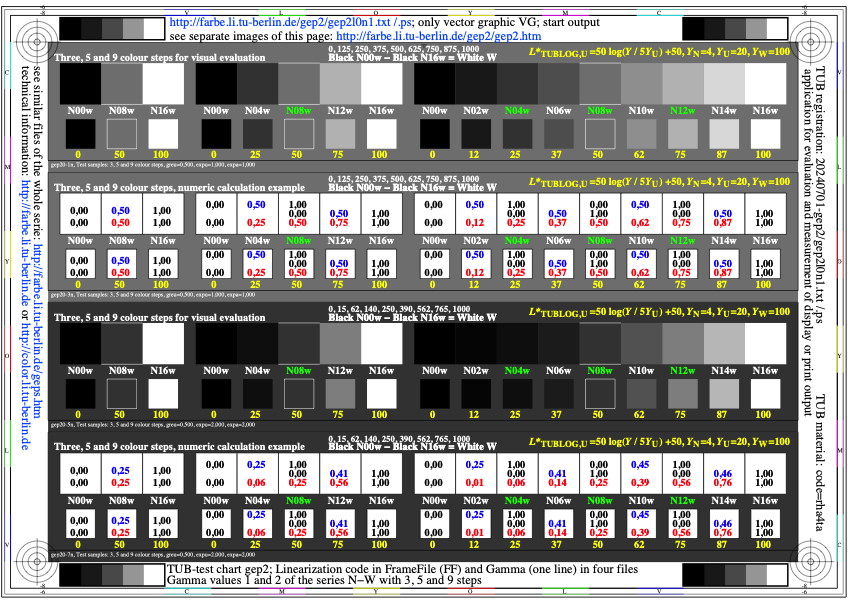
Figure gep2l0n1.jpg: Output in format A6 of the file
gep2l0np.pdf, see
gep2l0n1.
ps /
txt /
pdf /
jpg
gep2: TUB-test chart gep2; Colour samples for intervall scaling
Evaluation of N-W=N00w-N16w=W with Gamma=1,0, and 2,0
with 3 or 5 or 9 steps; surrounds U=N08w and D=N04w
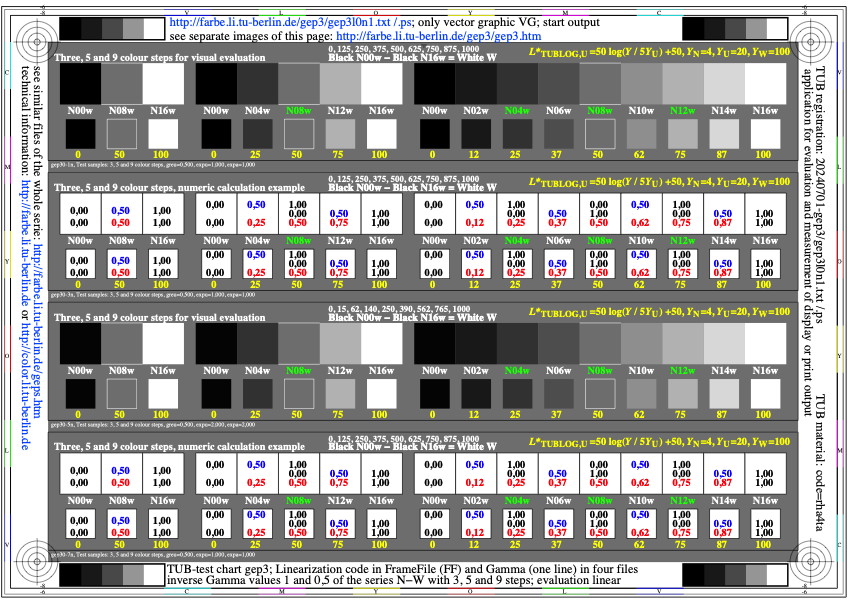
Figure gep3l0n1.jpg: Output in format A6 of the file
gep3l0np.pdf, see
gep3l0n1.
ps /
txt /
pdf /
jpg
gep3: TUB-test chart gep3;Colour samples for intervall scaling
Evaluation of N-W=N00w-N16w=W with Gamma=1,0, and 2,0
with 3 or 5 or 9 steps; constant surround U=N08w
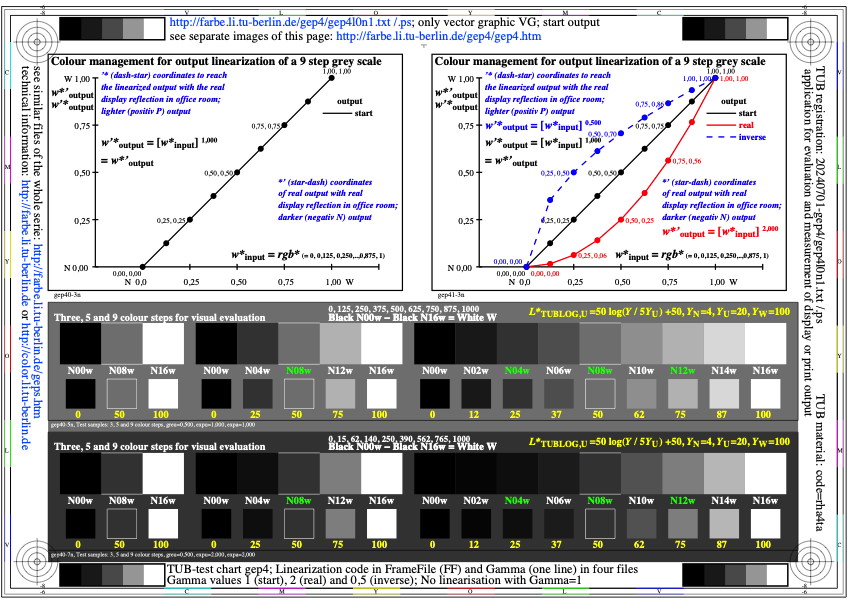
Figure gep4l0n1.jpg: Output in format A6 of the file
gep4l0np.pdf, see
gep4l0n1.
ps /
txt /
pdf /
jpg
gep4: TUB-test chart gep4; Colour samples for intervall scaling
Functions Gamma=1,0 and 2,0 for N-W=N00w-N16w=W
with 3 or 5 or 9 steps; surrounds U=N08w und D=N04w
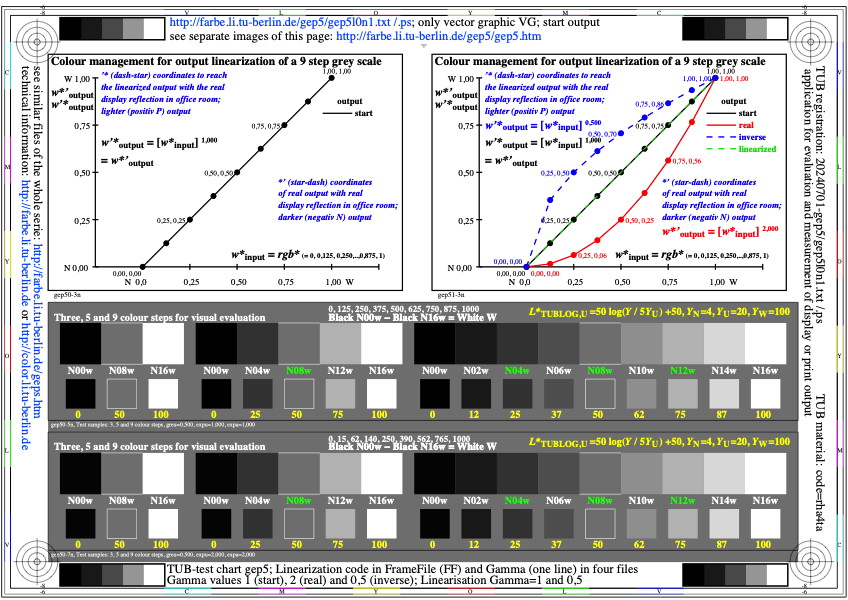
Figure gep5l0n1.jpg: Output in format A6 of the file
gep5l0np.pdf, see
gep5l0n1.
ps /
txt /
pdf /
jpg
gep5: TUB-test chart gep5; Colour samples for intervall scaling
Functions Gamma=1,0 and 0,5 for N-W=N00w-N16w=W
with 3 or 5 or 9 steps; surrounds U=N08w und D=N12w
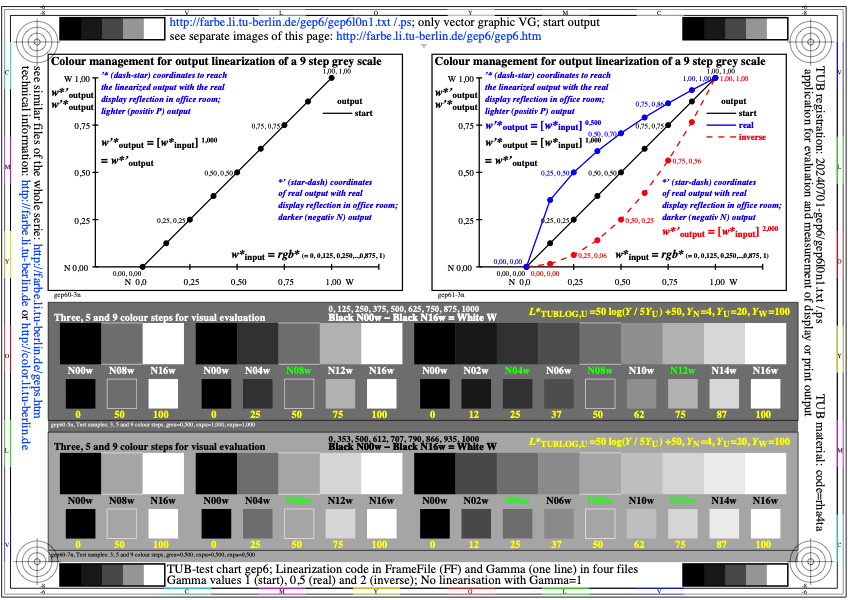
Figure gep6l0n1.jpg: Output in format A6 of the file
gep6l0np.pdf, see
gep6l0n1.
ps /
txt /
pdf /
jpg
gep6: TUB-test chart gep6; Colour samples for intervall scaling
Functions Gamma=1,0 and 1,5 for N-W=N00w-N16w=W
with 3 or 5 or 9 steps; surrounds U=N08w und D=N10w
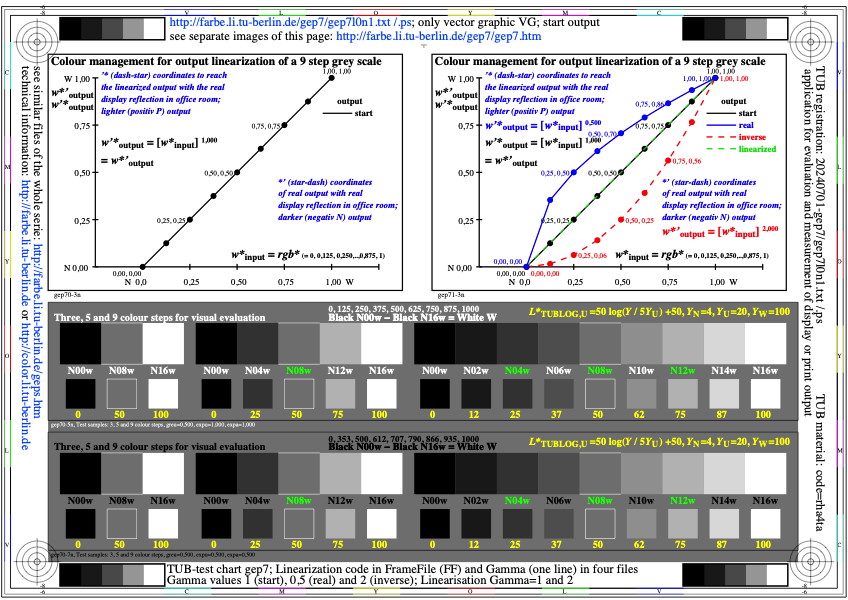
Figure gep7l0n1.jpg: Output in format A6 of the file
gep7l0np.pdf, see
gep7l0n1.
ps /
txt /
pdf /
jpg
gep7: TUB-test chart gep7; Colour samples for intervall scaling
Functions Gamma=1,0 and 2,0 for N-W=N00w-N16w=W
with 3 or 5 or 9 steps; constant surround U=N08w
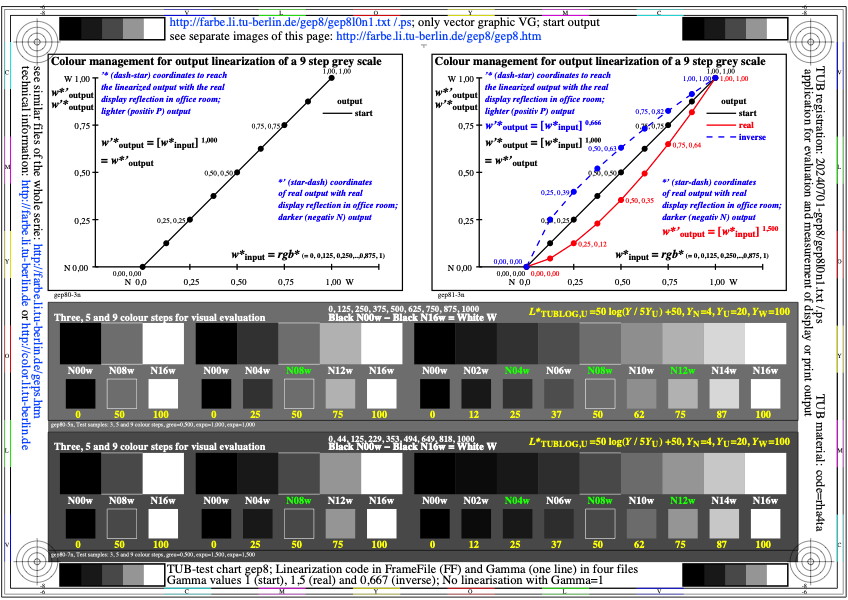
Figure gep8l0n1.jpg: Output in format A6 of the file
gep8l0np.pdf, see
gep8l0n1.
ps /
txt /
pdf /
jpg
gep8: TUB-test chart gep8; Colour samples for intervall scaling
Functions Gamma=1,0 and 0,5 for N-W=N00w-N16w=W
with 3 or 5 or 9 steps; constant surround U=N08w
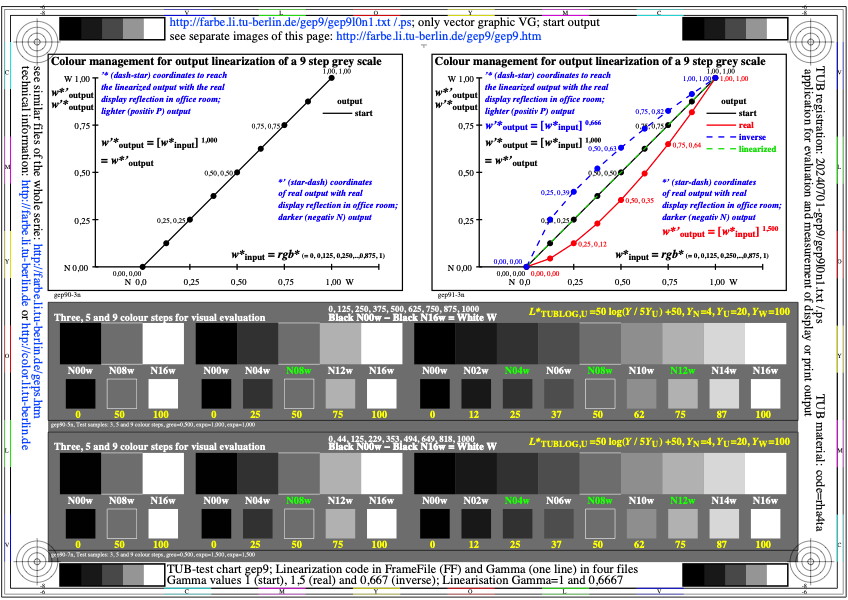
Figure gep9l0n1.jpg: Output in format A6 of the file
gep9l0np.pdf, see
gep9l0n1.
ps /
txt /
pdf /
jpg
gep9: TUB-test chart gep9; Colour samples for intervall scaling
Functions Gamma=1,0 and 1,5 for N-W=N00w-N16w=W
with 3 or 5 or 9 steps; constant surround U=N08w
-------
For the archive information (2000-2009) of the BAM server "www.ps.bam.de"
(2000-2018)
about colour test charts, colorimetric calculations,
standards, and publications, see
indexAE.html in English,
indexAG.html in German.
Back to the main page of this TUB web site (NOT archive), see
index.html in English,
indexDE.html in German.